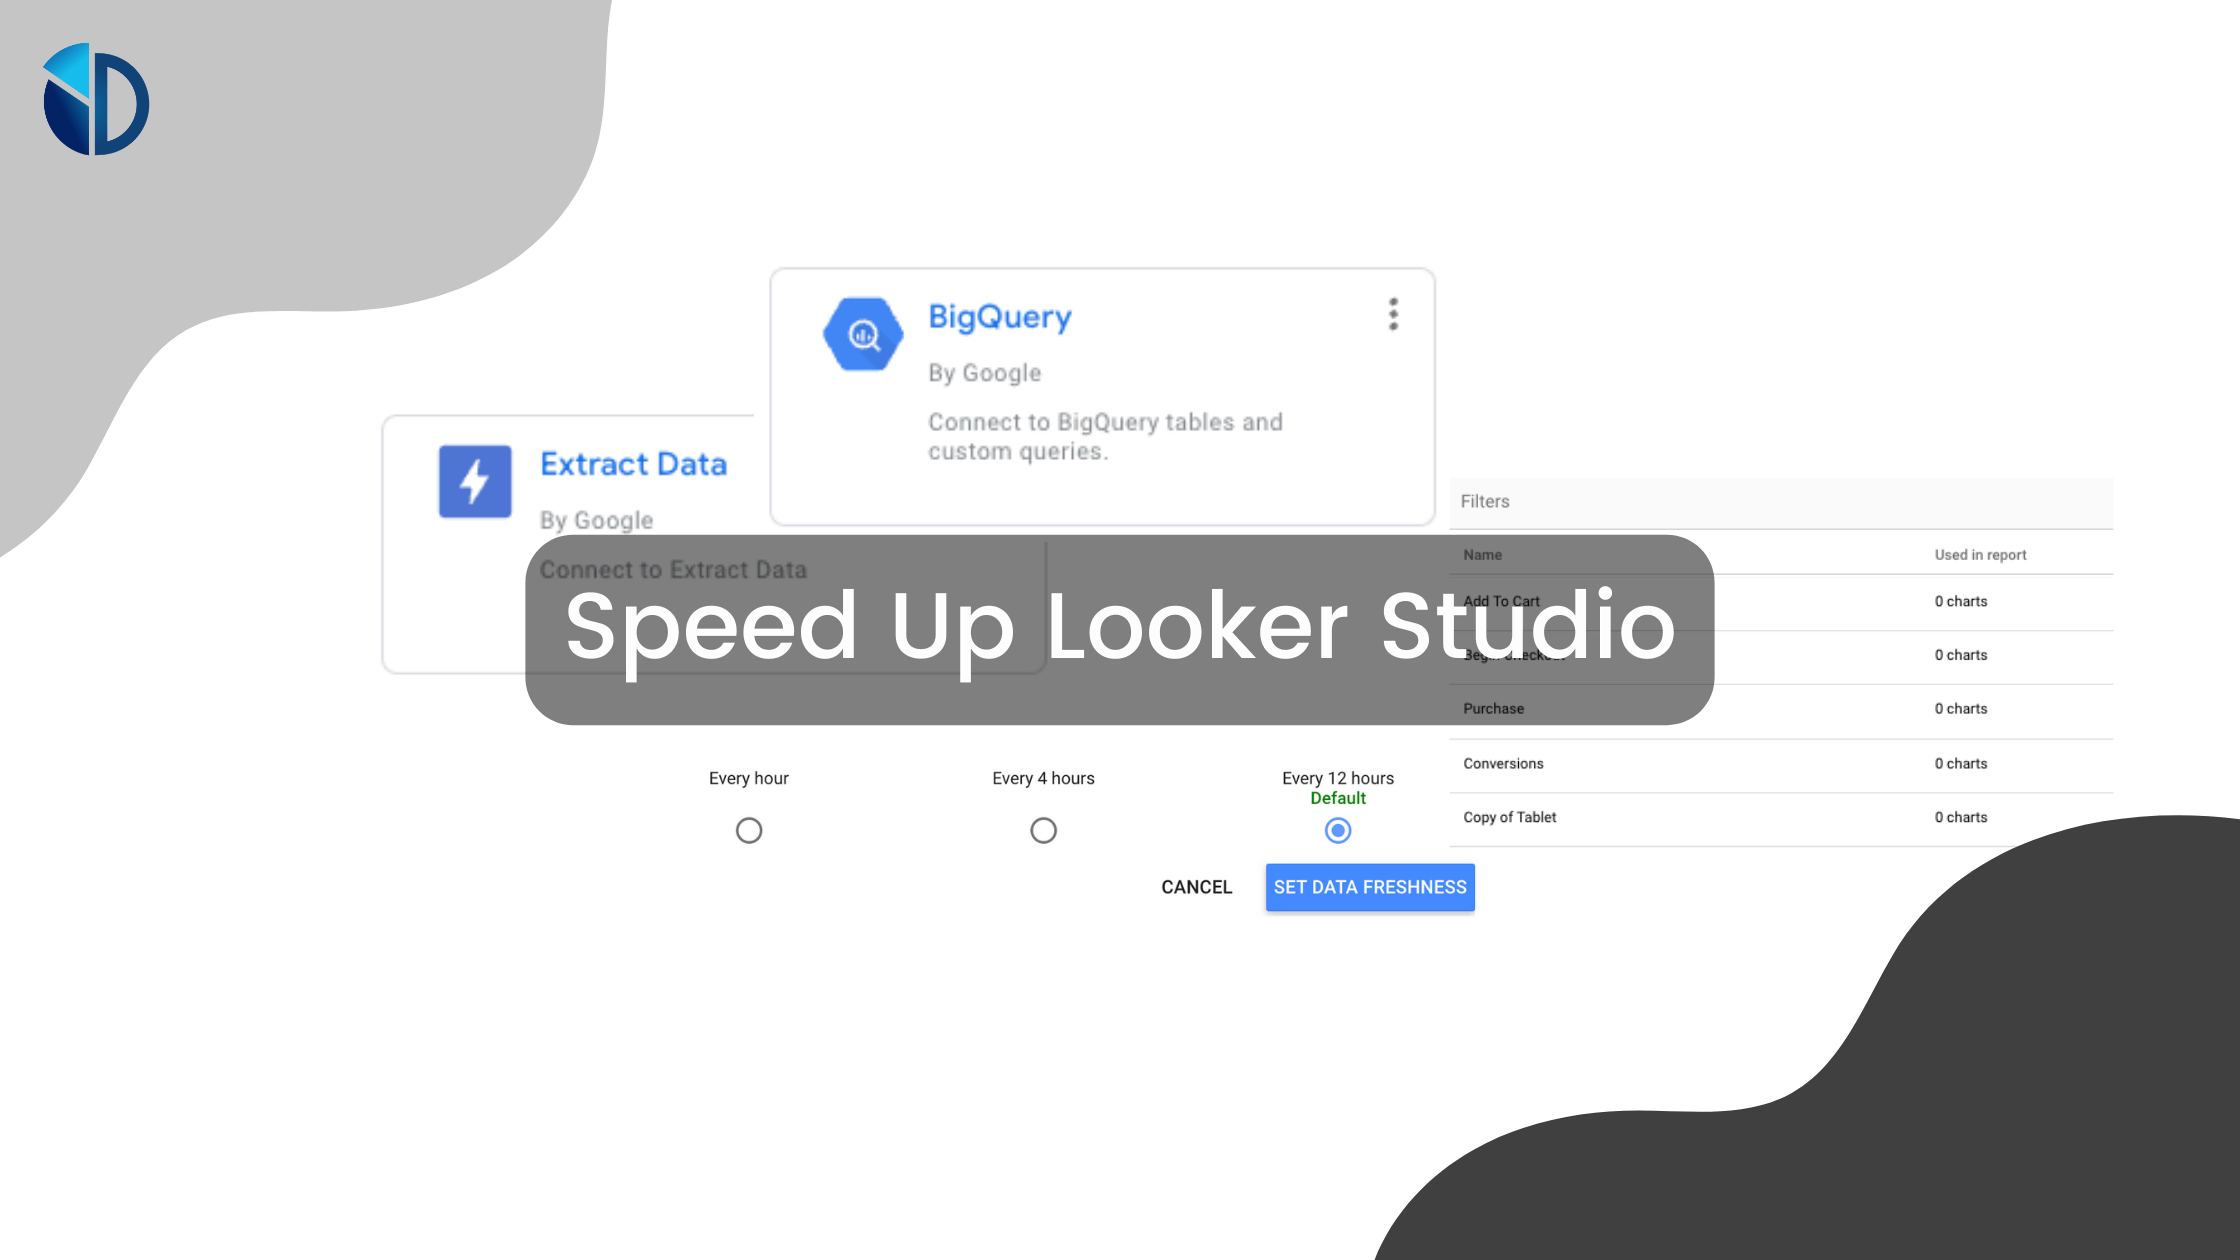
Speed Up Your Looker Studio Reports: 4 Proven Techniques
It’s the data and analytics age and by all indications, Google is leading the charge. Google Data Studio was released in
It’s the data and analytics age and by all indications, Google is leading the charge. Google Data Studio was released in
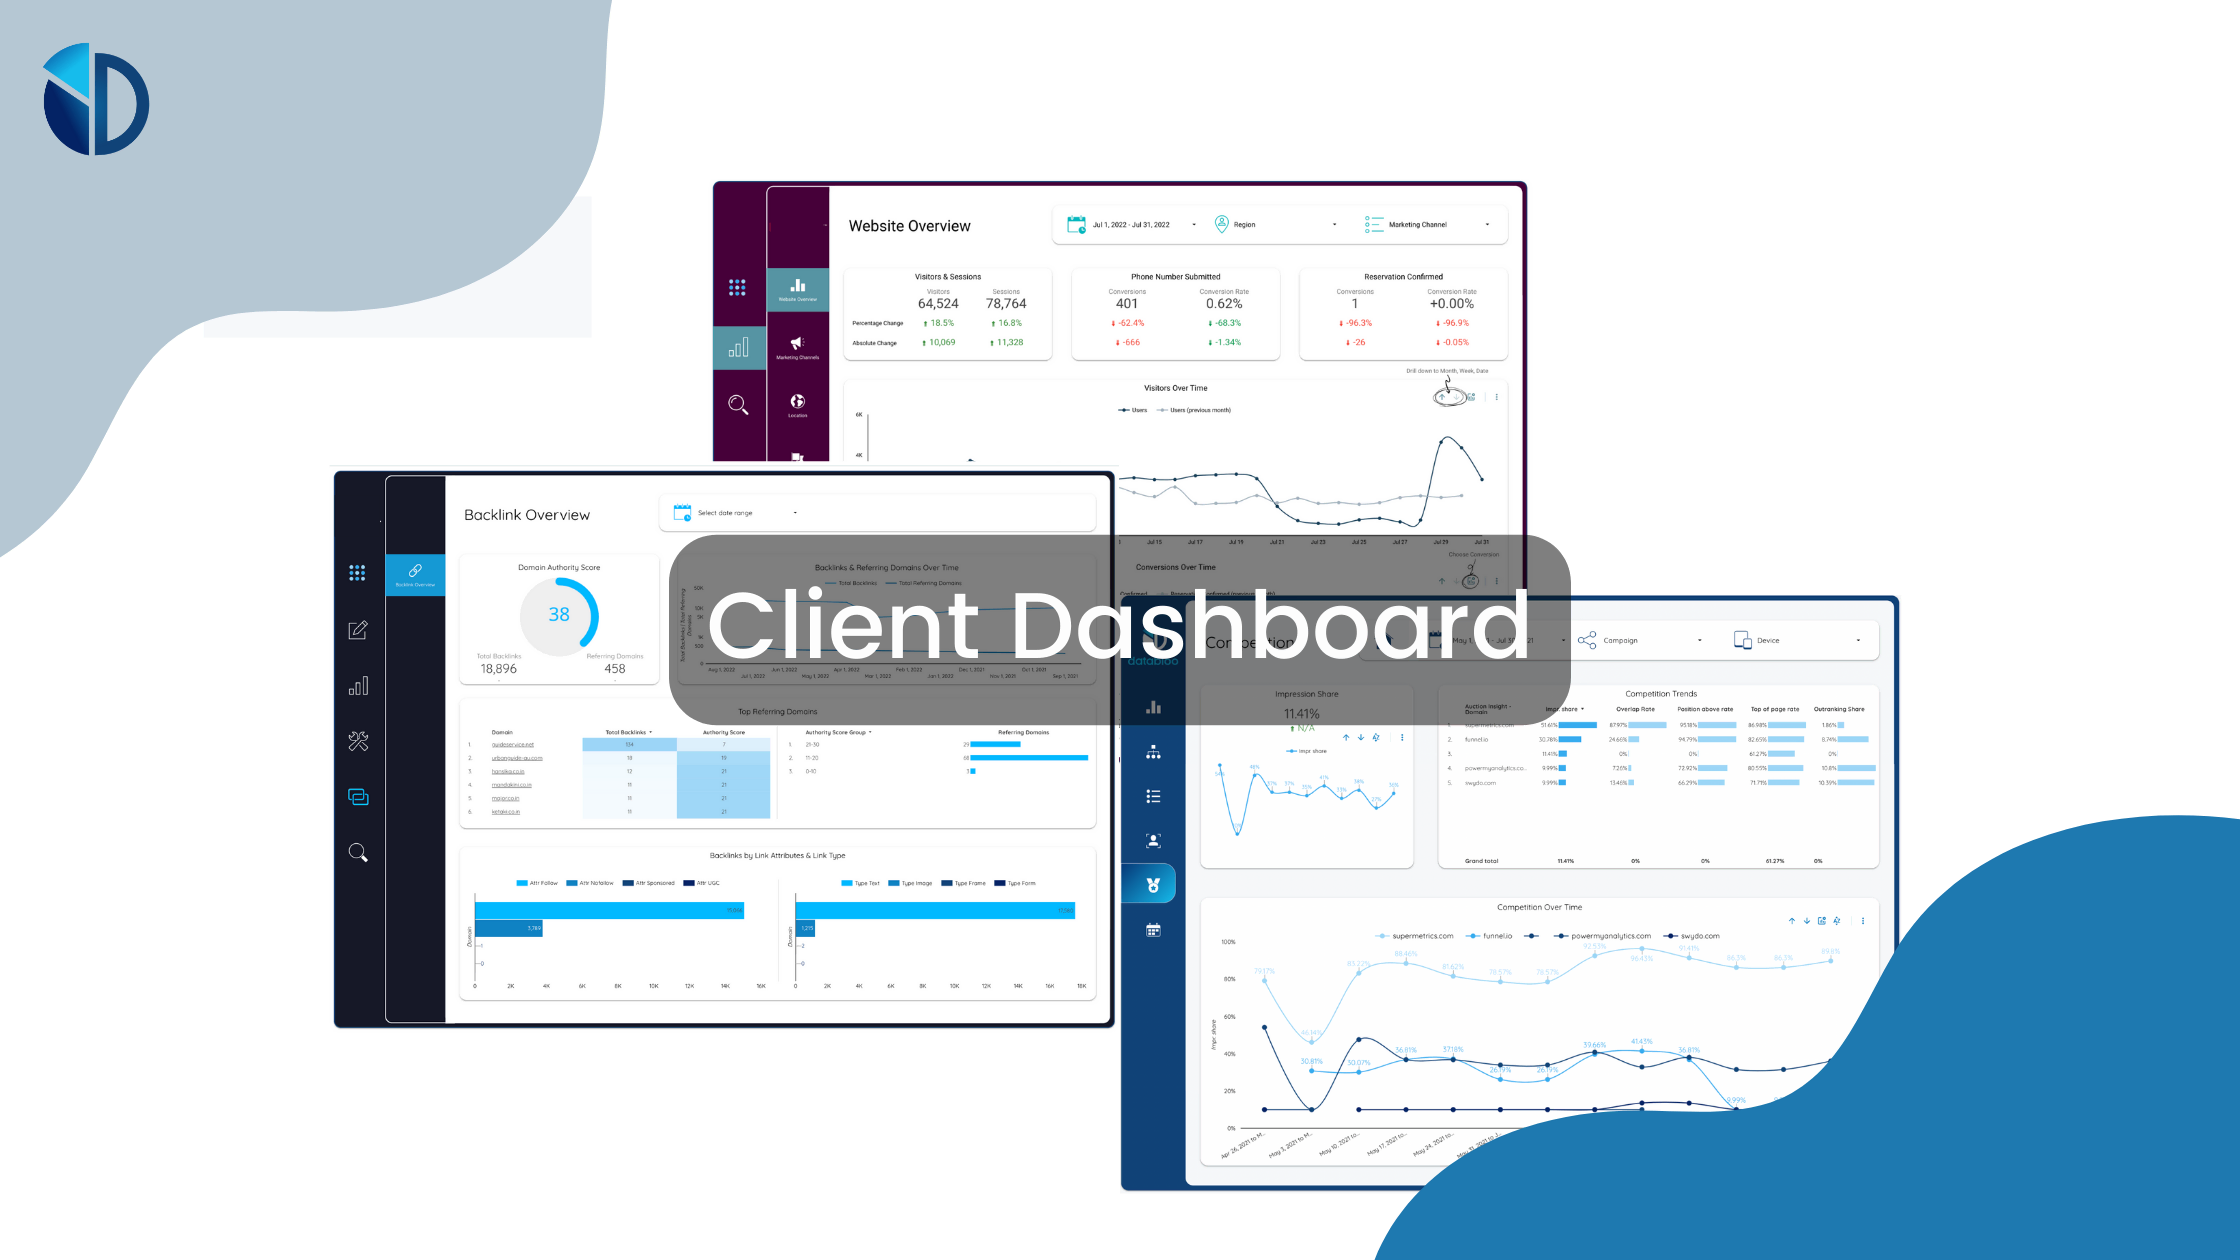
Currently, around 68% of businesses utilize some sort of digital marketing, and this number is growing year after year. A solid client
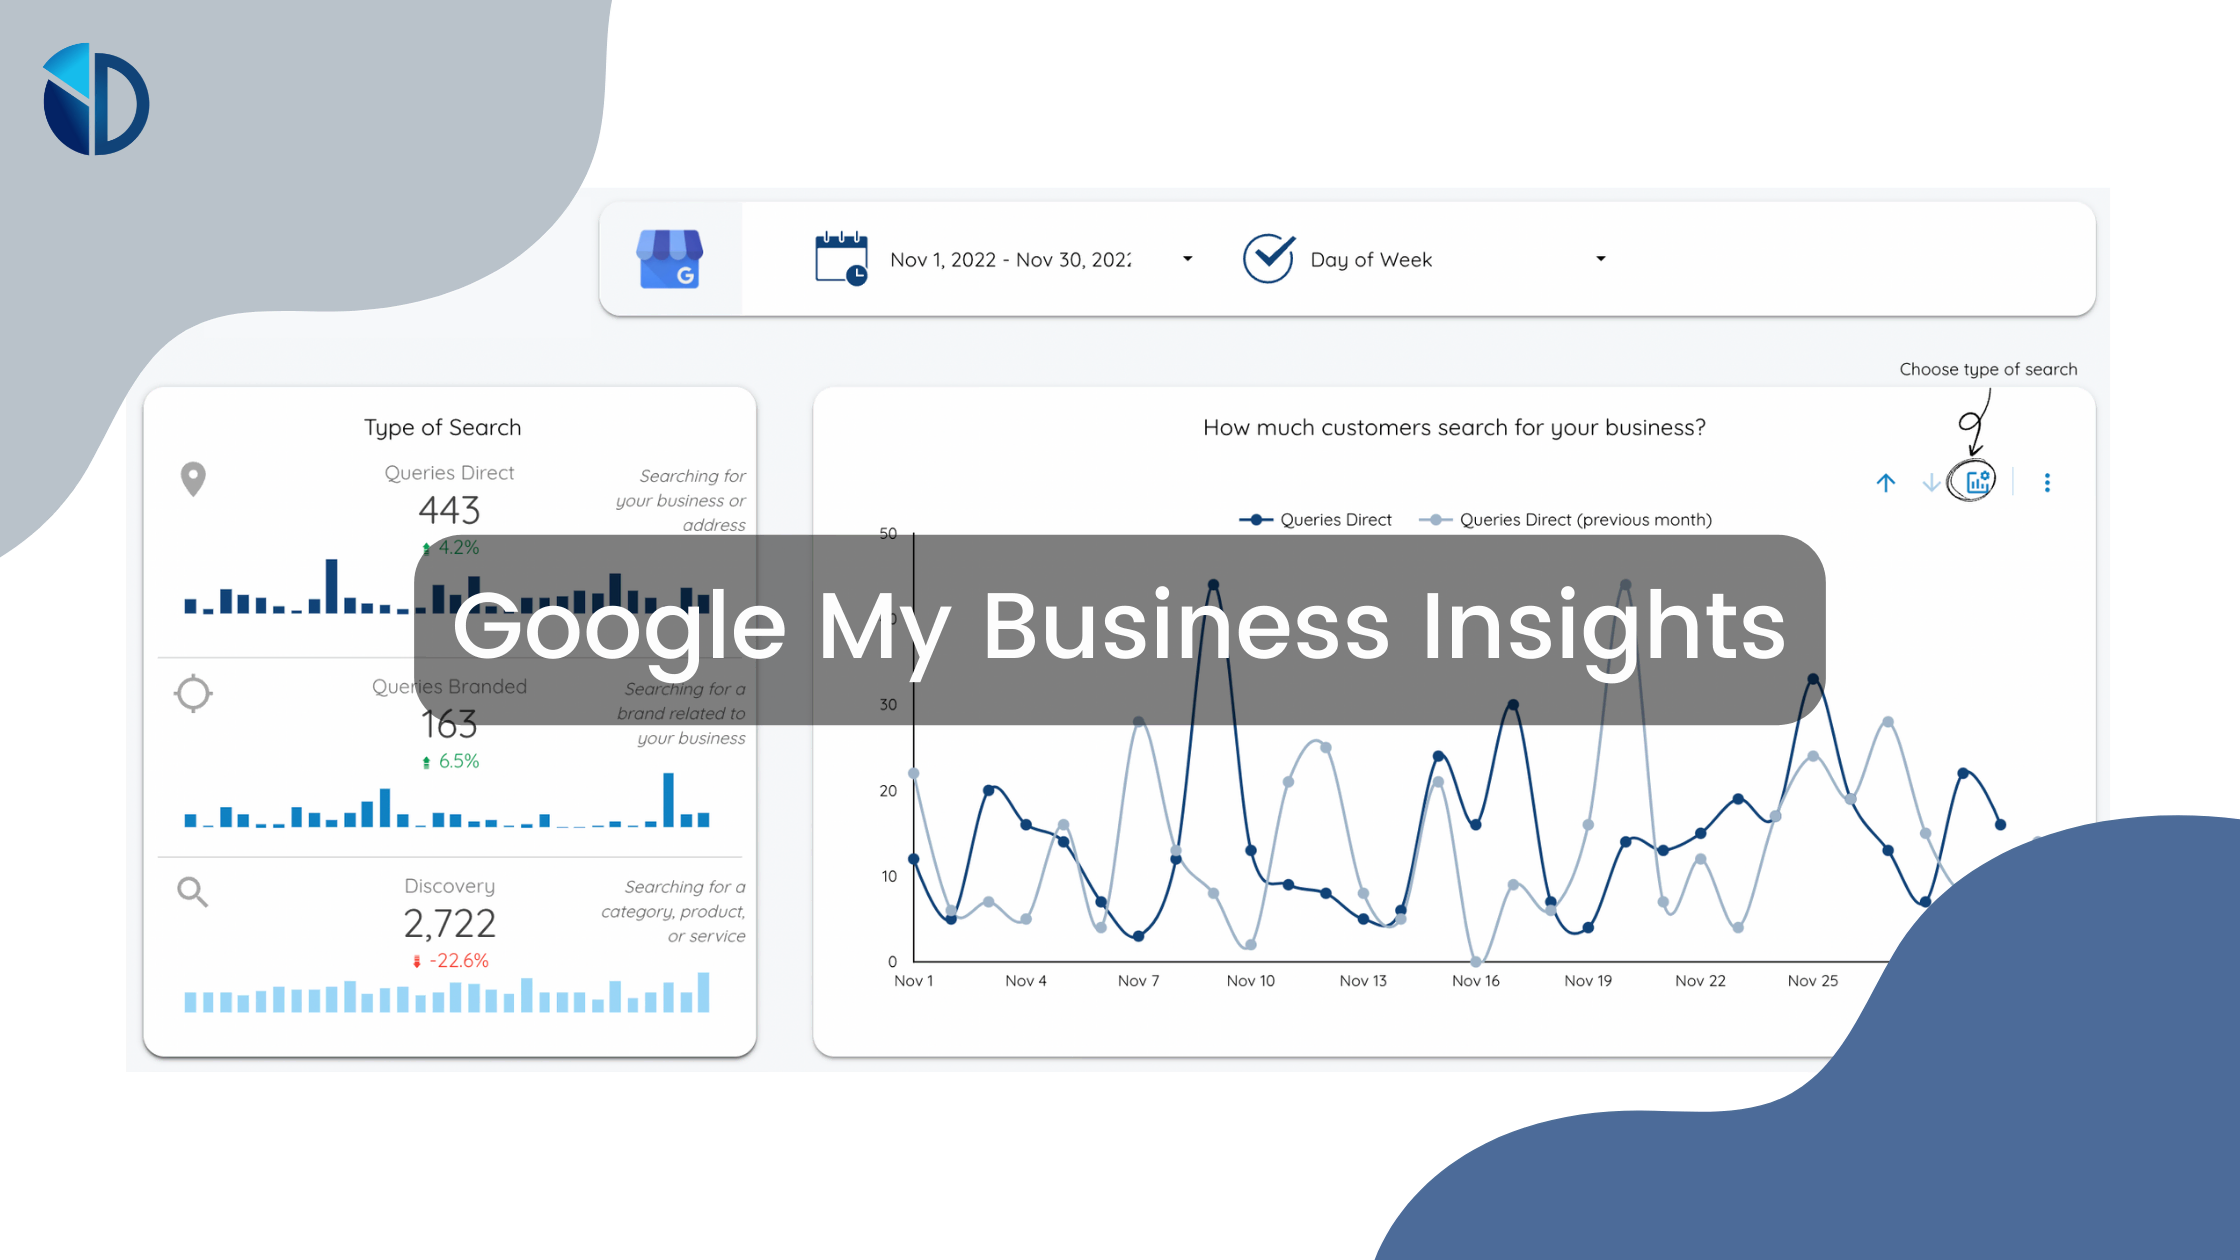
Did you know that a typical business gets about 59 actions from its GMB listing? Google My Business allows local businesses to
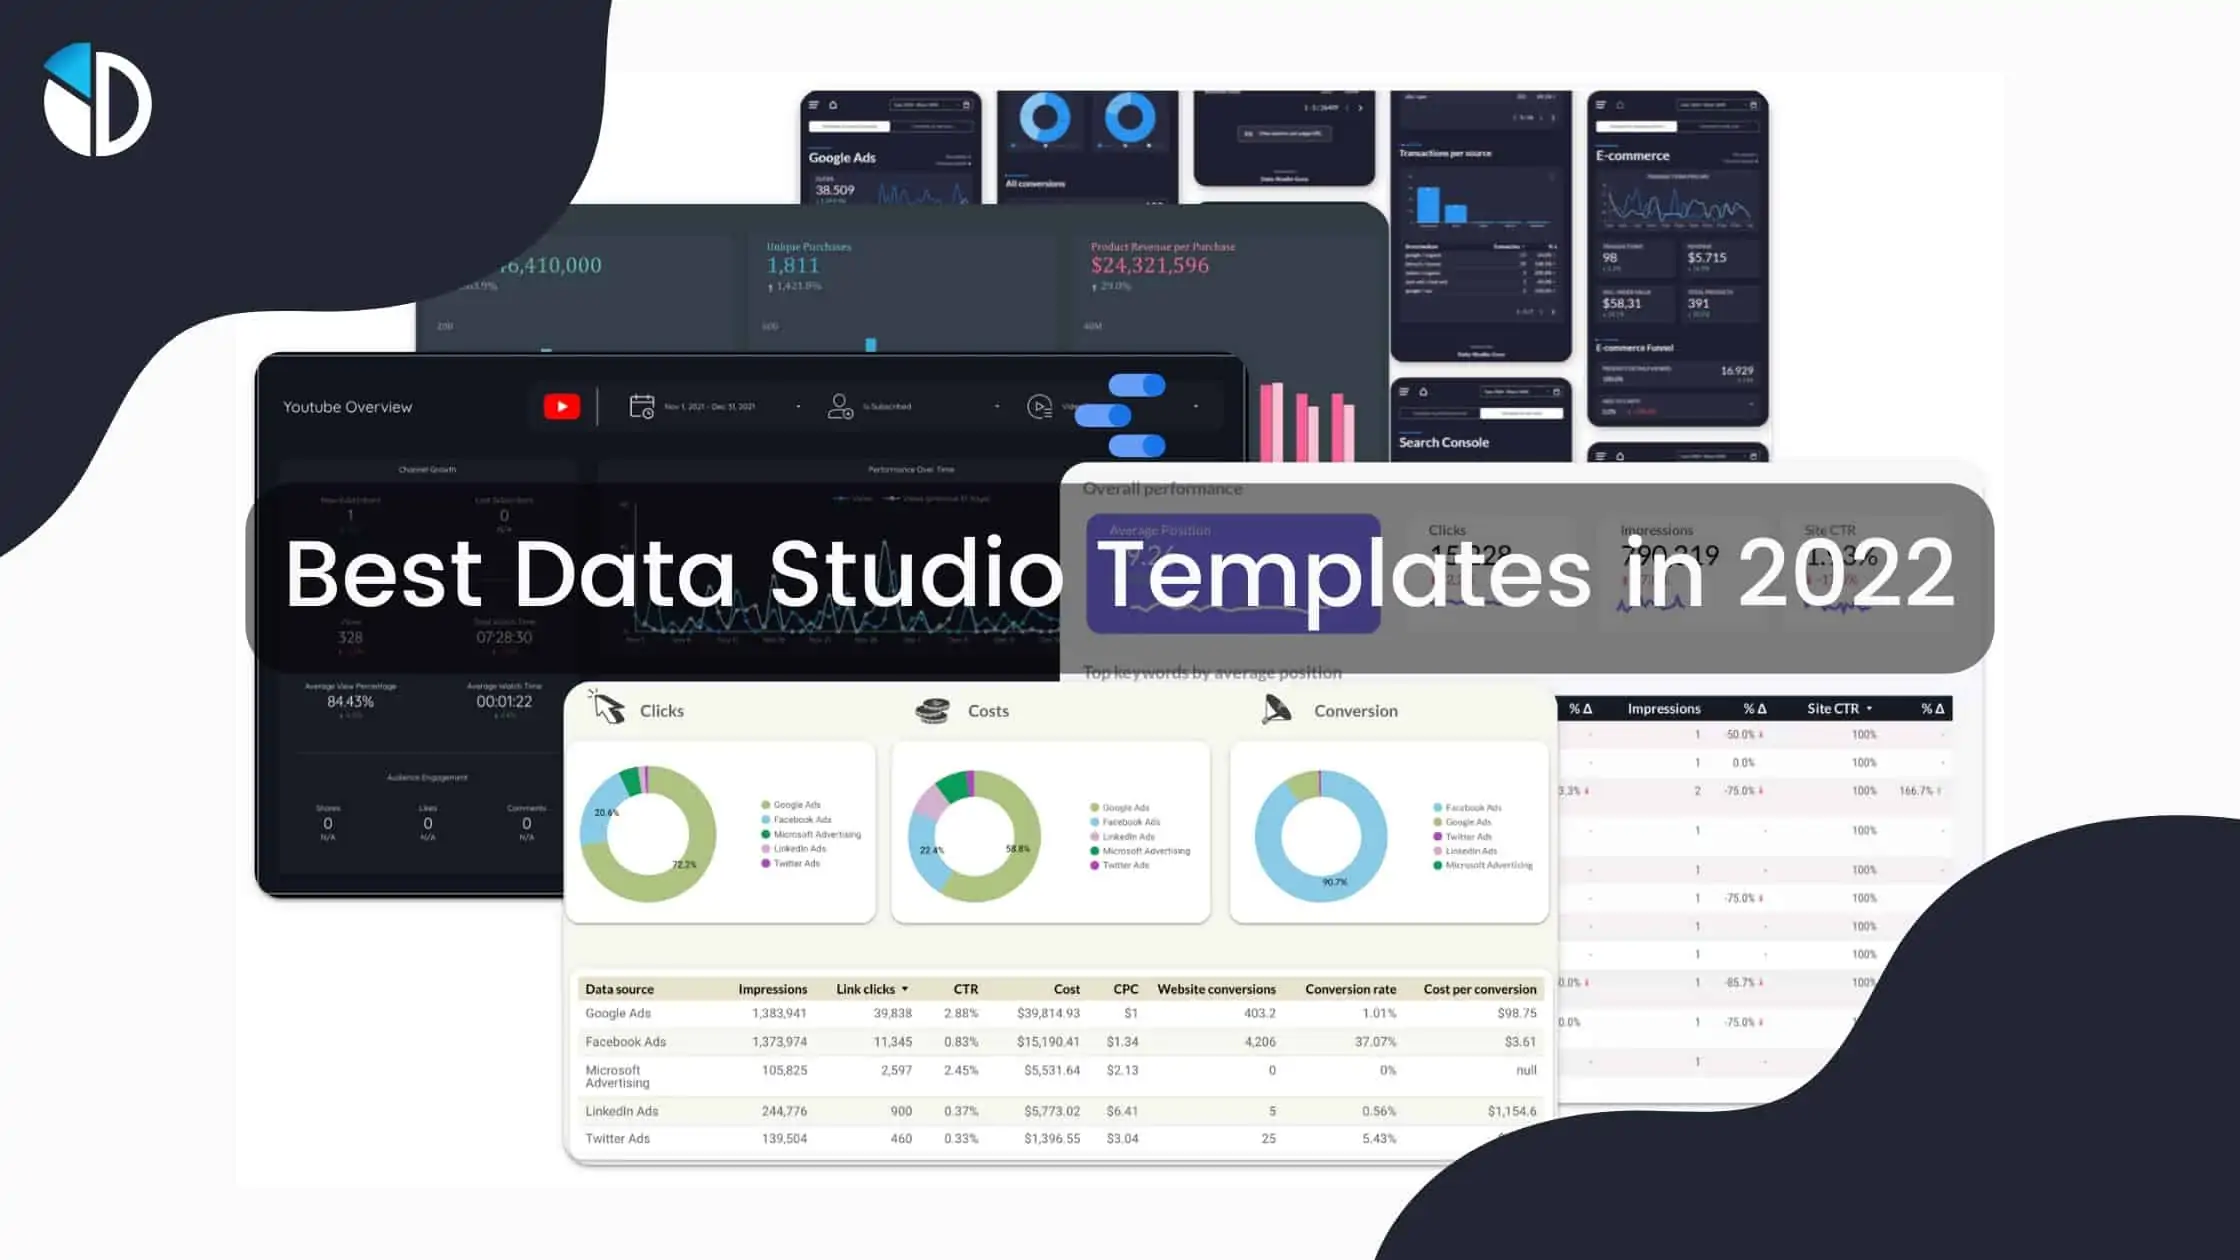
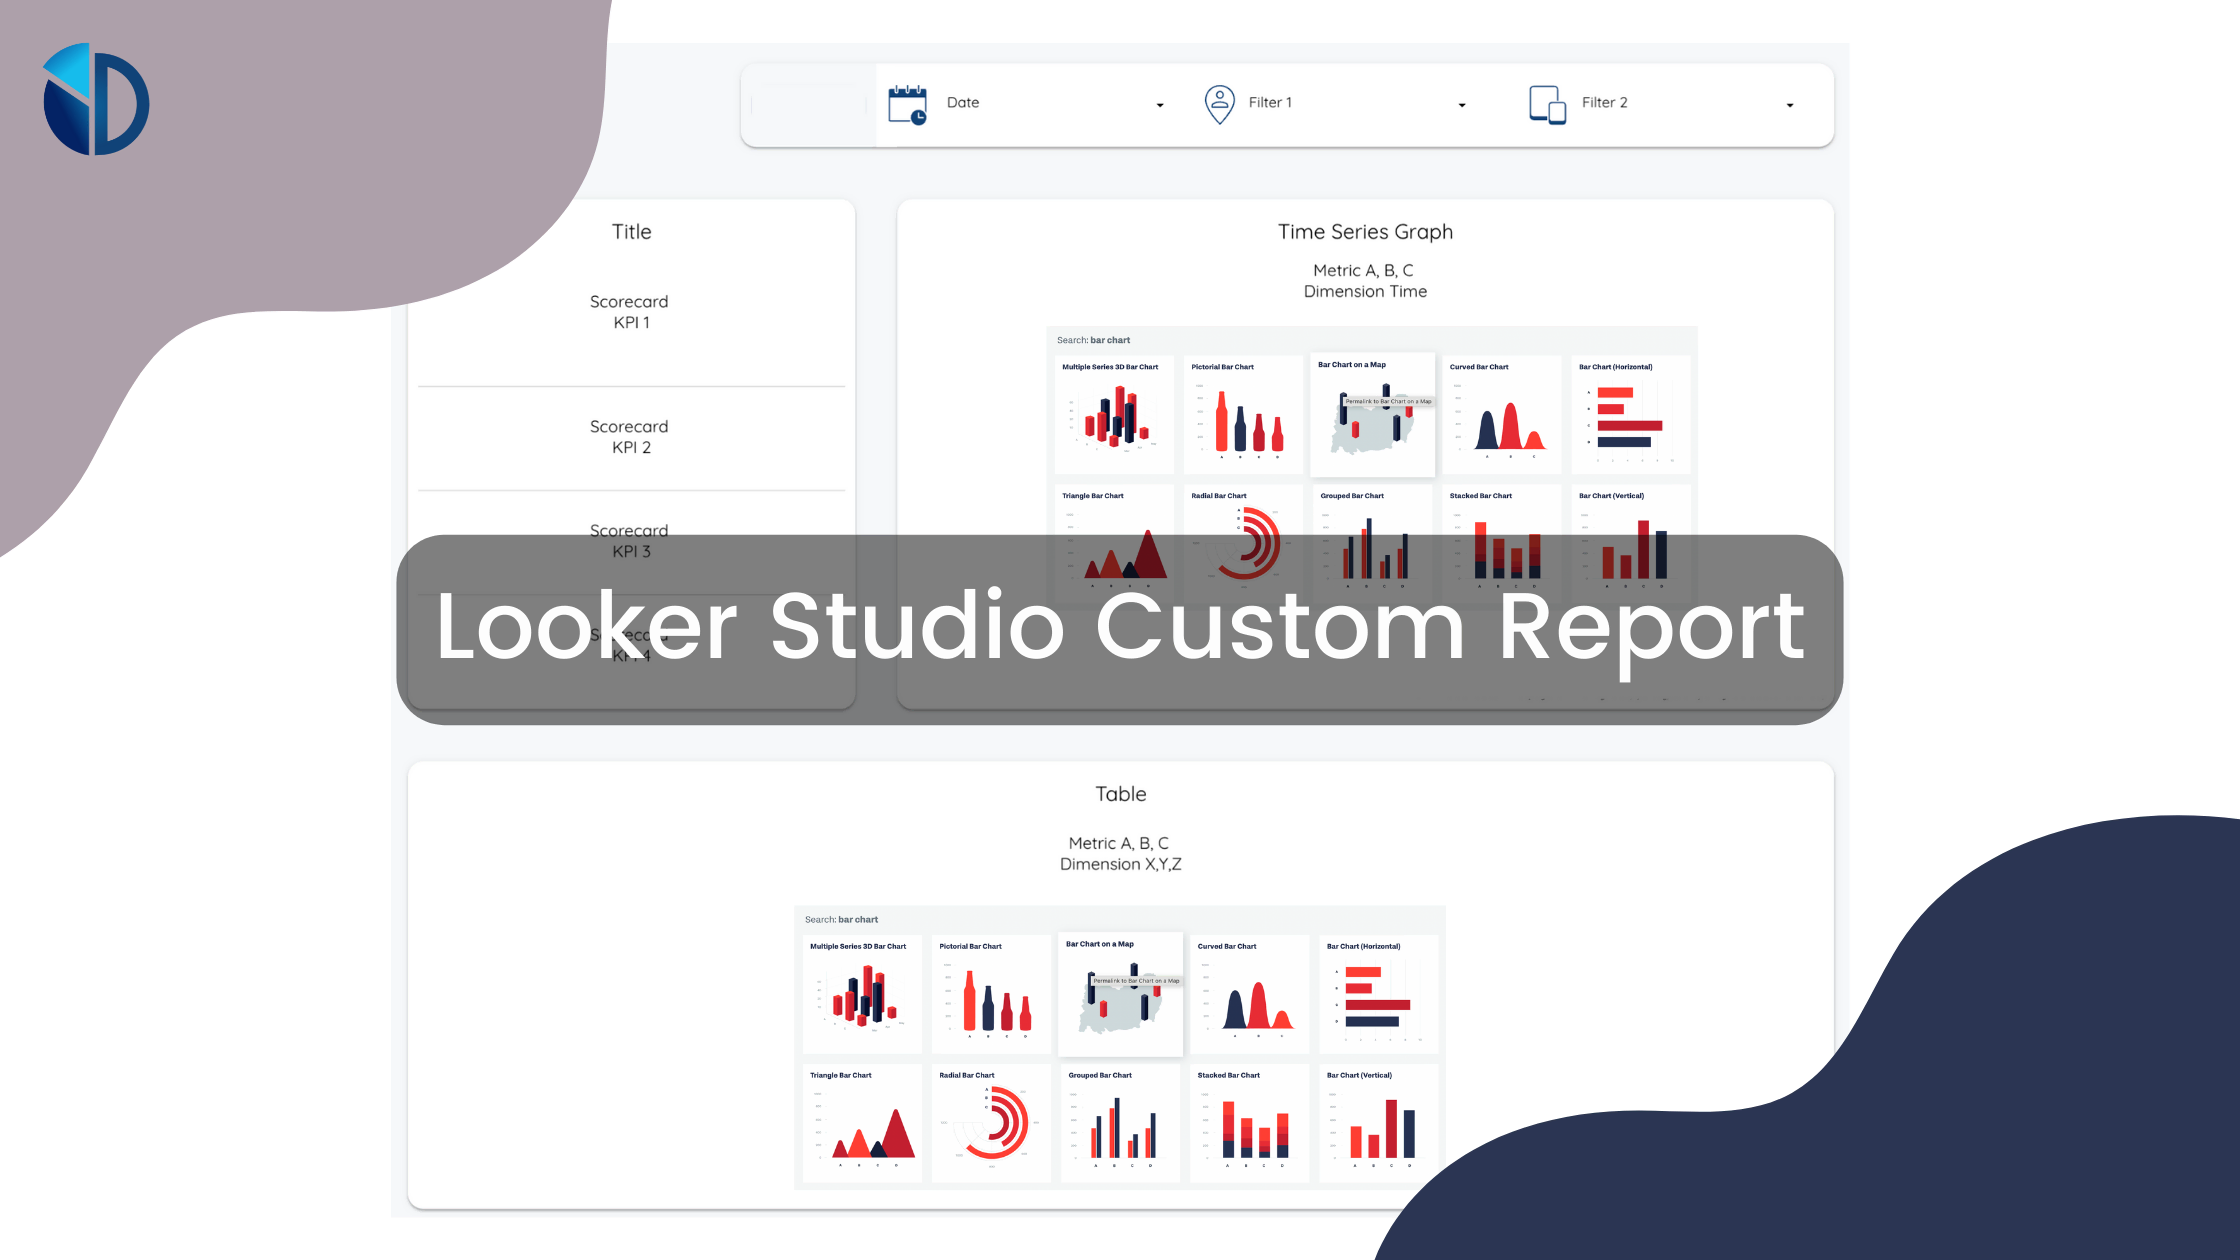
Building manually from scratch custom reports can be really frustrating. With Google Data Studio Templates, you will benefit from automated
At the 2022 Google Cloud Next virtual conference, Google announced something big. Just three years after acquiring the data and analytics
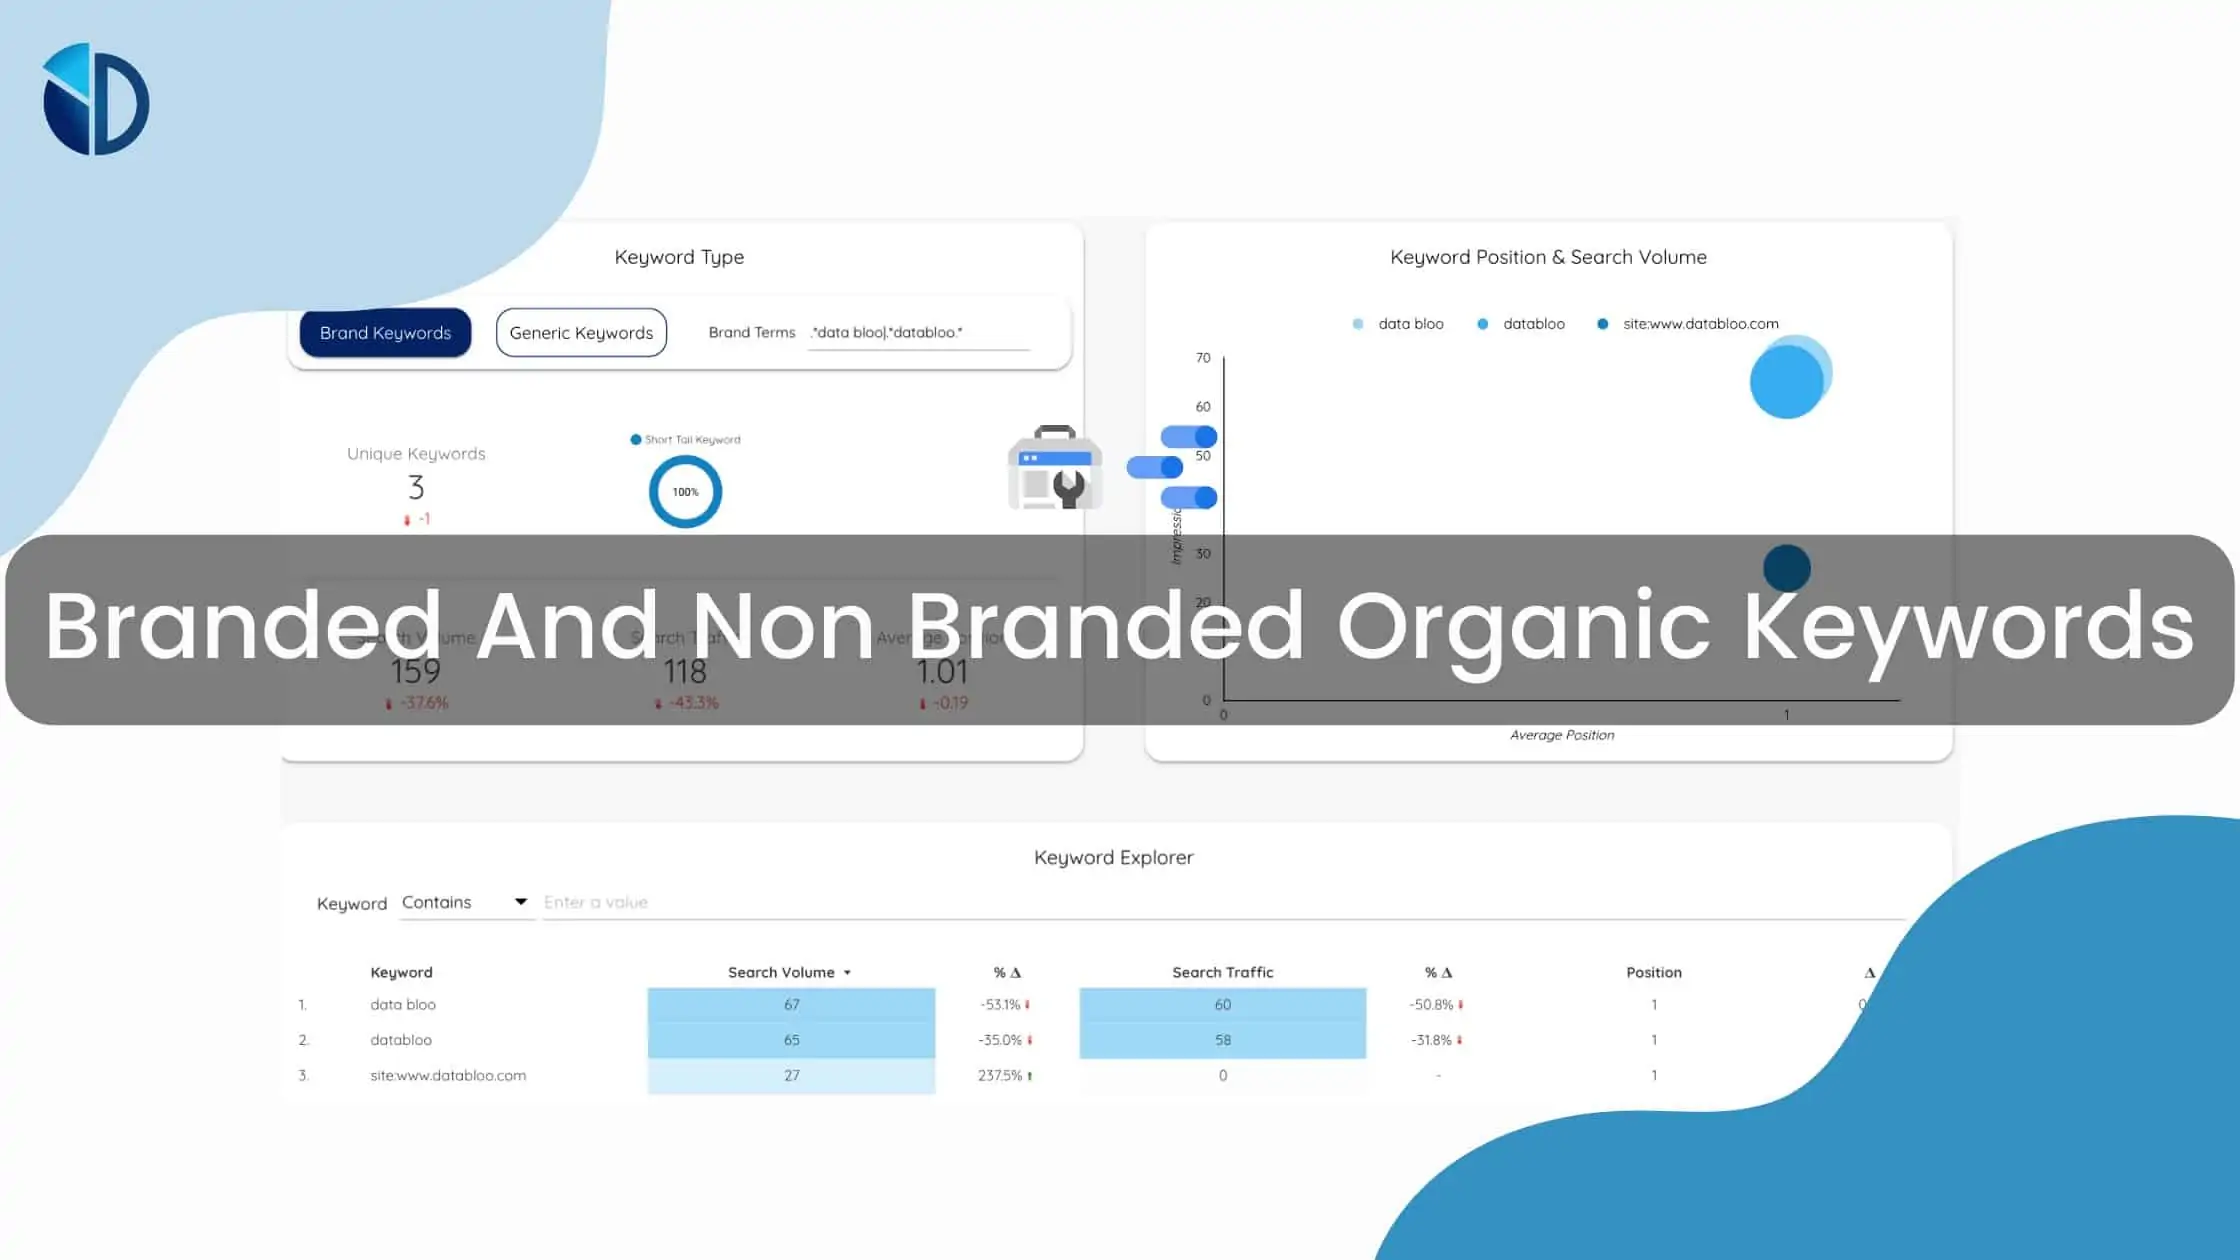
It’s important to monitor the volumes of your branded and non branded keywords and identify if the majority of your
Did you know that over 55% of all websites use Google Analytics for site content optimization? Google Analytics is a powerful tool
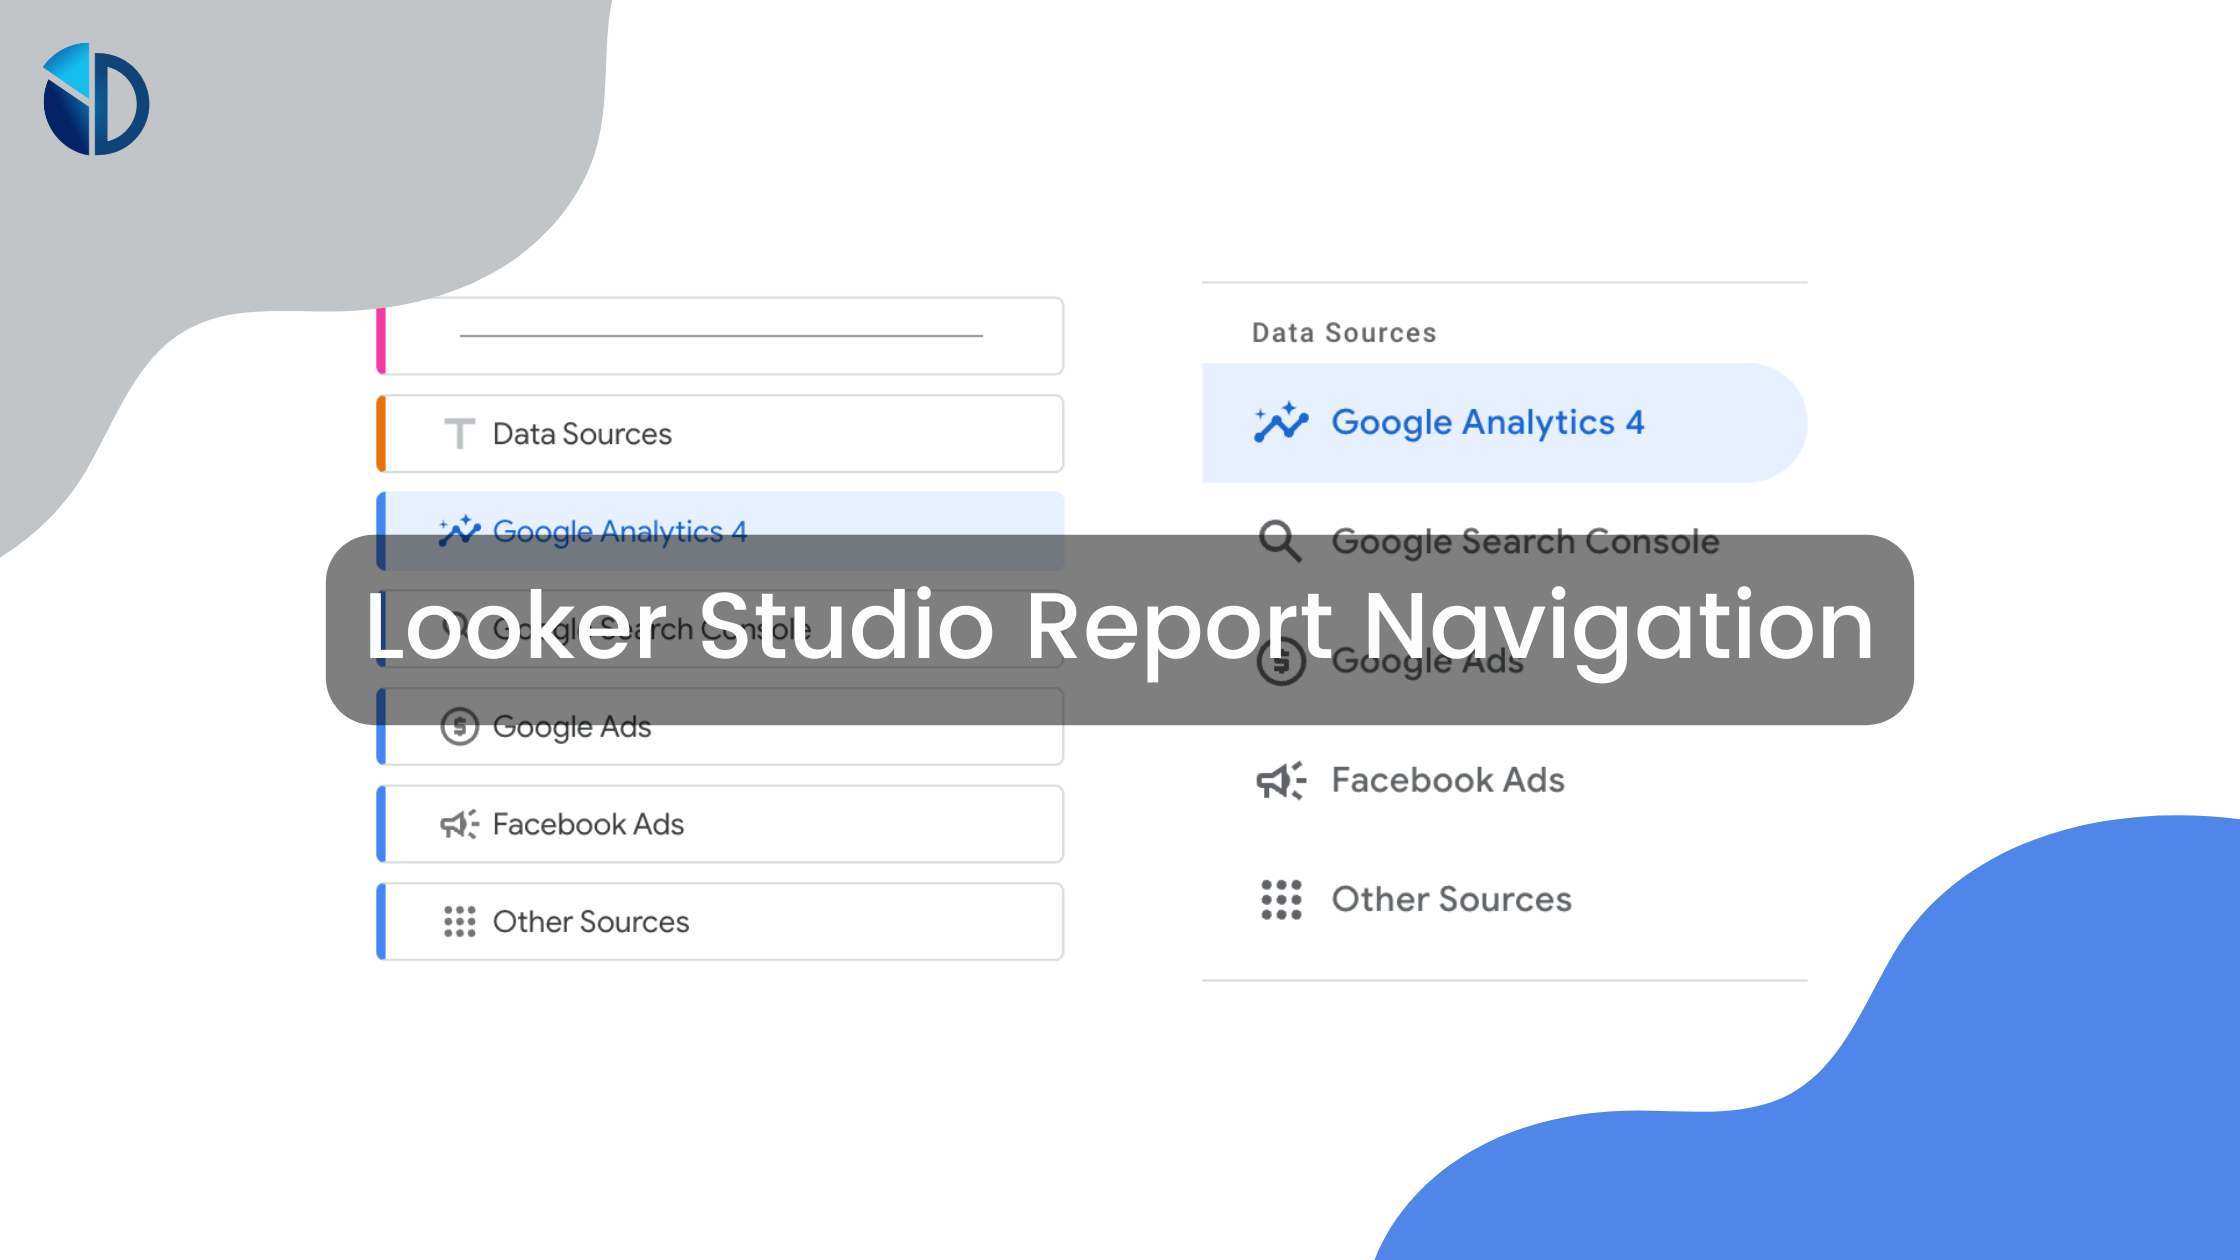
A picture might be worth a thousand words, but a Looker Studio (previously known as Data Studio) report can be
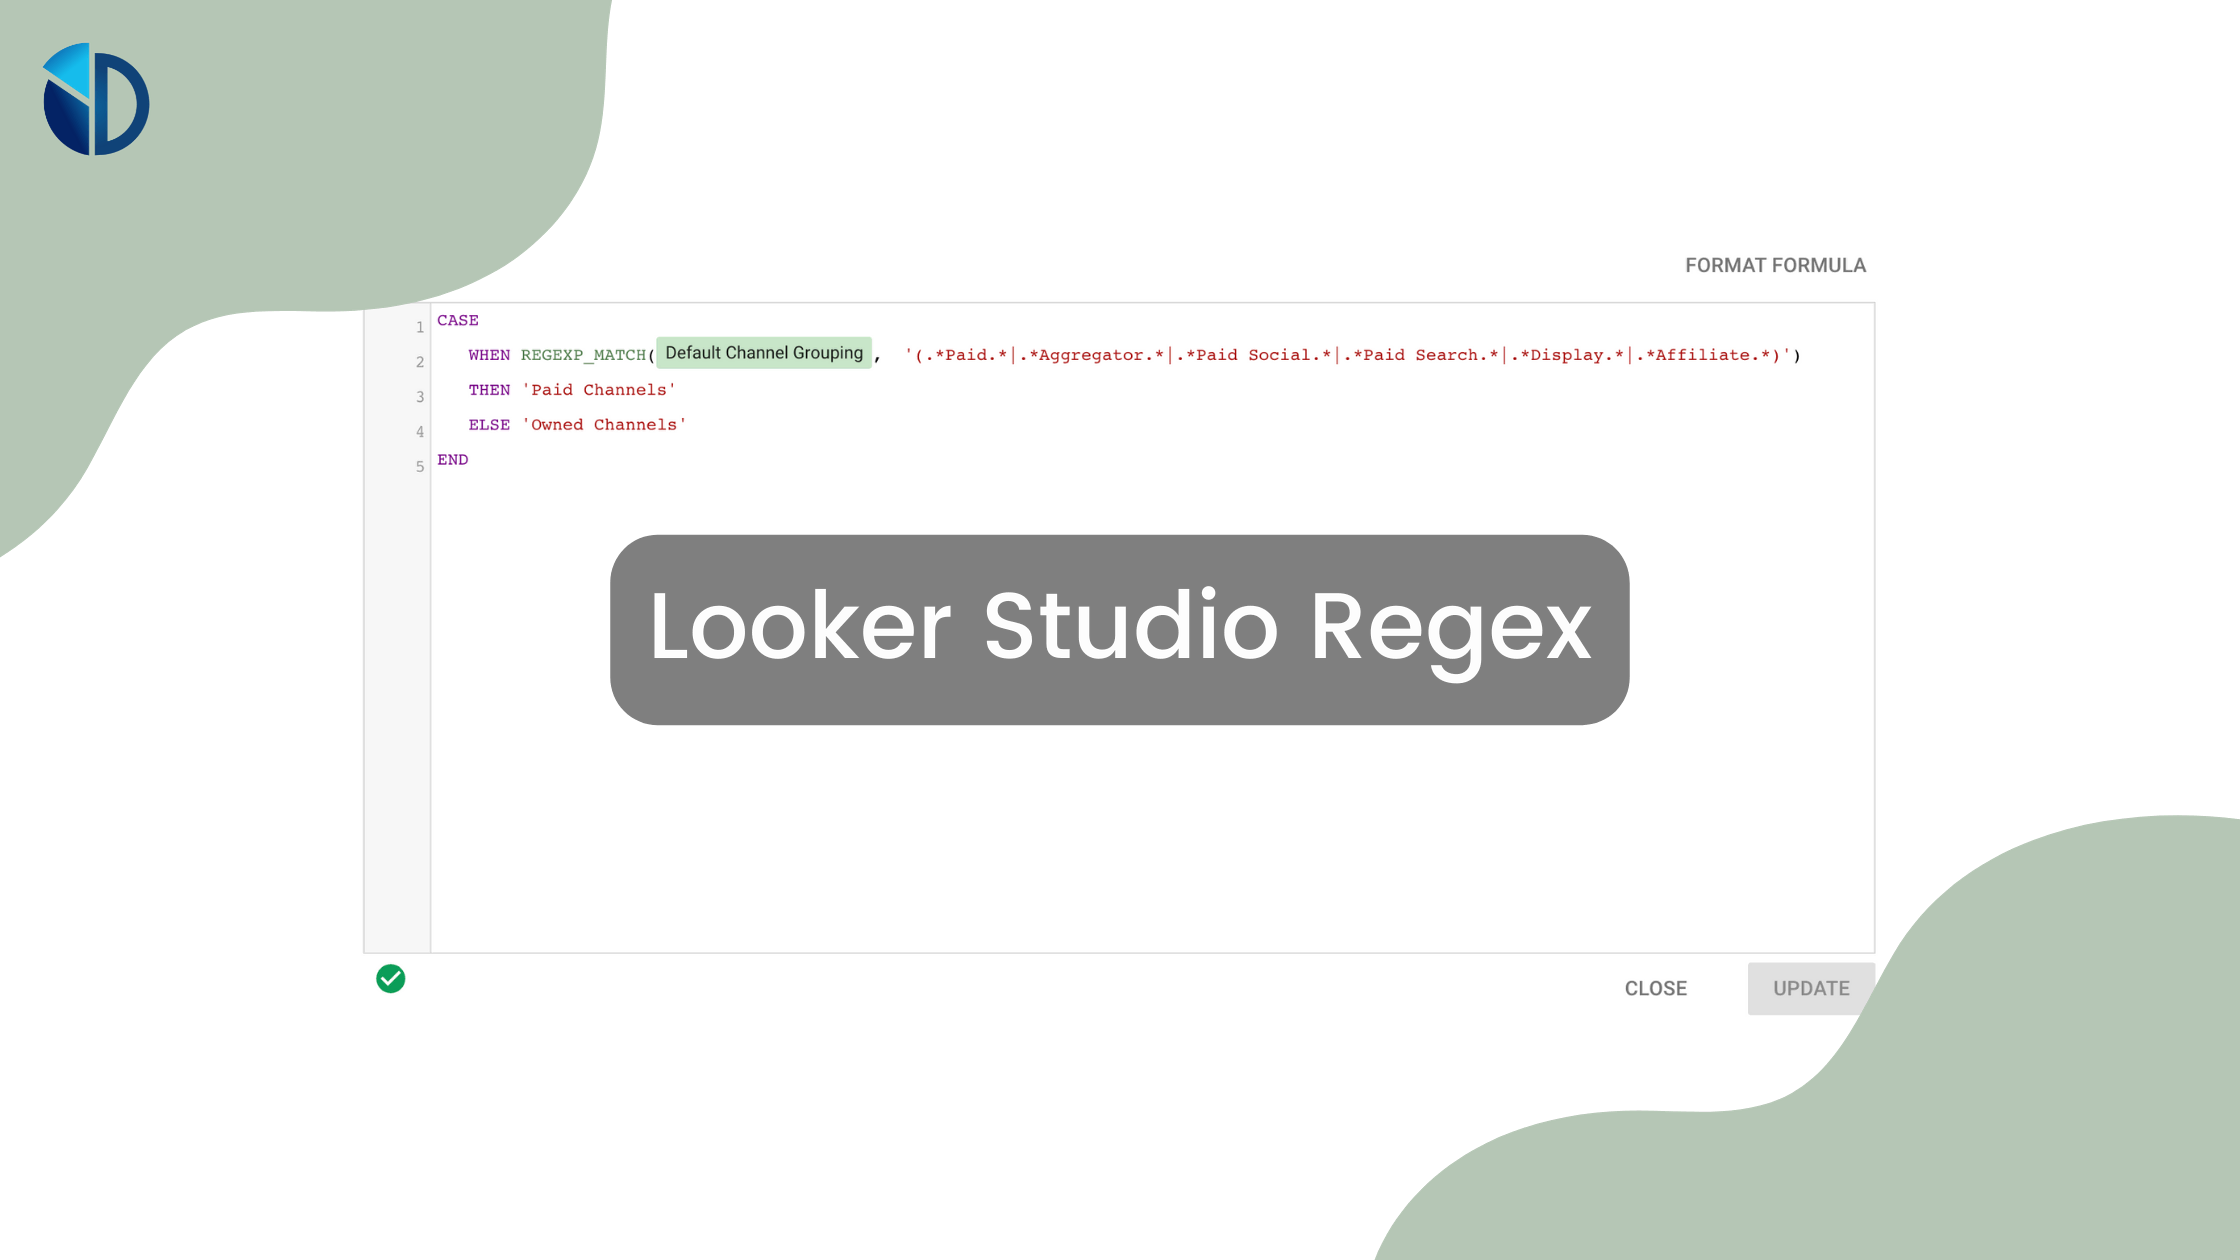
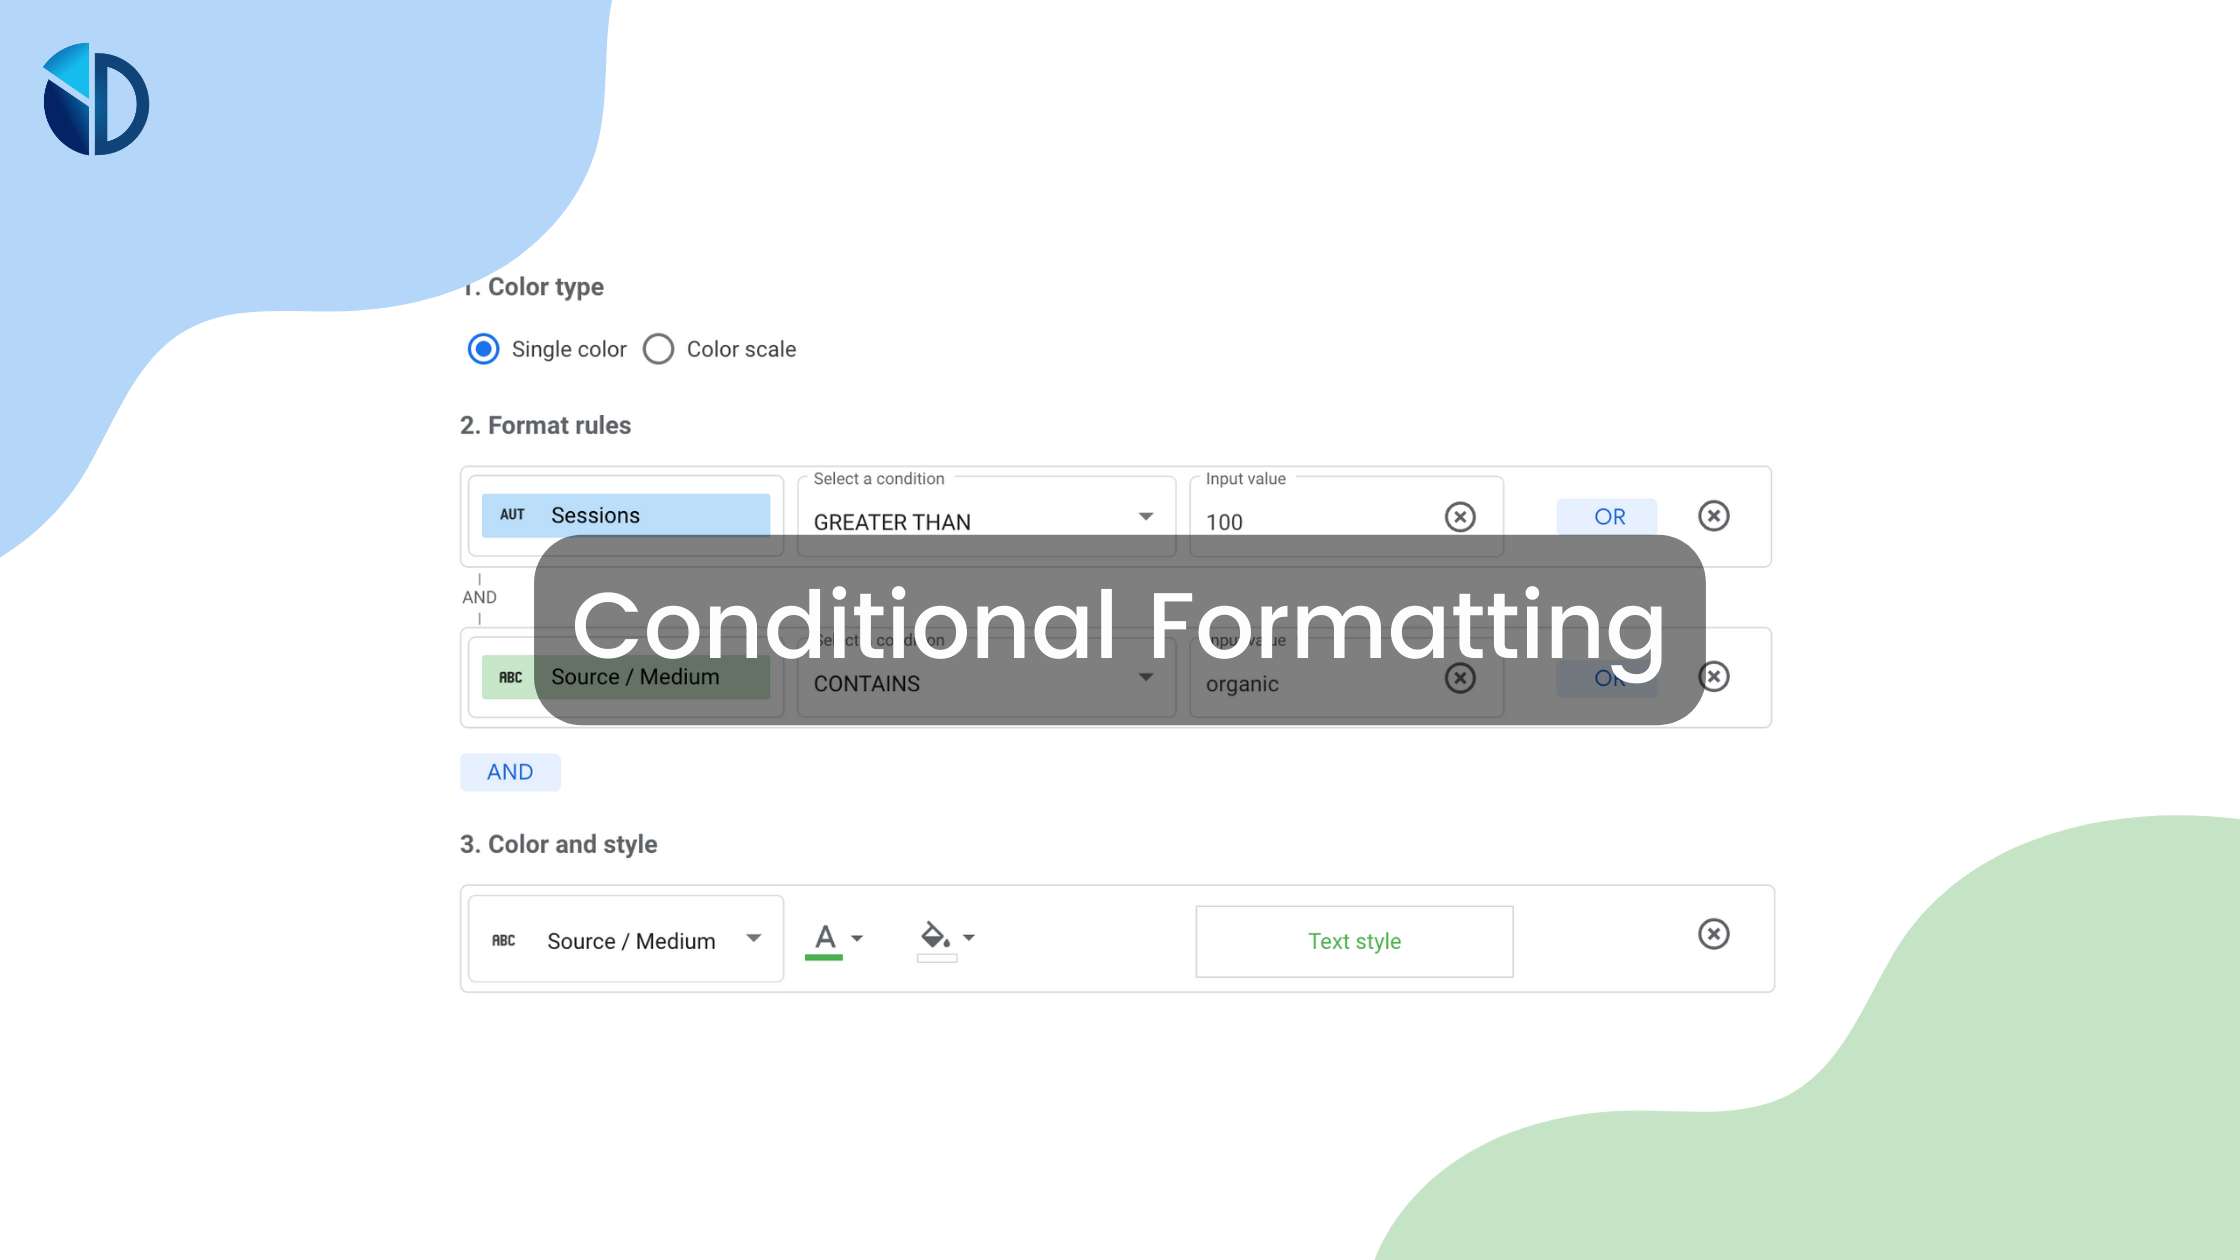
Looker Studio (formerly known as Data Studio) offers more than just drag-and-drop options for designing effective data visualizations and generating
Data visualizations use elements of design to do what our brain does naturally: create order. Instinctively, we seek to find
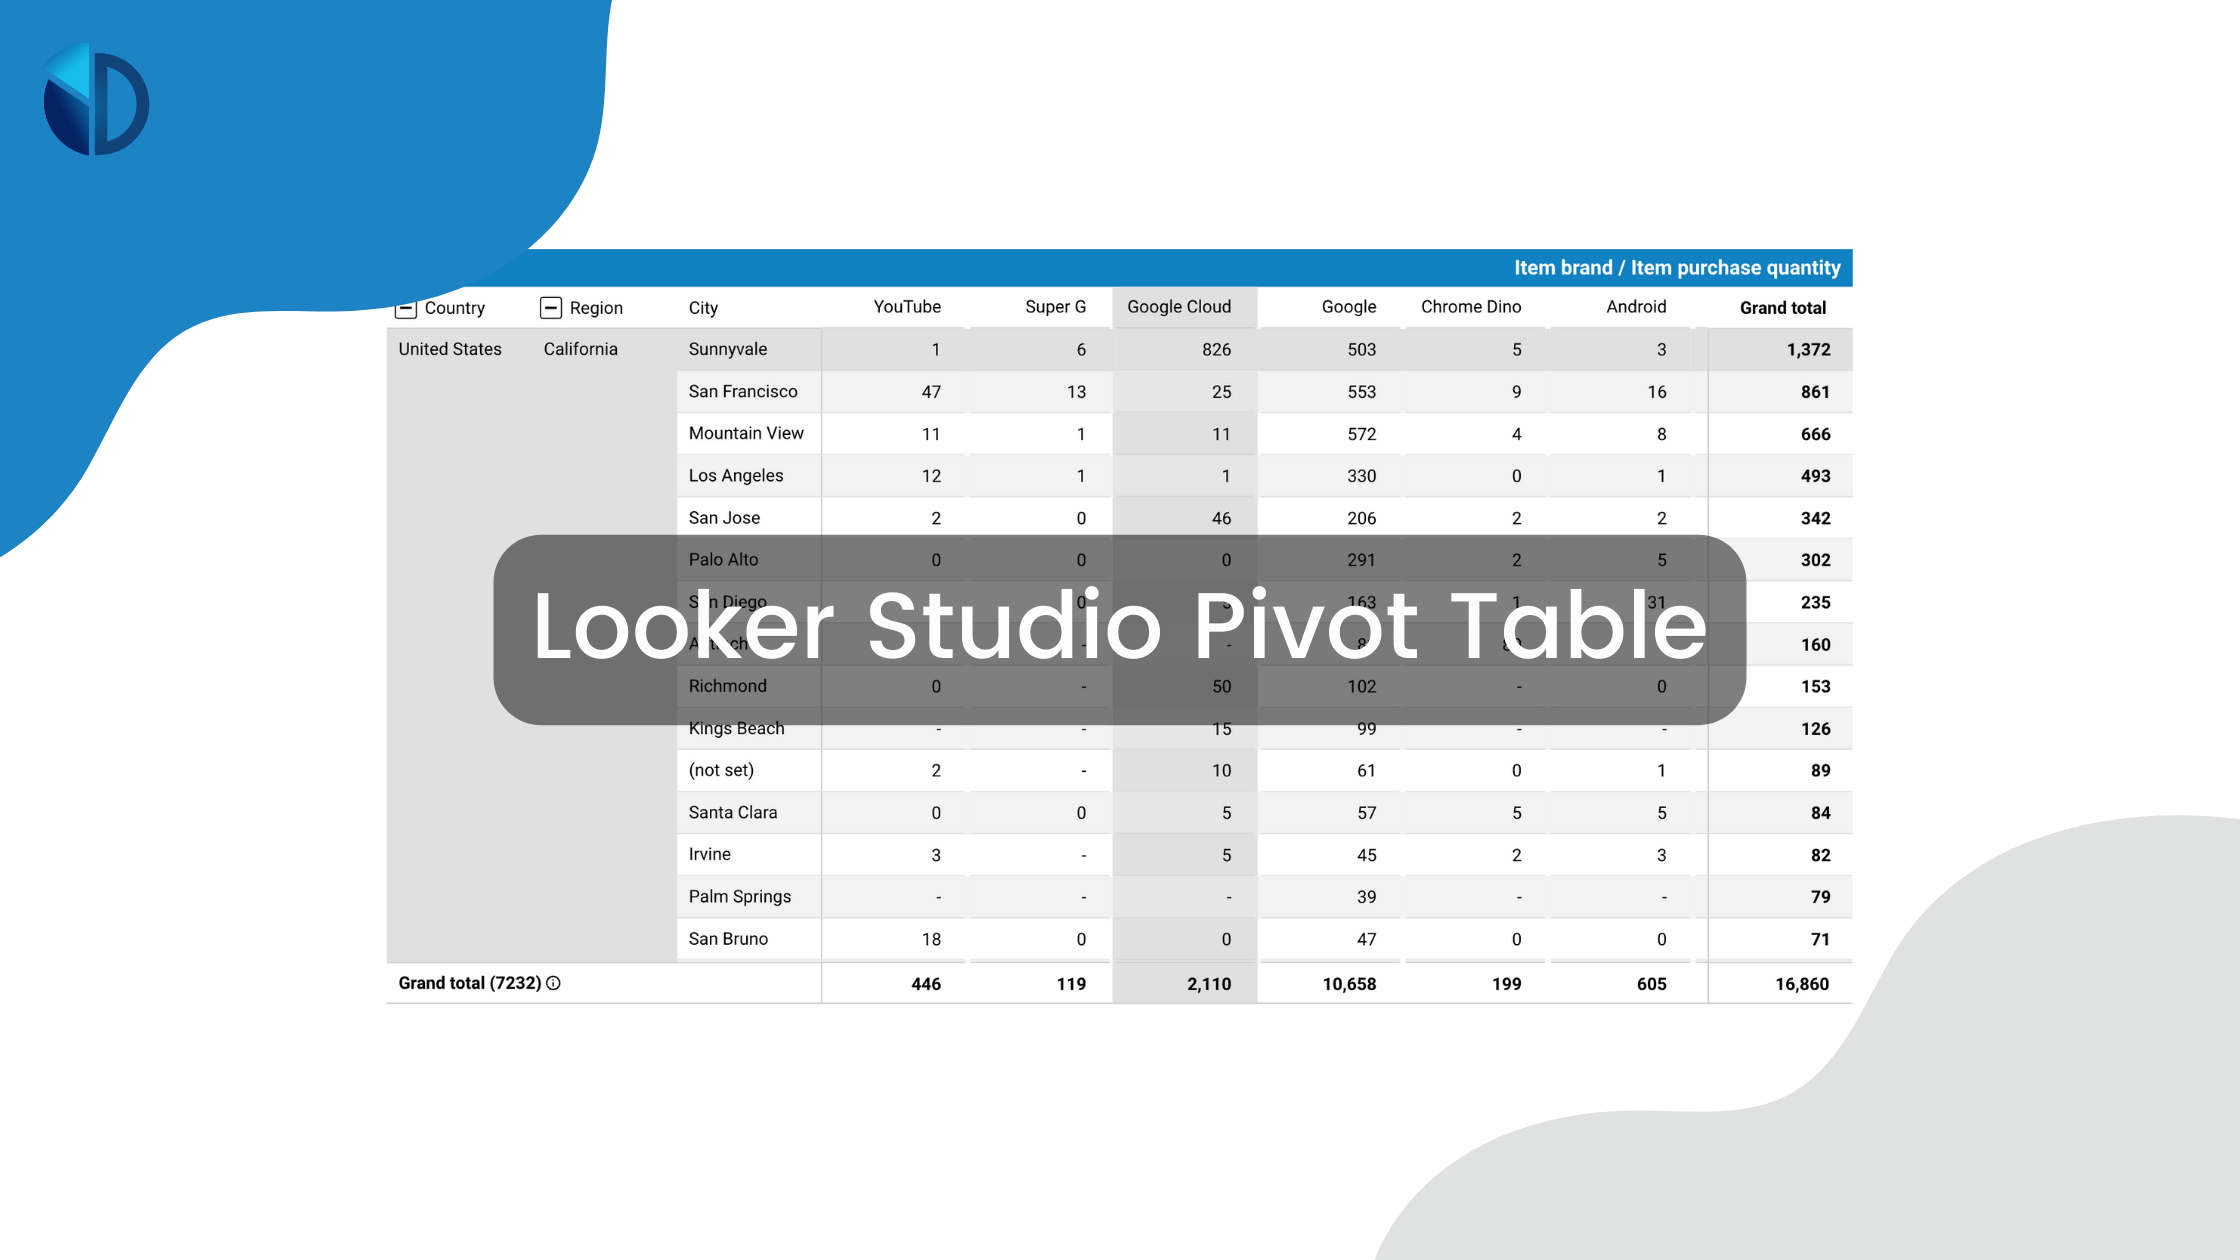
Spreadsheets seem very one-dimensional if you don’t know how to use them. They offer a valuable tool that functions as
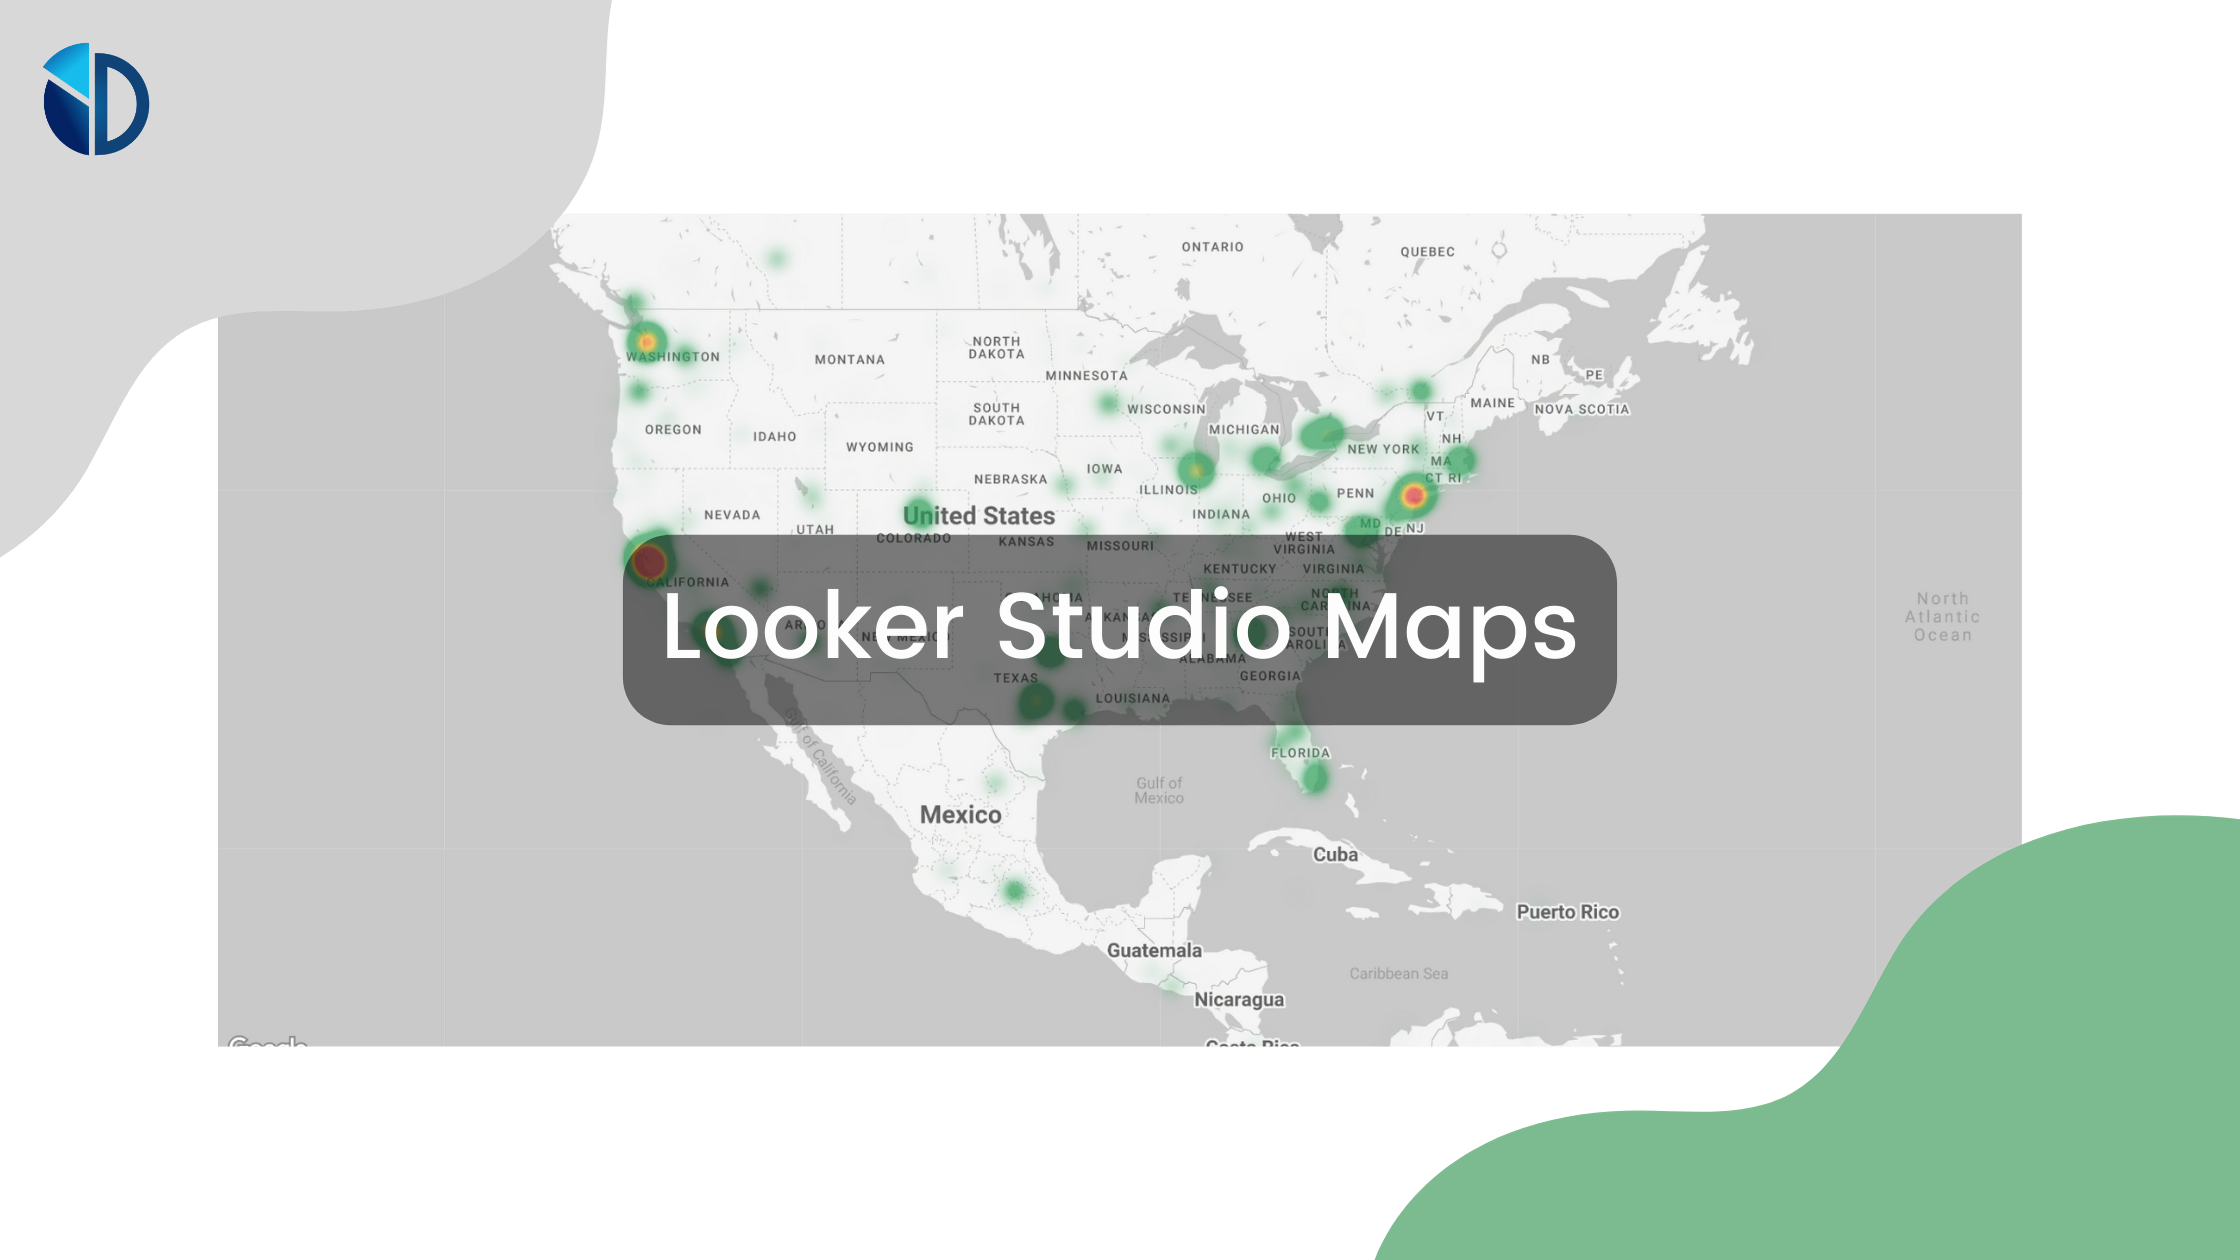
When you read the news or study most educational content, you have likely encountered a wide variety of map charts.
Do you design presentations for your business or team projects? If so, you should check out Google Looker Studio (previously
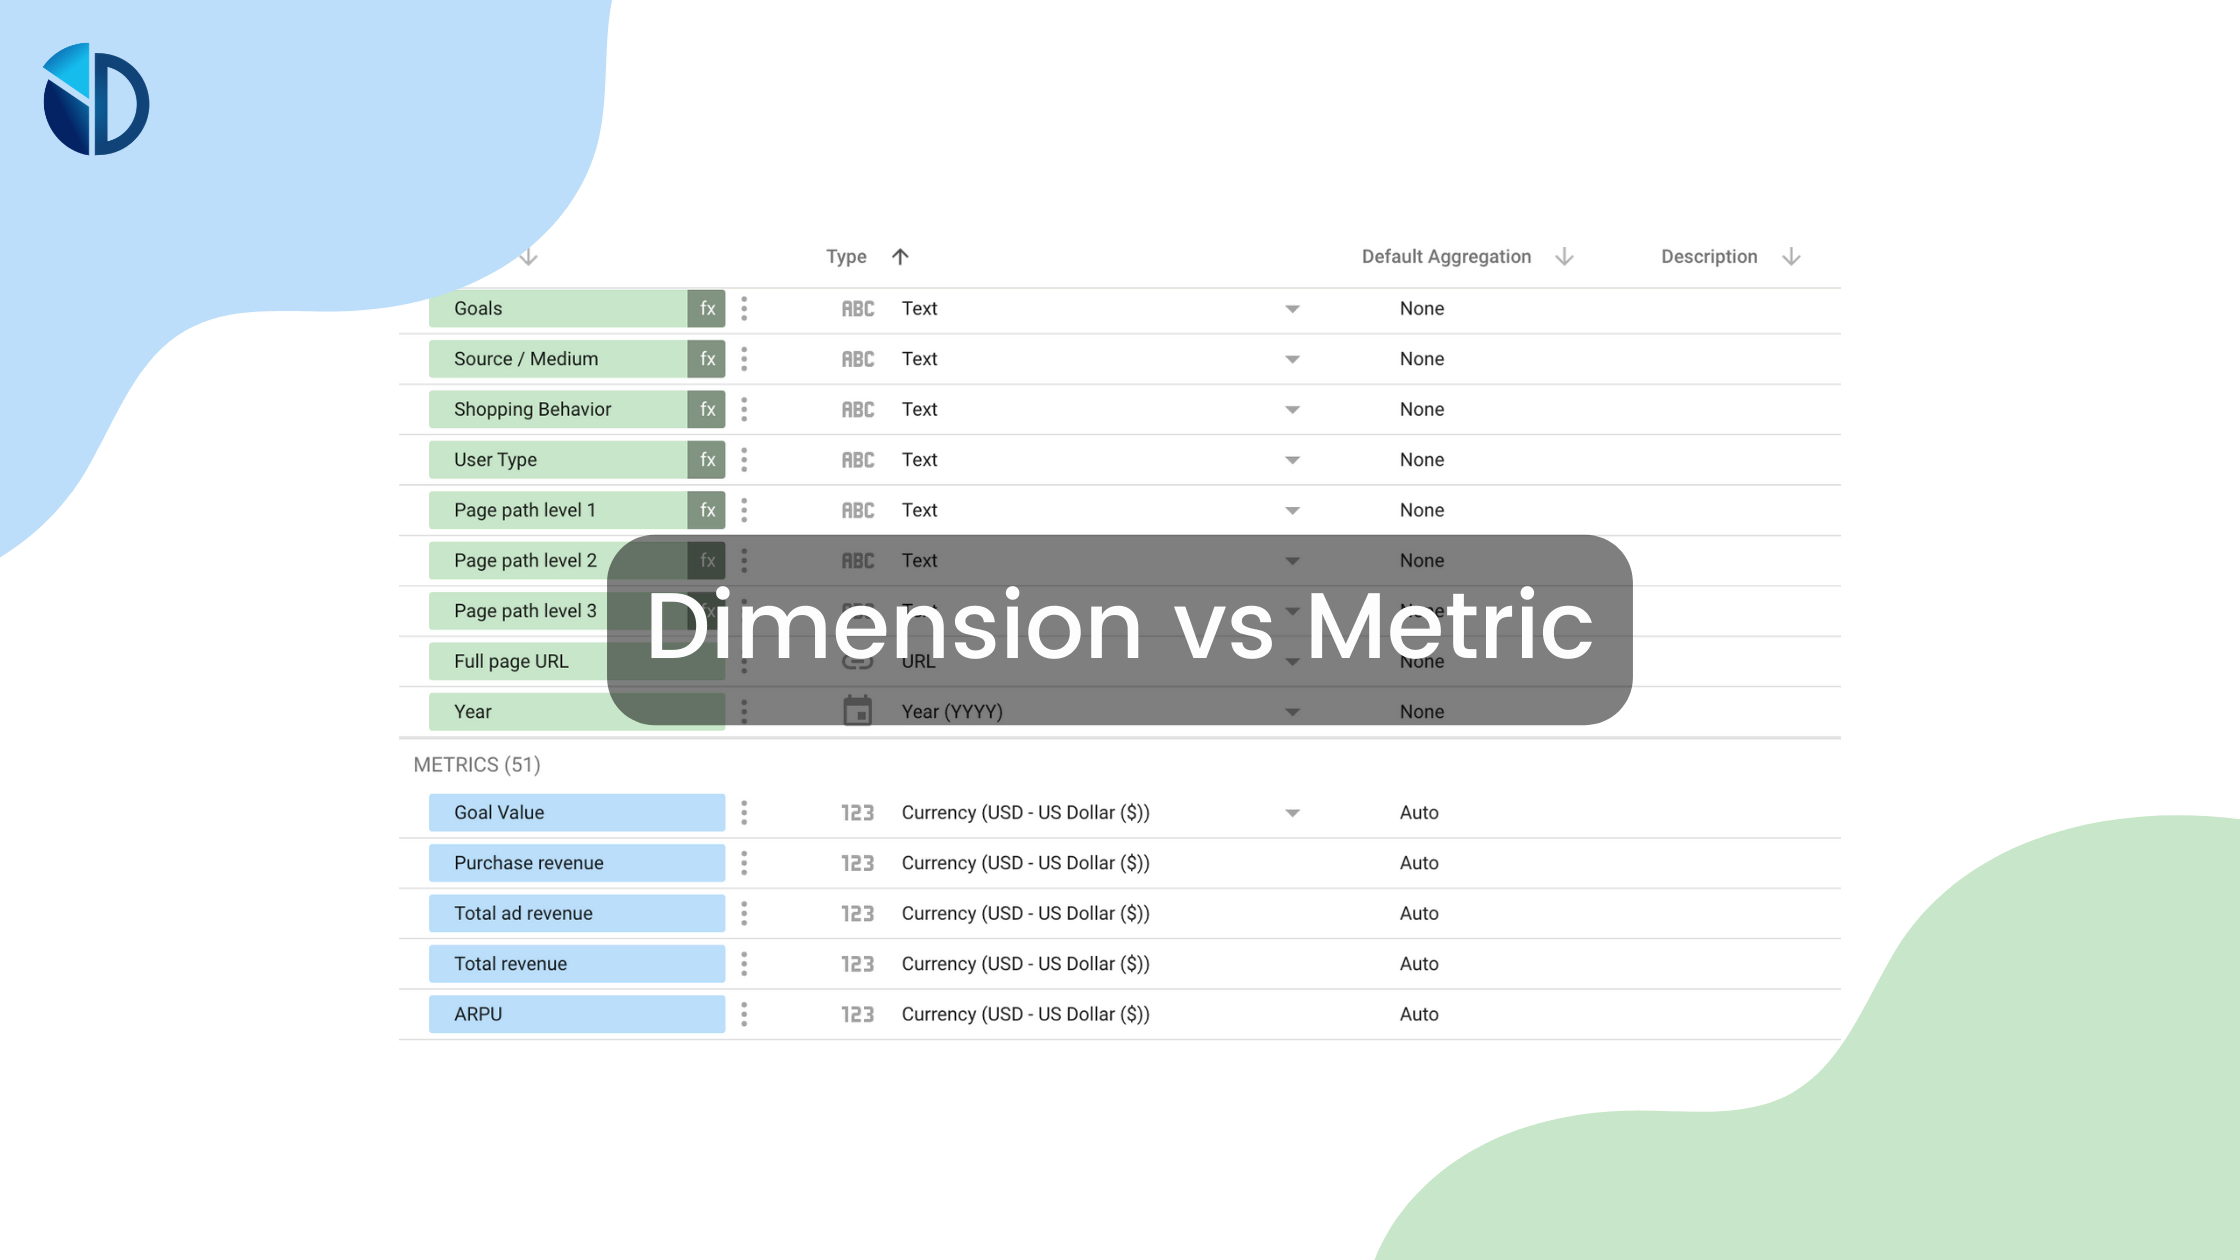
Data analysis involves a good eye and a knack for storytelling. You want graphs, charts, tables, and all other visualizations

Currently, the world produces roughly 2.5 quintillion bytes of data daily. Can you imagine what that amount of data would