


Key Metrics This Template Tracks
There are plenty of SEO metrics that you can track, but looking at all of them at once will likely confuse you rather than provide real value.
You should focus on tracking SEO metrics that are most conducive to deep insights or that paint a real picture of your SEO performance.
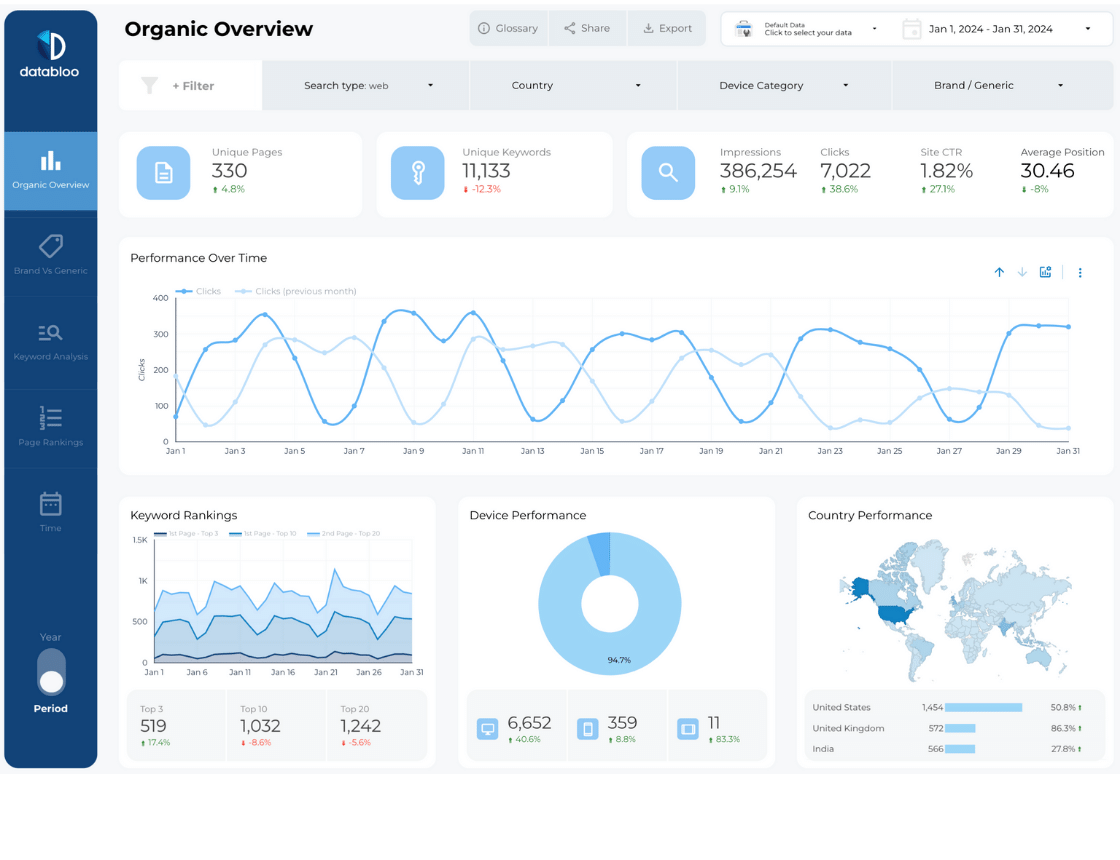
Organic Performance Overview
In our Google Search Console Data studio template, the Organic Overview tab gives you quick and comprehensive overviews of your website’s SEO performance.
- Unique Pages and Unique Keywords. These metrics will help you quickly understand how well your website’s new pages are being crawled by Google. It’s especially important these days when Google’s crawling budget is limited while more and more content is being published daily.
- Impressions, Clicks, CTR. General performance data on how often people see your website in search results and click your pages. Growth or decline in these metrics is a strong strategic signal.
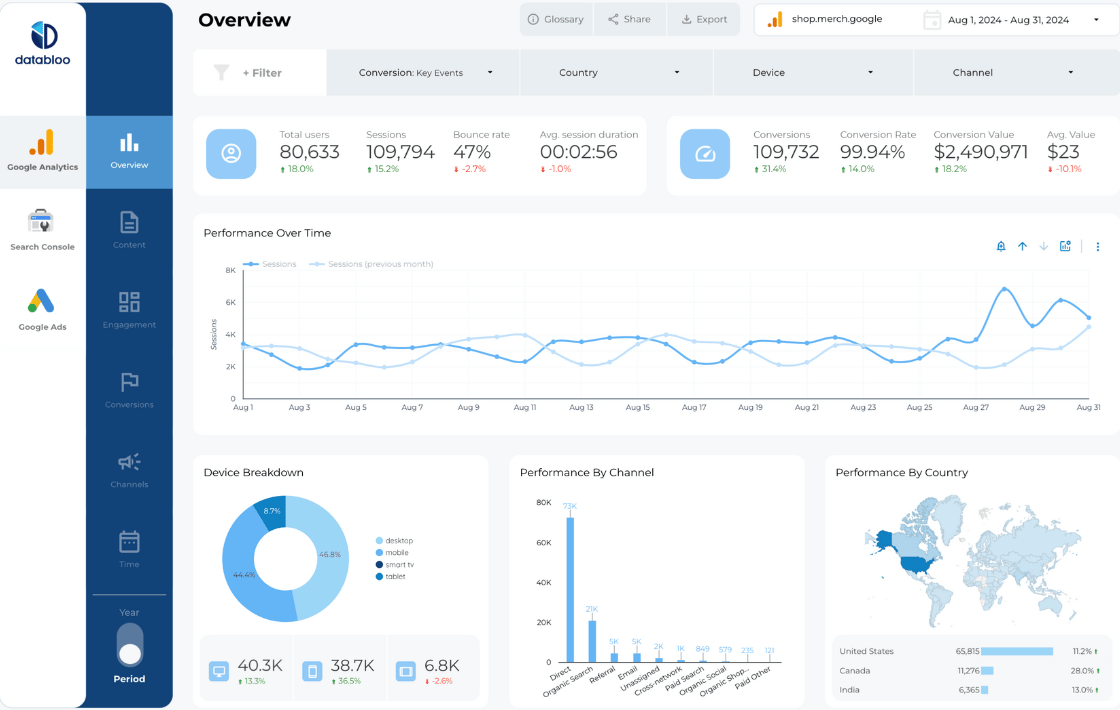
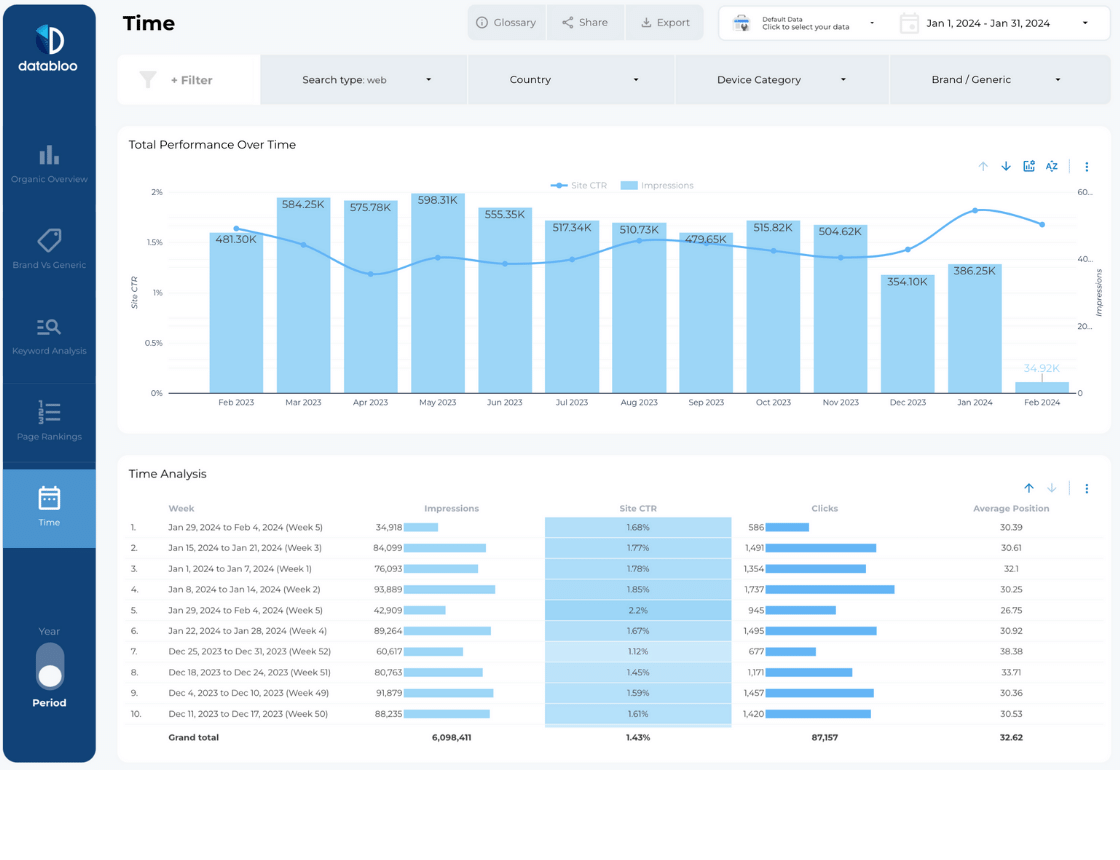
- Performance Over Time. The most visually intuitive way to analyze and predict your website performance is a timeline graph with organic clicks over time compared to past performance. Graph is built automatically for any custom date range you choose.
- Device and Country Performance. Overview of your organic performance in different geographies and on different devices.
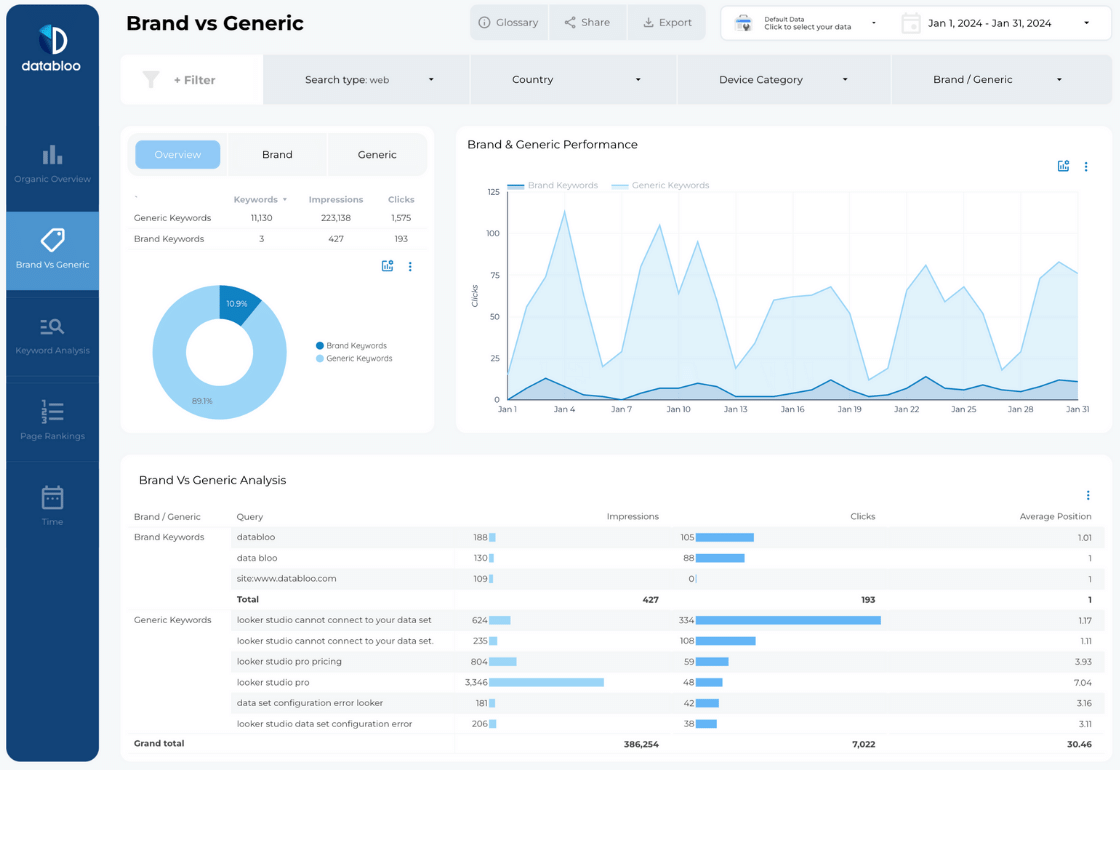
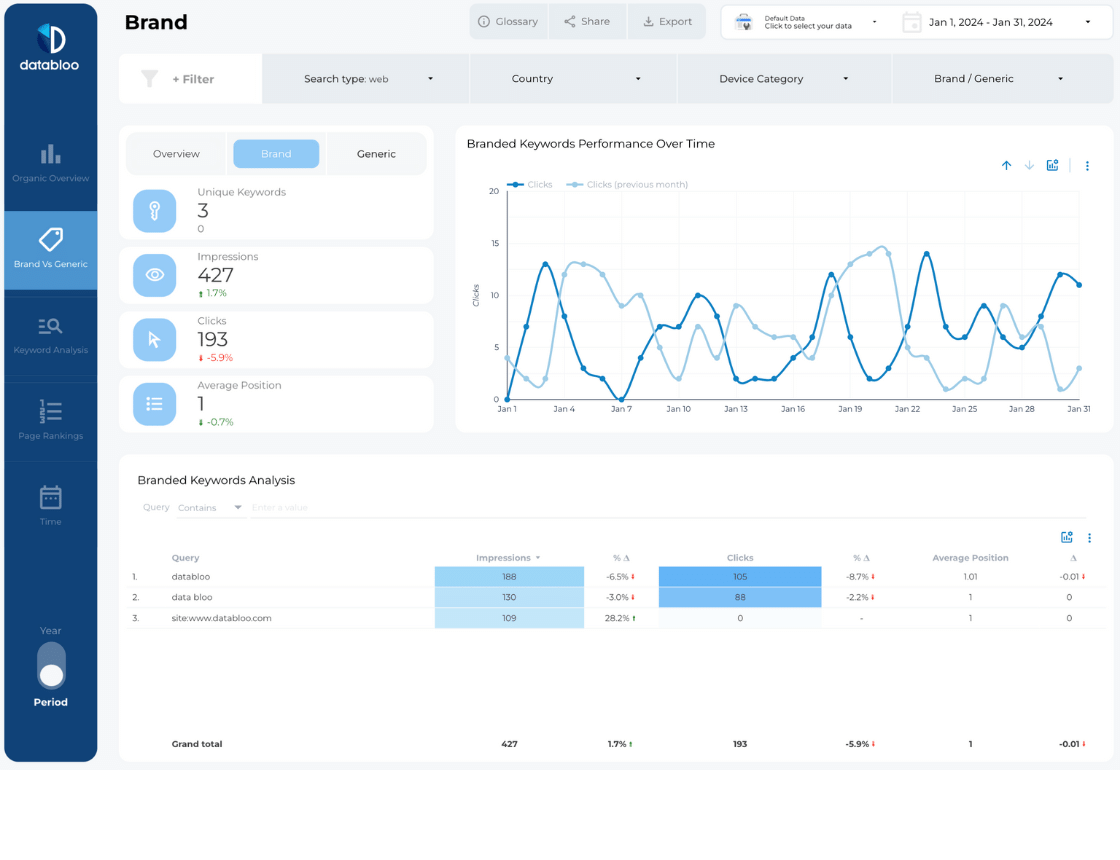
Brand vs Generic Analysis
Brand vs Generic tab can be valuable for several reasons.
First, you can quickly spot an increasing interest towards your brand in organic searches. That might mean your social media, PR or paid advertising is paying off or needs more attention.
Second, our Data Studio template helps you see what other keywords people associate with your brand. For example, they might search for your company name directly, or search for a specific product or a service from your company. Use this information to create high-converting landing pages or improve SEO of specific pages.
Additionally, you can use filters to see your brand performance in different countries, types of search (web, image, video, news), and on different devices.
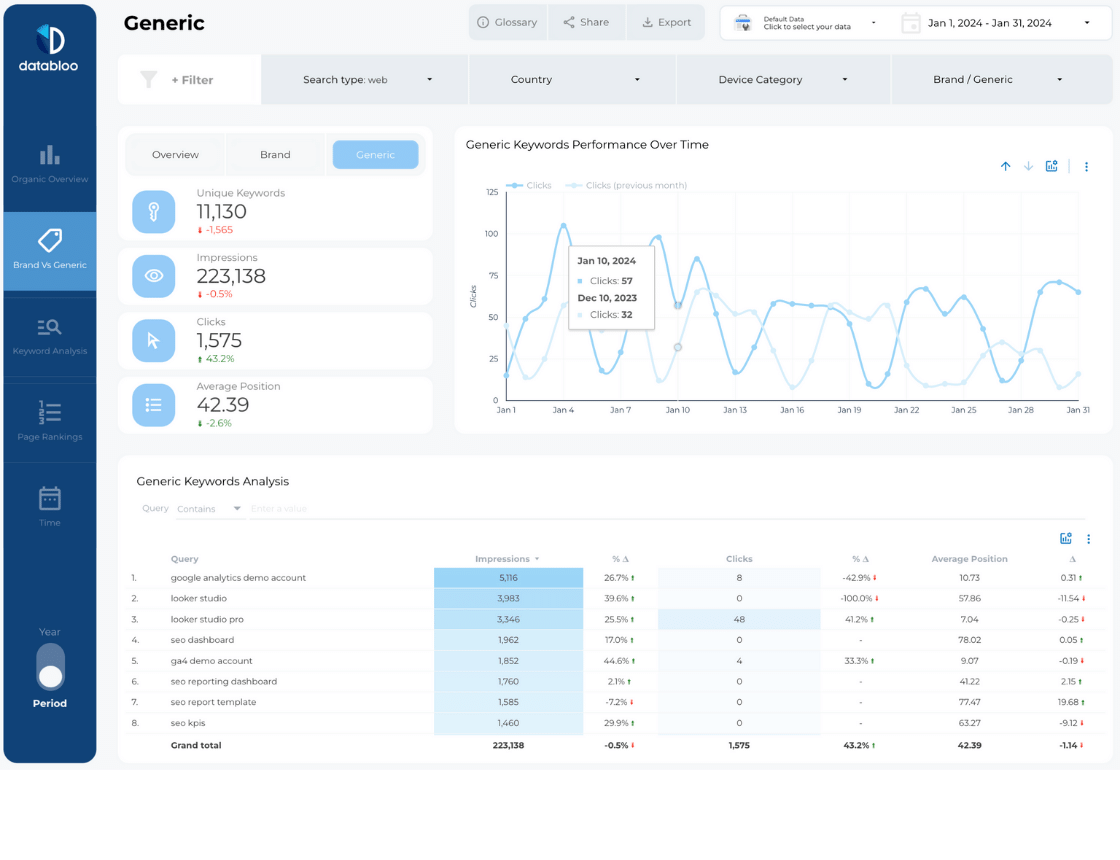
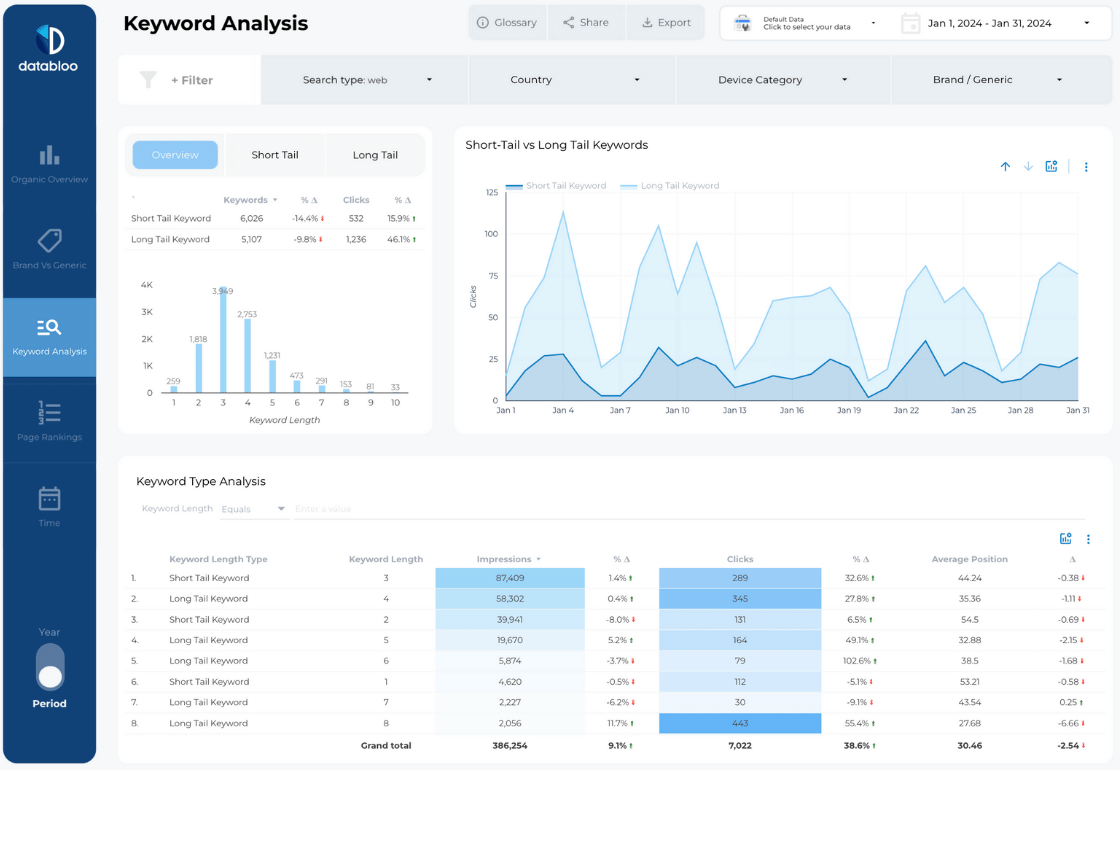
Keyword Advanced Analysis
Deep dive into keyword performance.
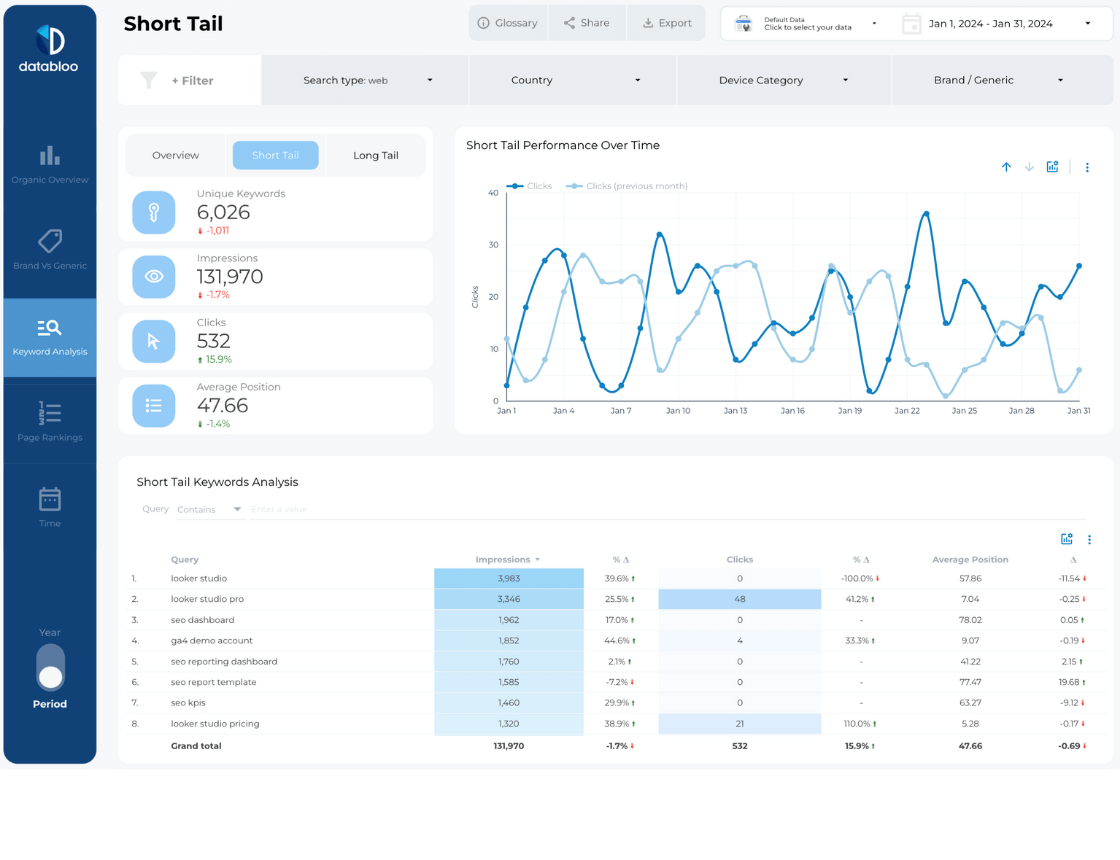
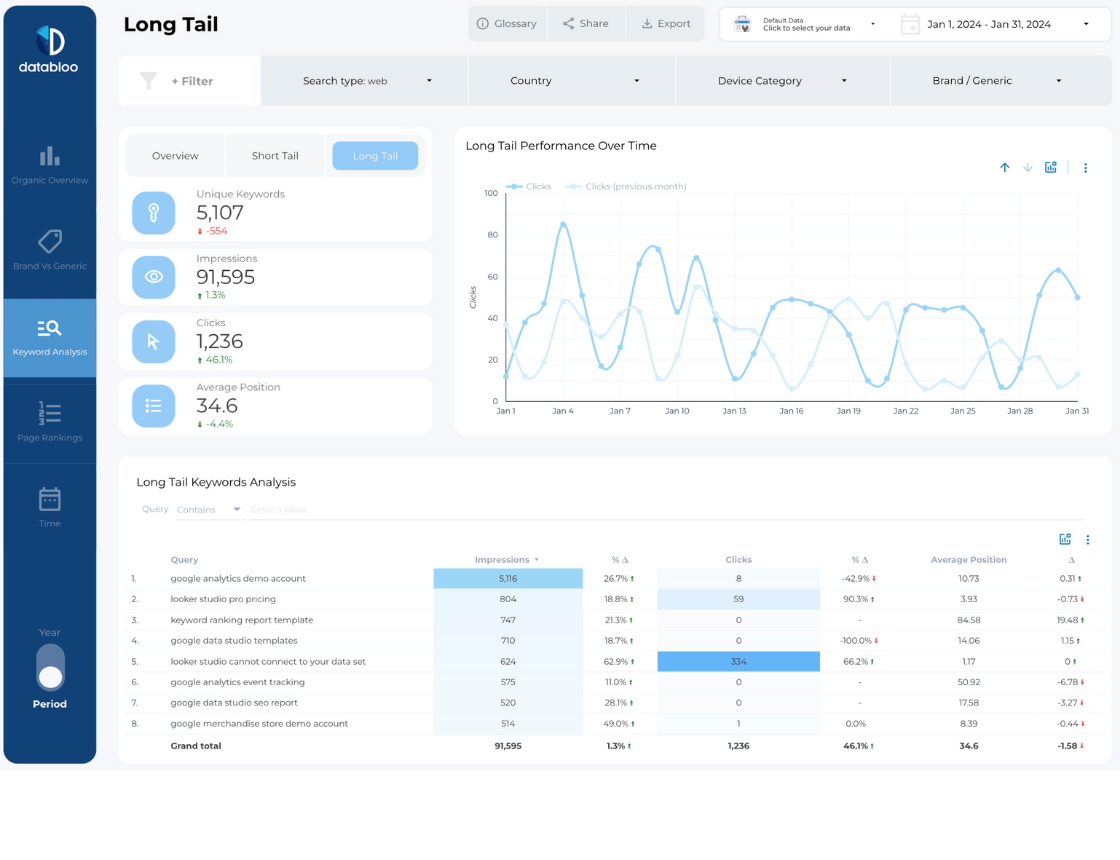
- Short Tail and Long Tail Keyword Performance. Short tail keywords and long tail keywords have very different dynamics. Short tail keywords are much more competitive and more often have commercial intent. Tracking them separately from long tail keywords lets you better understand where to focus your efforts and where you have more success.
- Keyword distribution. Our distribution graph helps you compare how many keywords of different length your website ranks for. It’s best to have an optimal portfolio, so, for example, if you’re ranking for too many long tails it’s usually a good idea to start competing for more different keywords.
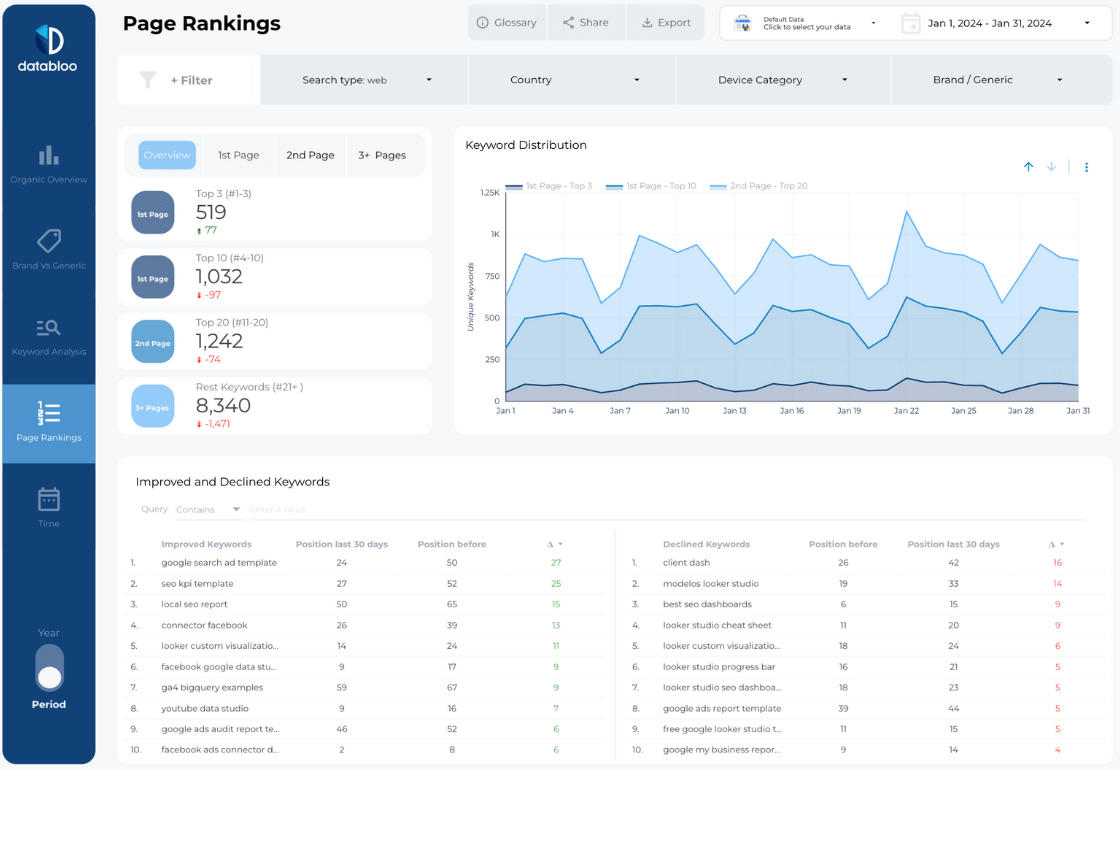
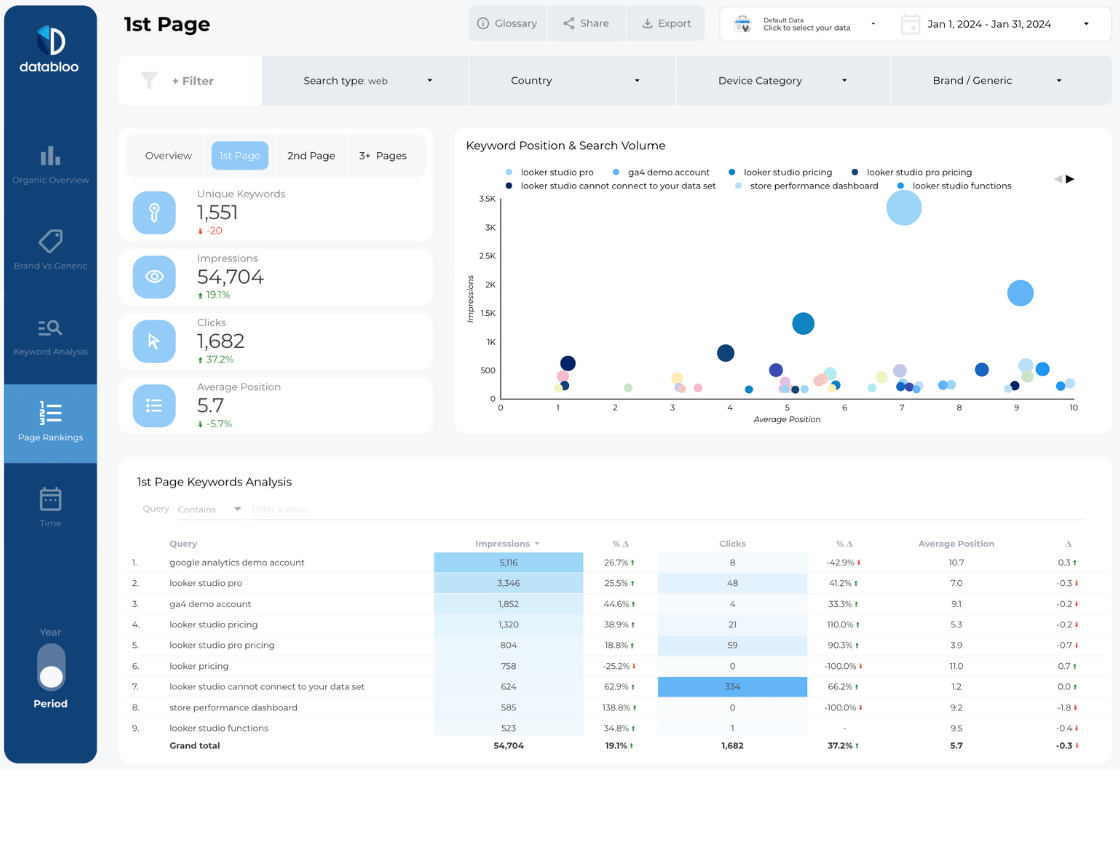
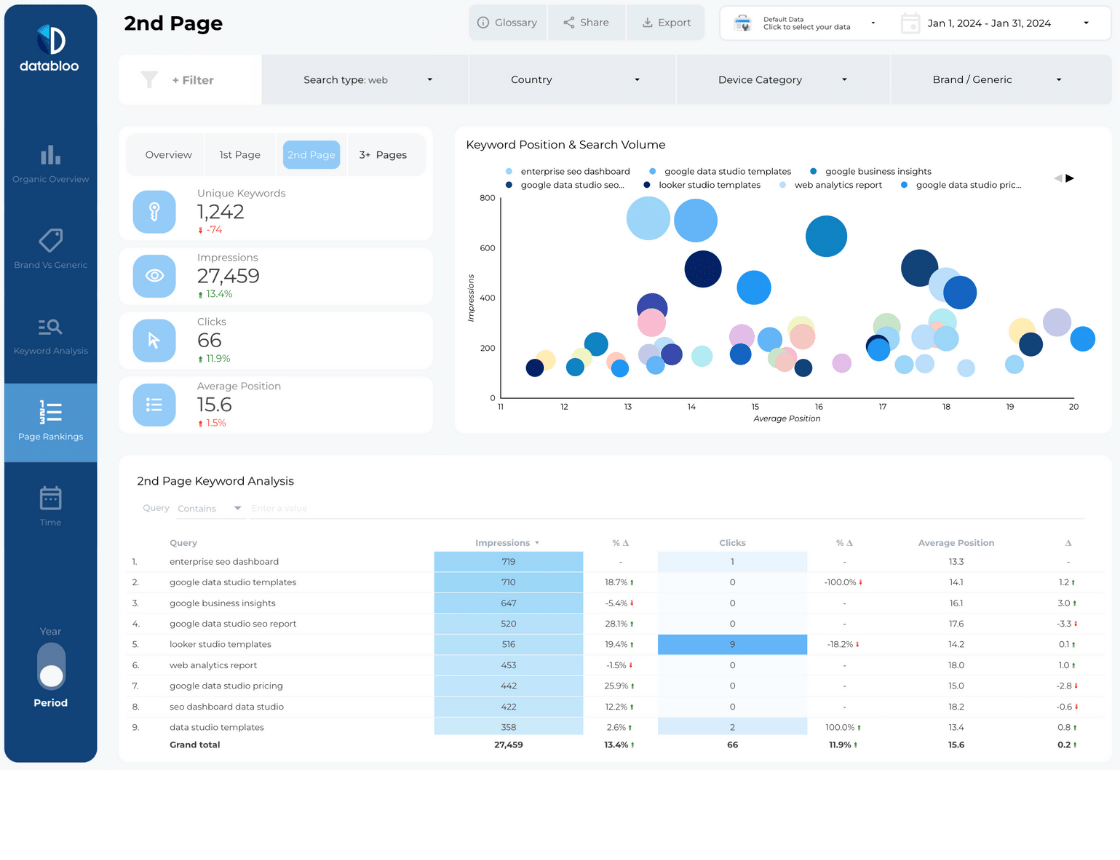
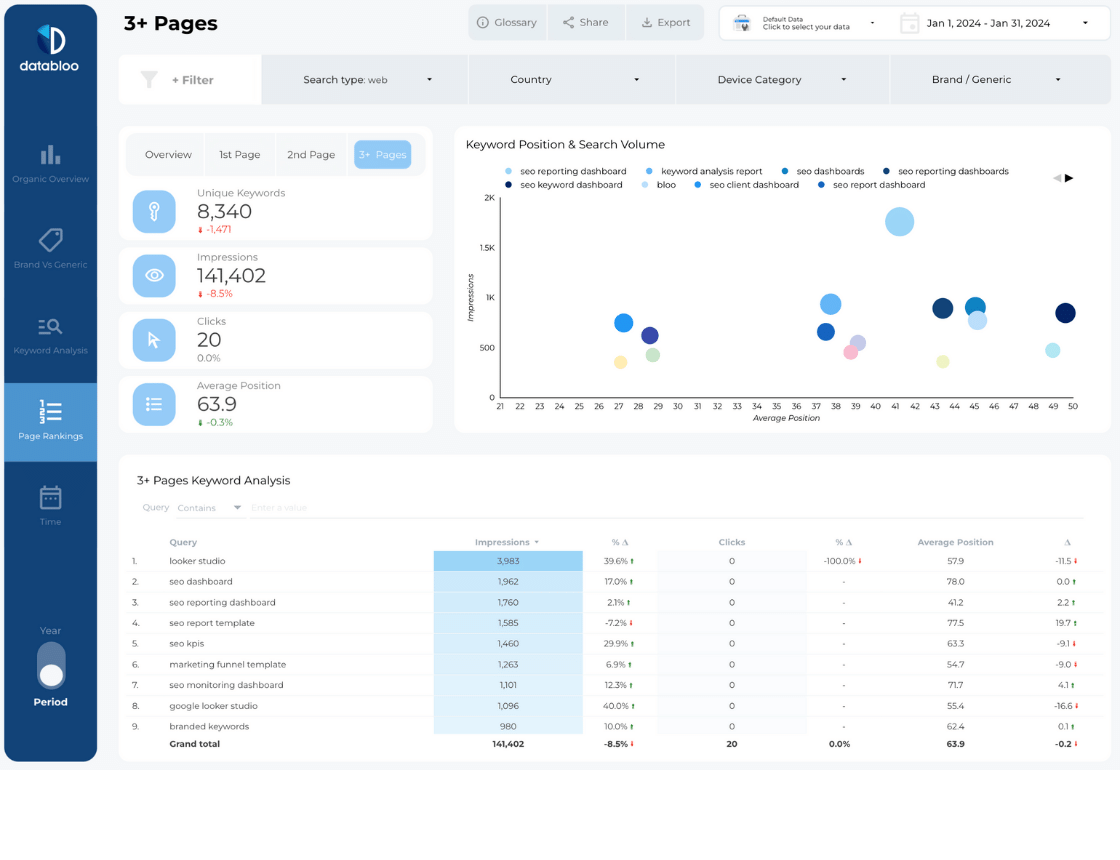
SERP Impact (Page Rankings)
Page rankings tabs in our GSC data studio template will help you see how many unique keywords you rank for on the 1st, 2nd, and 3rd page.
To help you analyze this data, we added keyword position and search volume graph to our report.
By combining data from both sections, you can spot ranking trends that would otherwise go unnoticed, for example:
- What keywords have more chances to get to the first page of Google?
- Do our keywords get stuck to the 2nd and 3rd page too often recently?
- What’s the average position of our keywords when they’re on the 2nd page?
- How quickly our first page keywords are moving up in the last month?