

Make Your Ads Work Harder with Our Facebook Ads Report Template
Our updated Looker Studio Facebook Ads Template makes it easy to understand and improve your ads, helping you see better results without the stress.
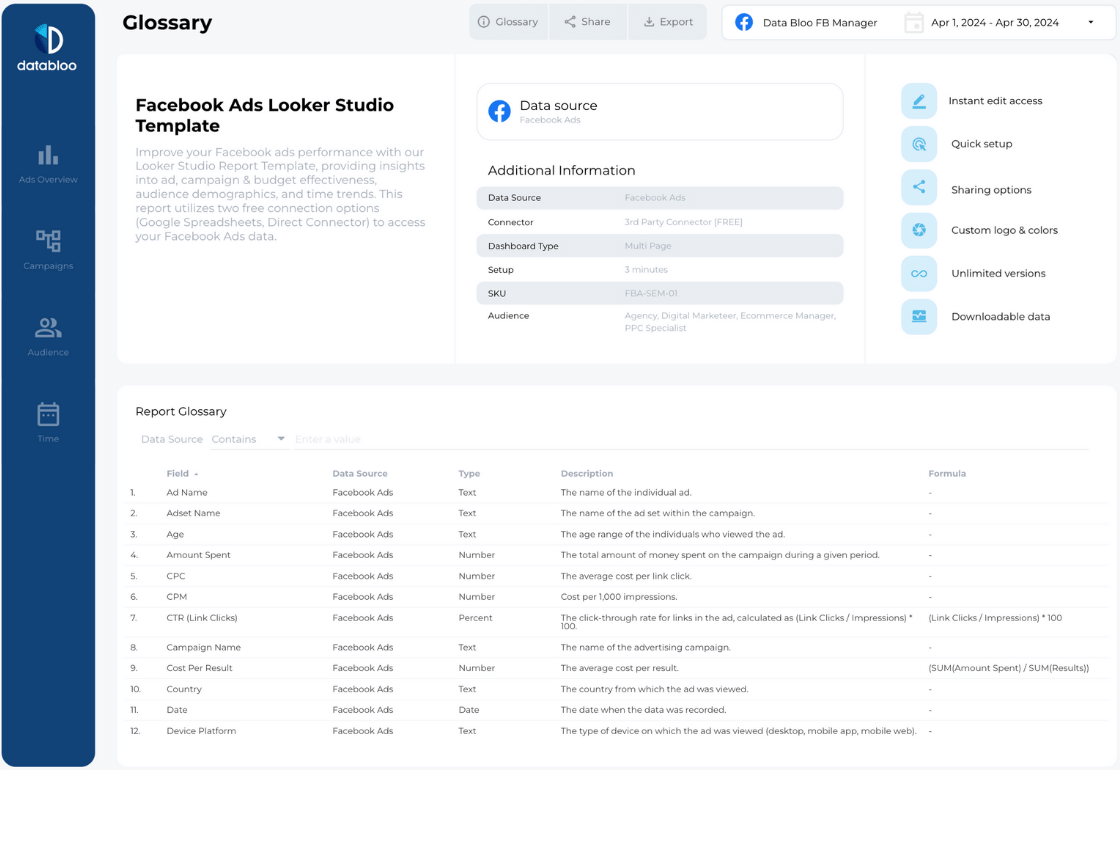
If you advertise on Facebook, you know it can boost your business. But managing the data from your ads can be overwhelming. With our Facebook Ads Report Template, you gain a powerful tool that simplifies this process, transforming your ad data into clear, actionable insights. Designed to streamline your campaign management, this Facebook Ads reporting template helps you quickly understand how your ads are performing and make better budget decisions to optimize your overall performance.
Comprehensive Campaign Analysis
Our Facebook marketing report template answers essential questions that guide your advertising strategy:
- How many purchases have been made across Facebook platforms (Facebook, Instagram, Messenger, Audience Network)?
- What is the overall return rate for each ad campaign?
- How does the cost per return vary across different platforms?
- What trends are seen in impressions and clicks for each campaign?
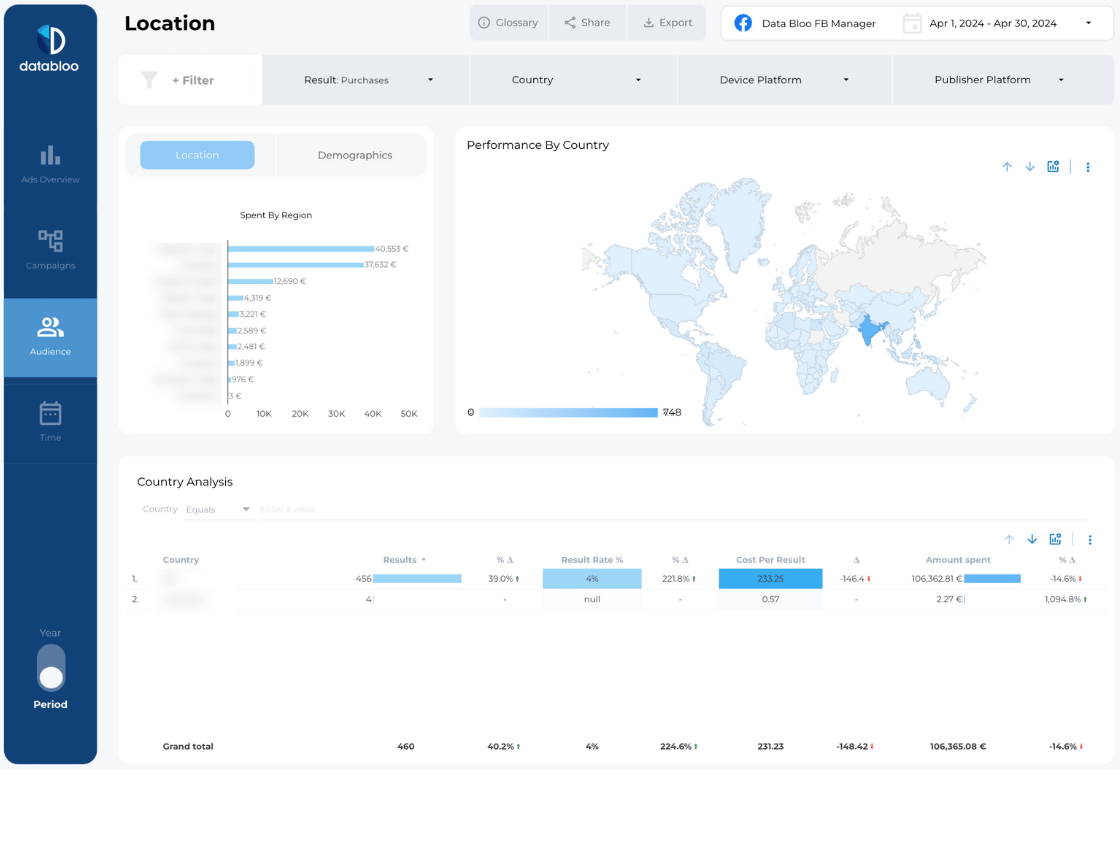
- How does key conversion data vary across countries, and which regions show higher conversion rates?
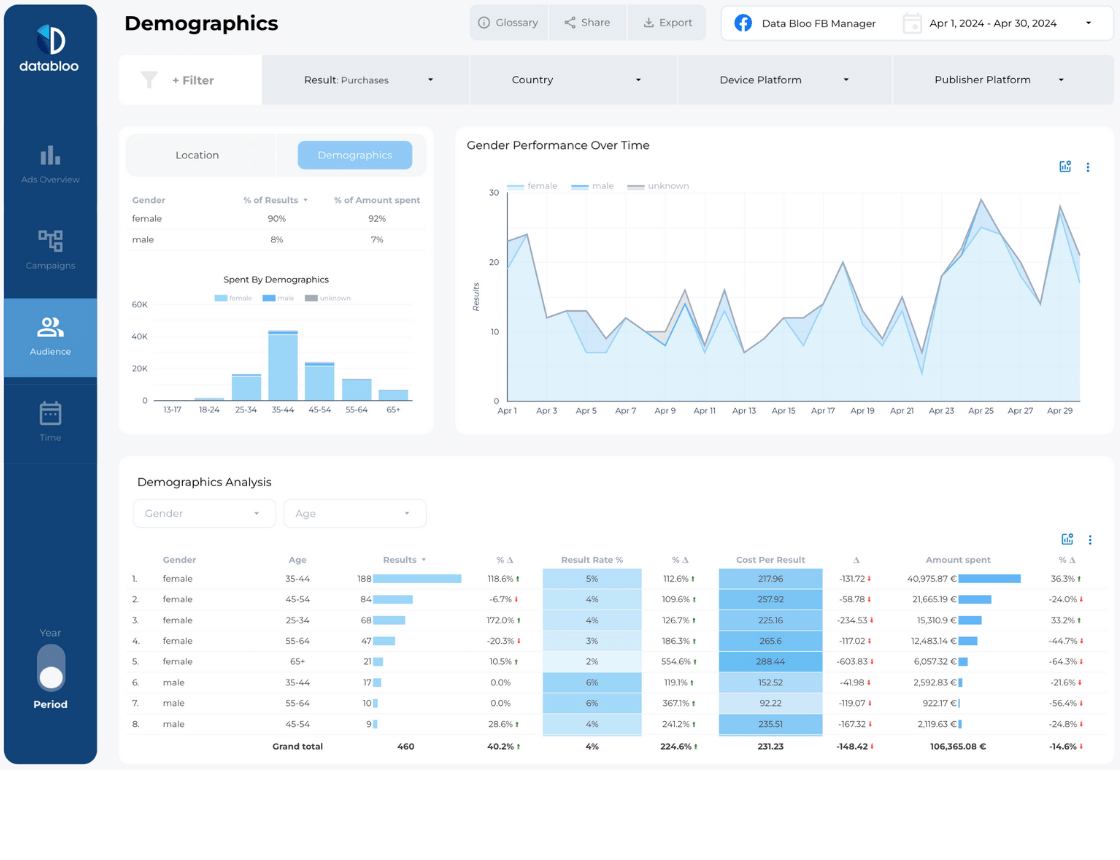
- What interactions do different demographic groups have with your ads?
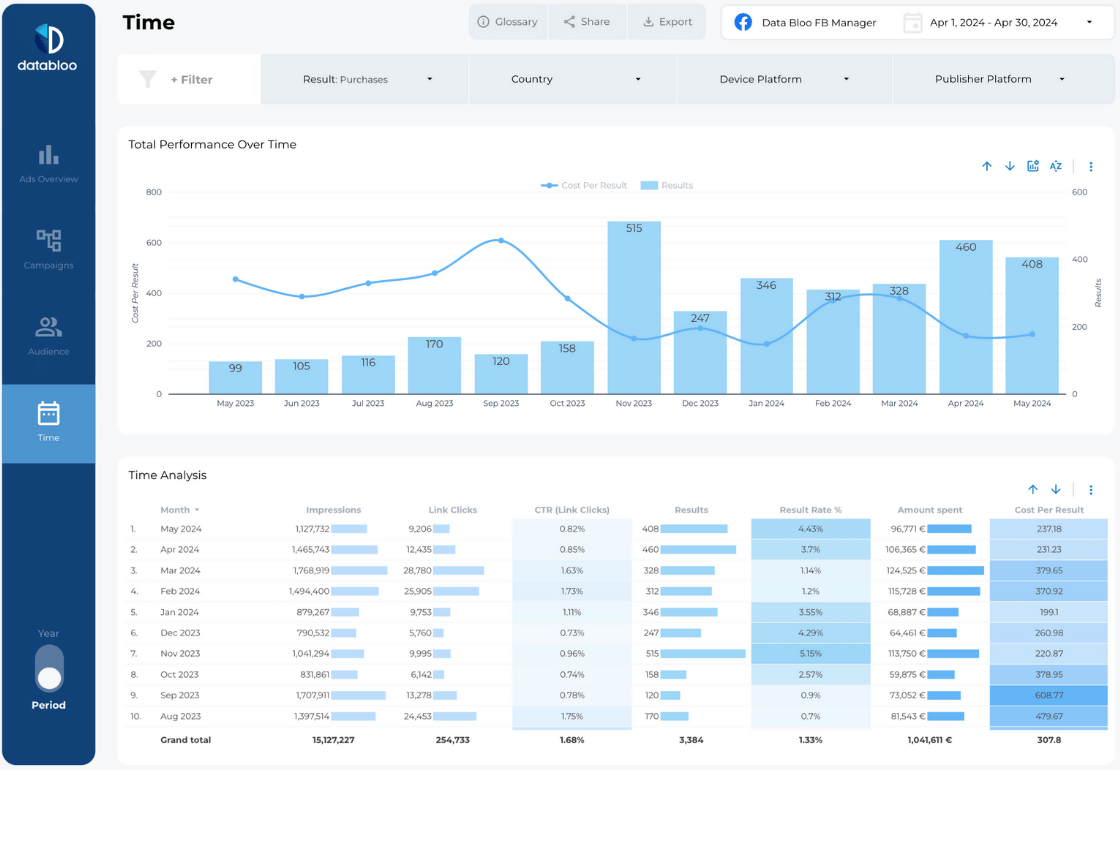
- Are your ad engagements improving month over month?
- What is the click-through rate (CTR) for your campaigns?
- How much have you spent on ads over the selected period?
These questions are crucial in shaping your Facebook advertising strategy, and our Facebook Ads report template provides the answers through user-friendly charts and layouts, making complex data easy to digest and act upon.
Focus on What Matters in Your Facebook Ads
Sorting through ad data can be confusing and time-consuming. Our Facebook Ad template is structured into several detailed sections, each designed to give you a comprehensive view of specific aspects of your Facebook advertising:
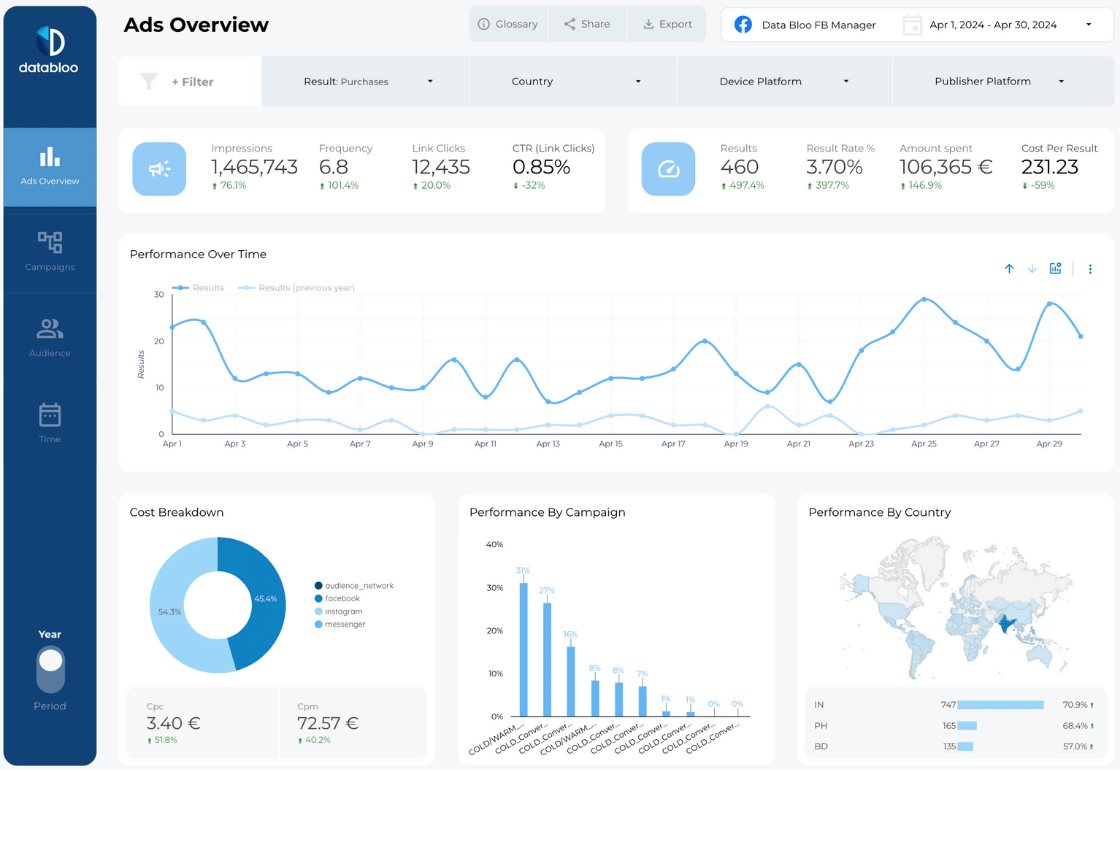
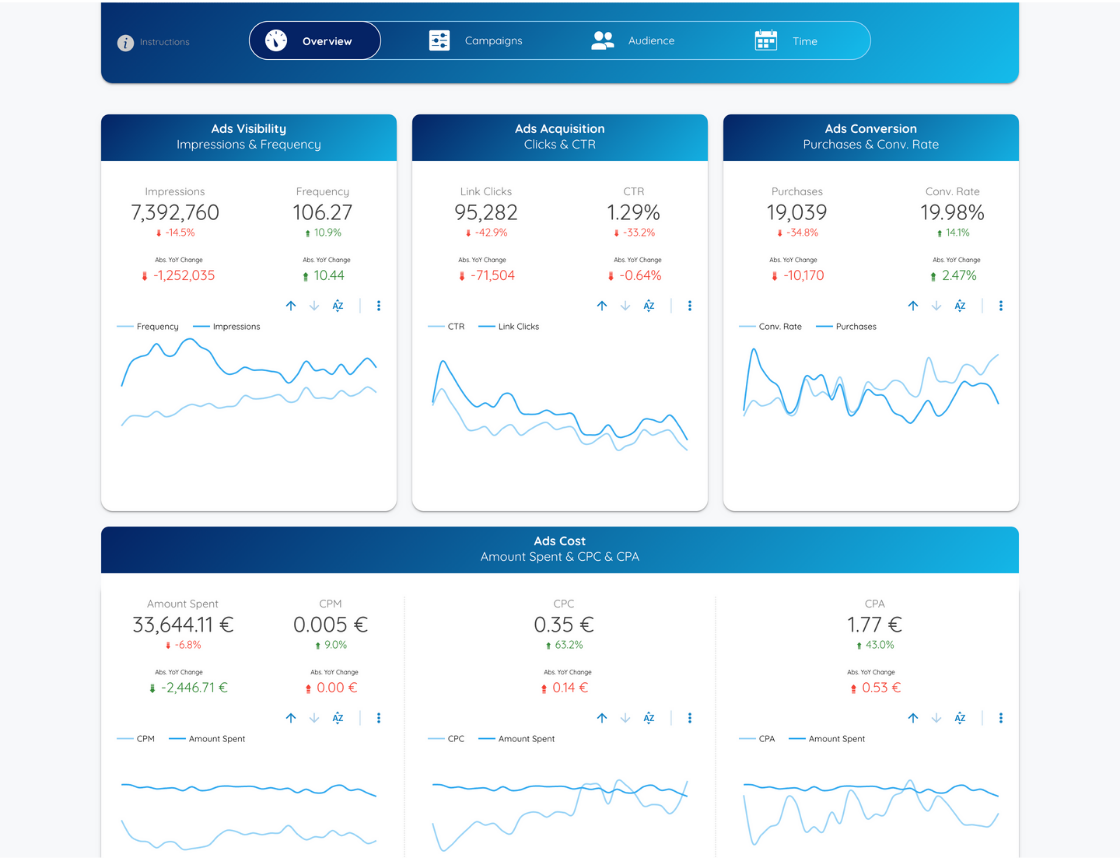
- Overview Page: Here, you will find the most important metrics of your ads account, including impressions, frequency, link clicks, CTR, results / conversions, result rate, cost per result, amount spent, CPC and CPM. Additionally this page helps you understand at a glance the cost breakdown among the platforms, the top performing campaigns and locations. whether your ads are gaining traction and meeting expected performance metrics.
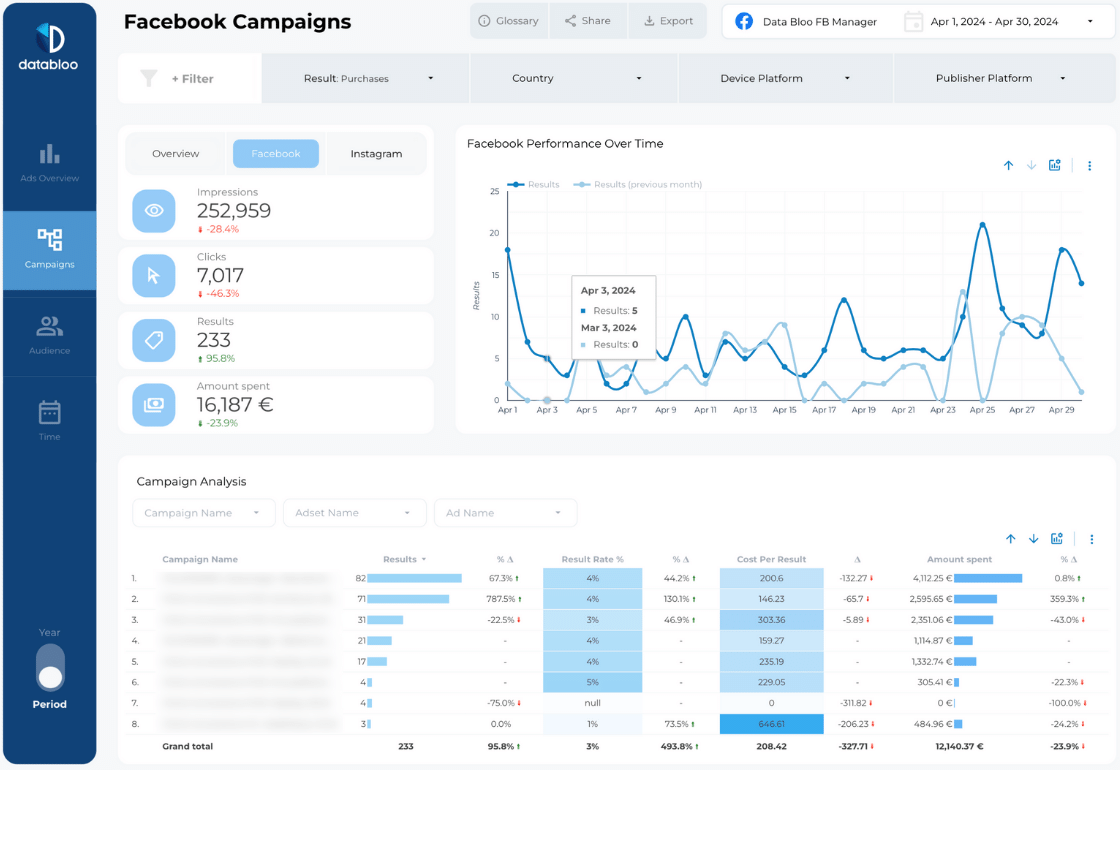
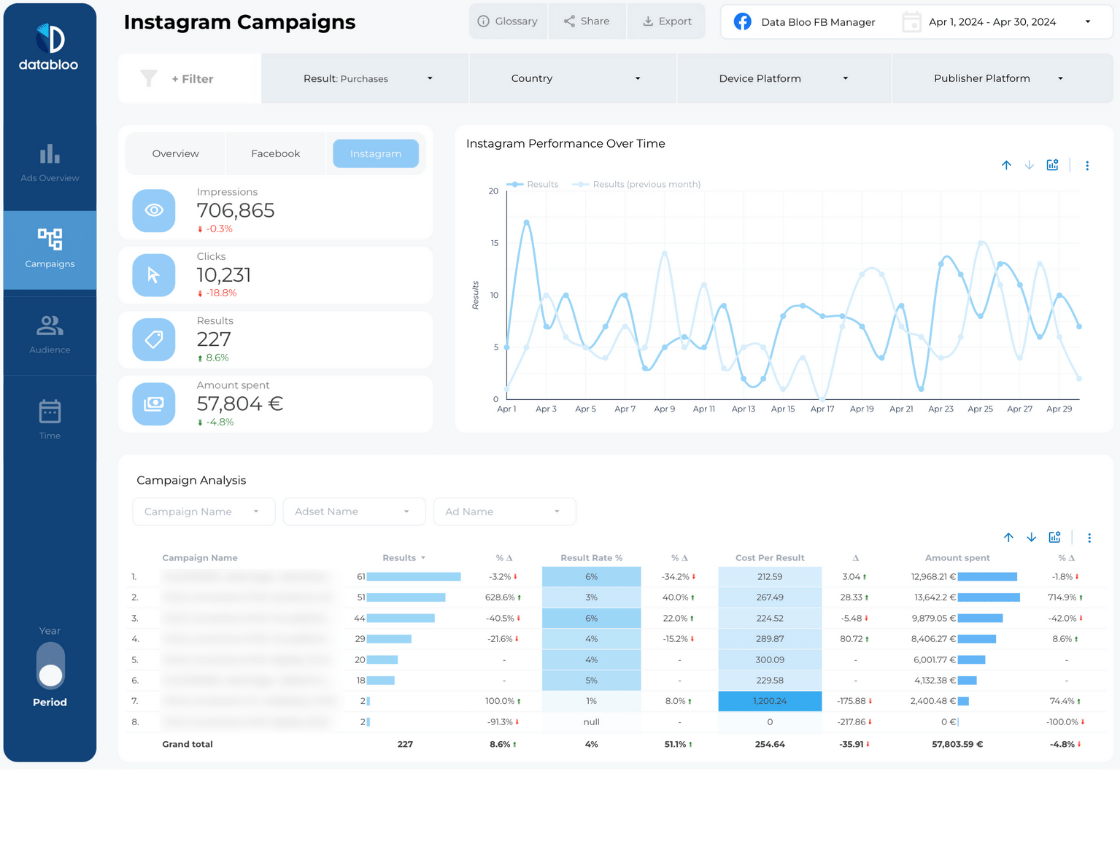
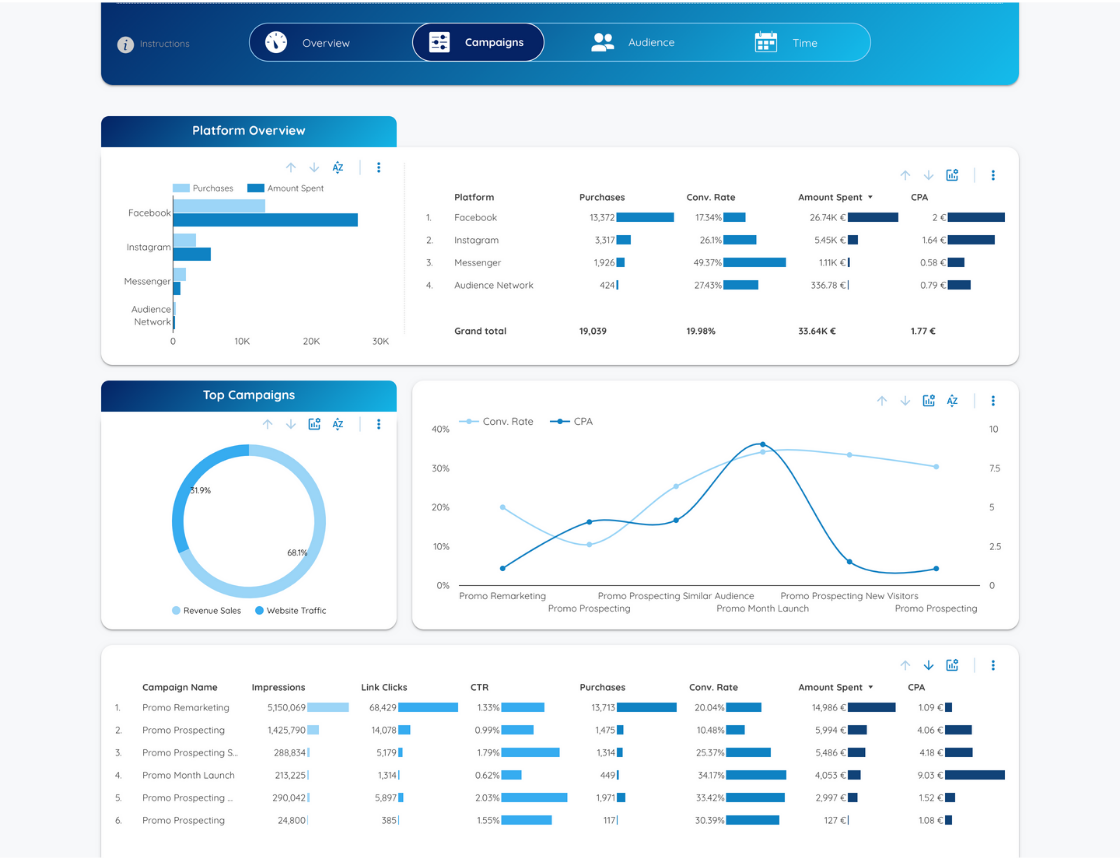
- Campaigns Page: Dive into detailed data across Facebook, Instagram, Messenger, and the Audience Network. The Facebook campaign report template provides separate analysis sections for Facebook and Instagram campaigns making easier for you to focus on what matter in your campaigns. It breaks down conversions, conversion rates, and spending by platform, enabling you to see where your budget is making the most impact.
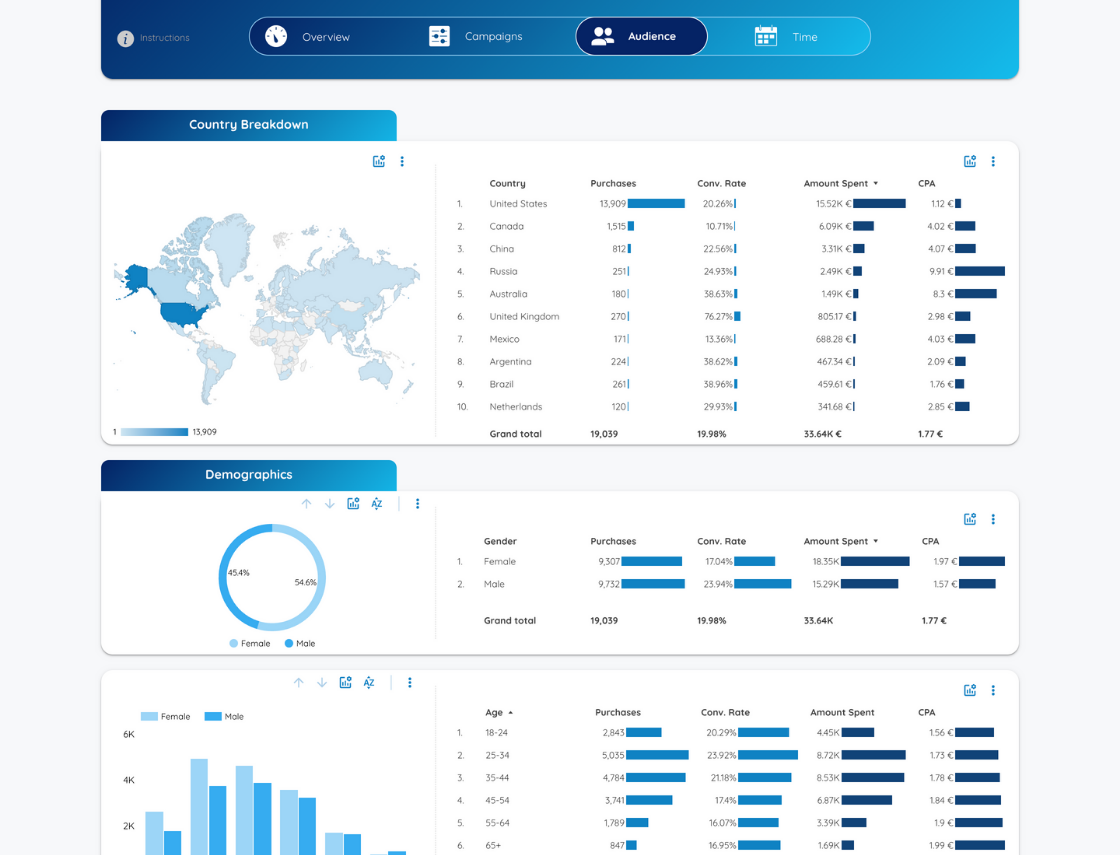
- Audience Page: Recognize which countries your audience originates from through our audience page. This page provides insights into demographic interactions with your ads, helping you tailor your future campaigns to better target potential customers based on age, gender, and geographical location.
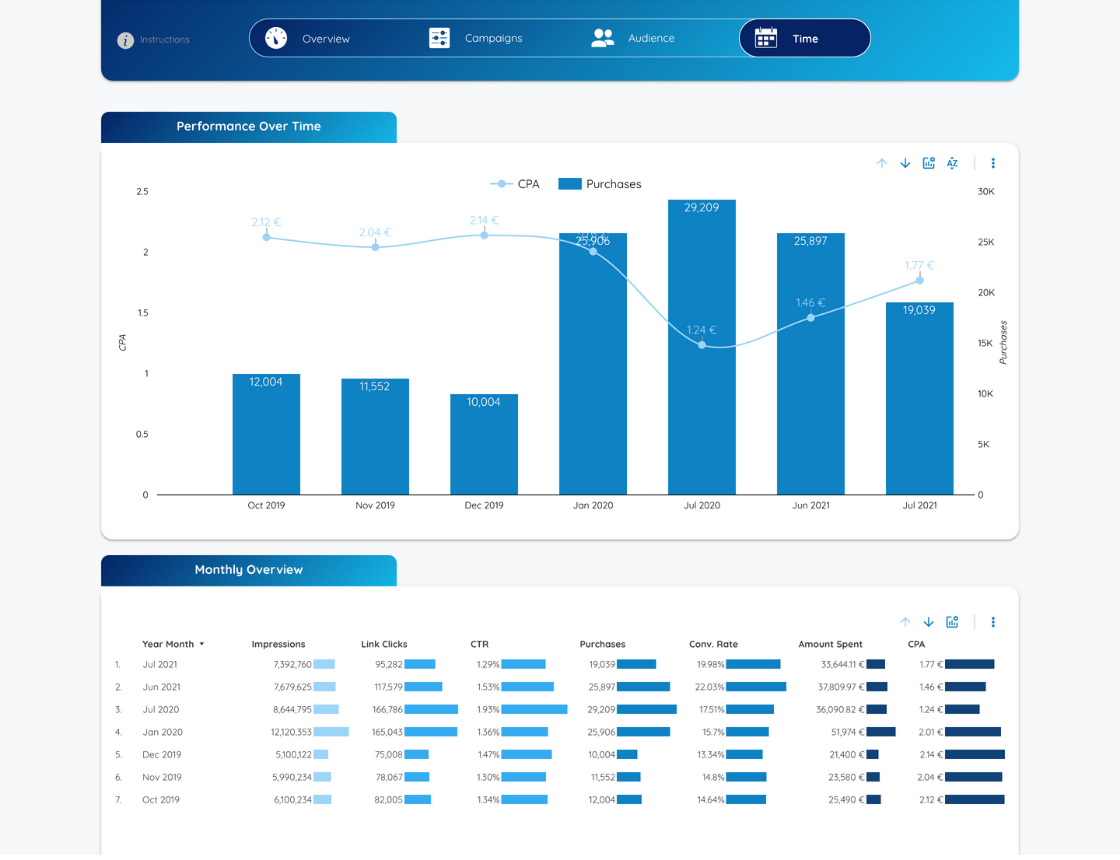
- Time Page: Monitor how your ads perform over different periods—days, weeks, months, or even years. This longitudinal analysis can help you spot trends and patterns in campaign performance, guiding your planning and budget allocation.