


Questions You Can Answer With Our GA4 Report
Traffic
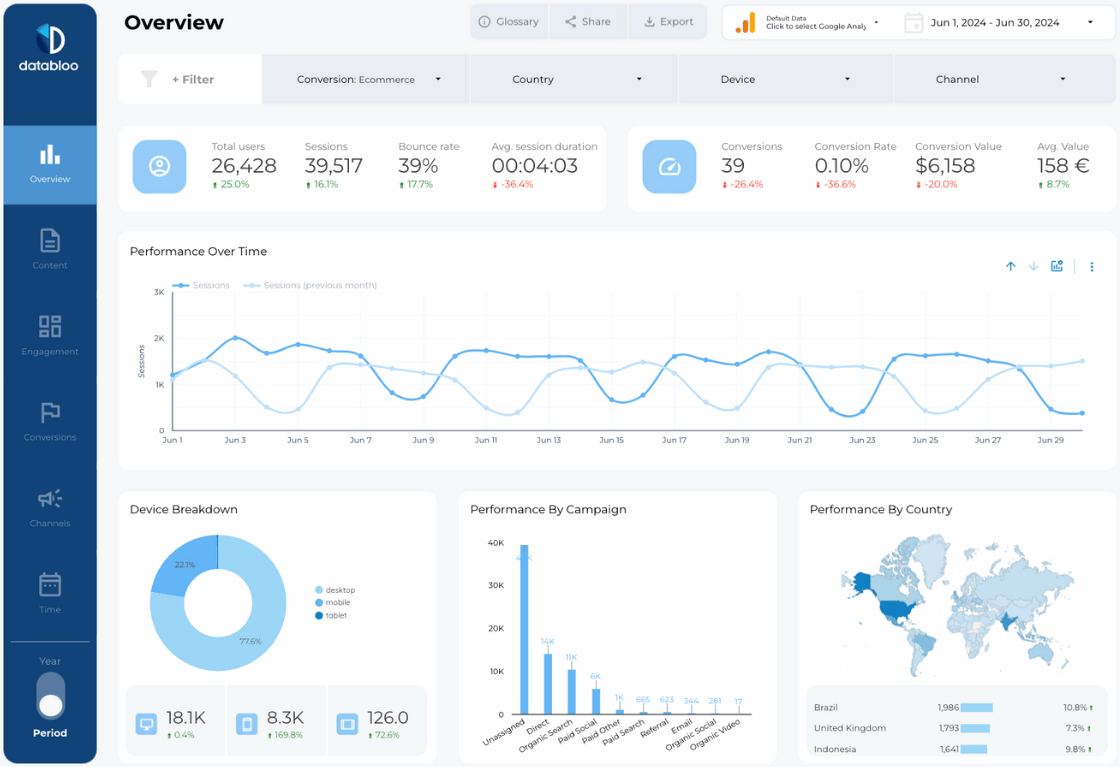
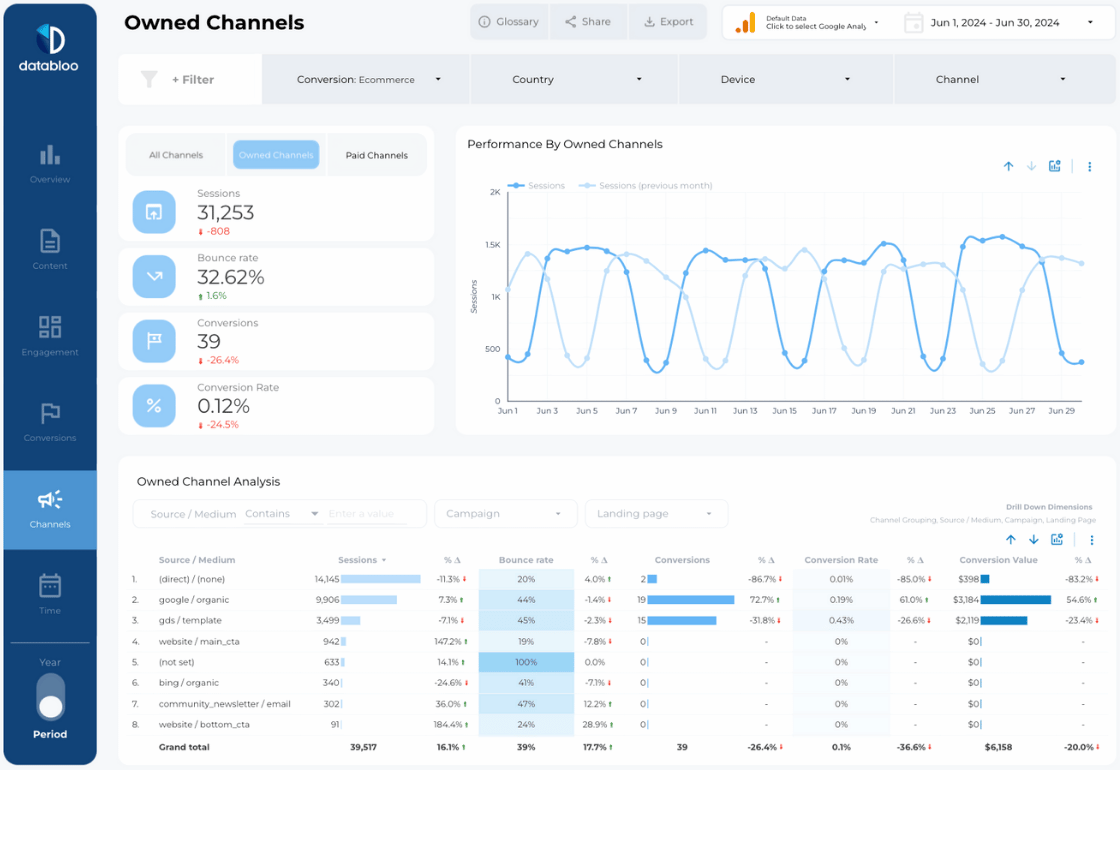
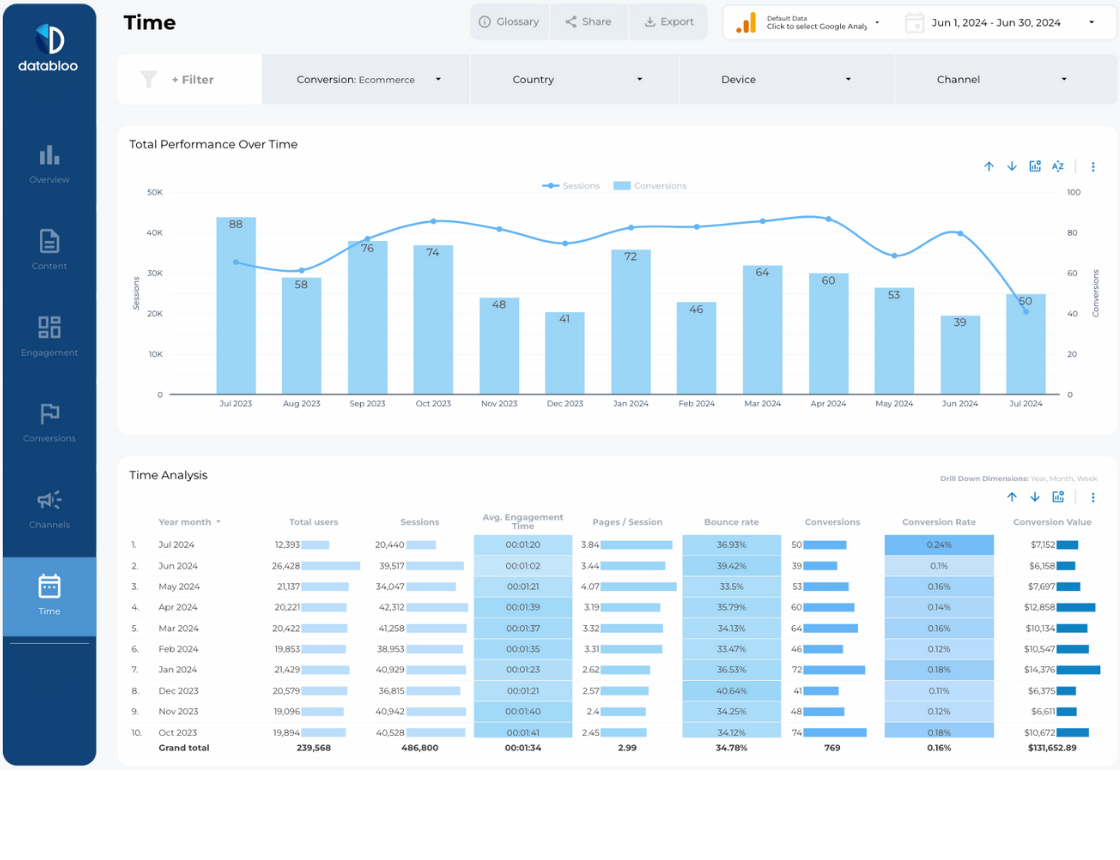
How many sessions have we gained / lost since last month? Last quarter, year?
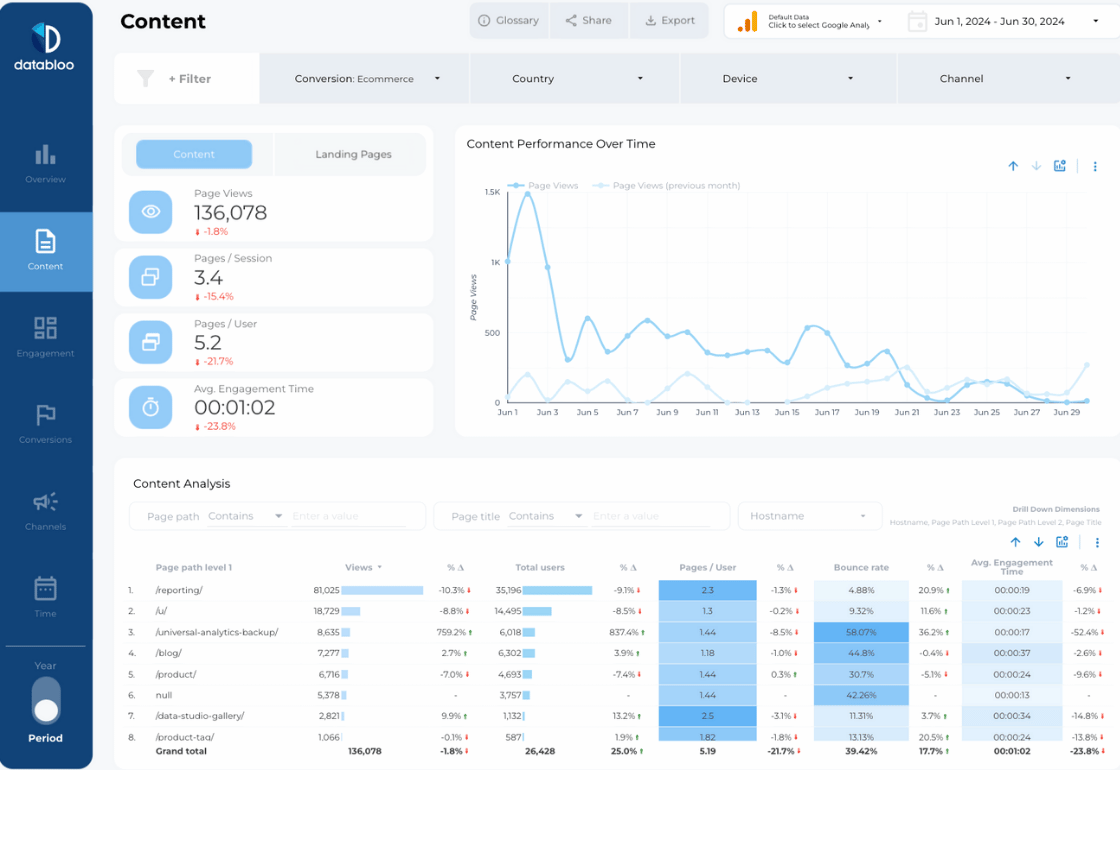
What pages and topic clusters are driving the most traffic in this quarter?
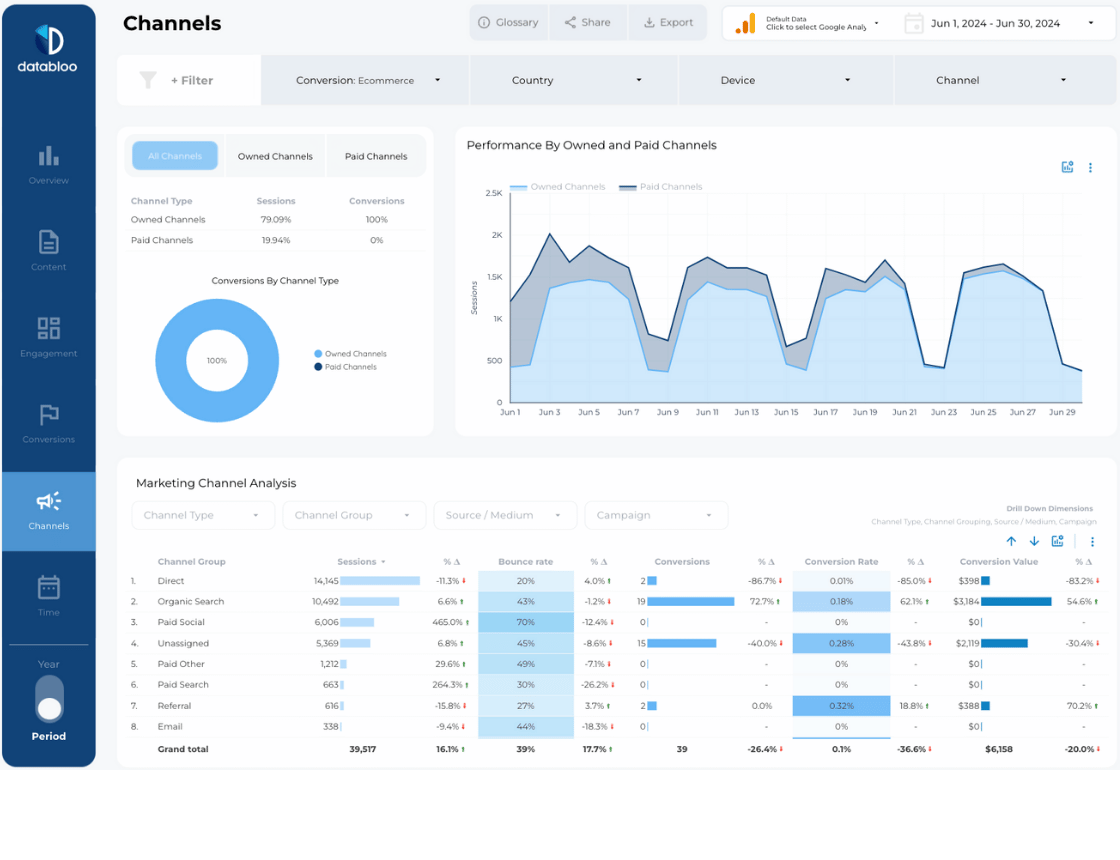
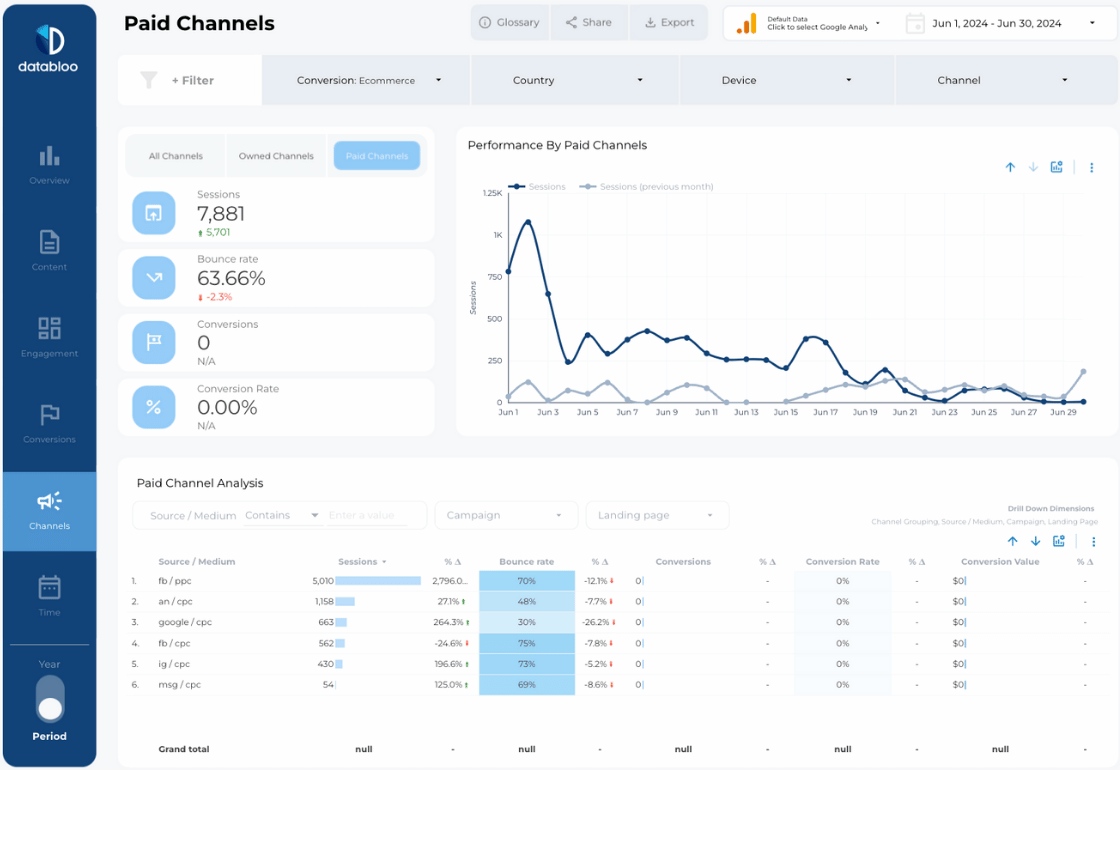
What channels are our users coming from? (organic, paid, referral, email, etc.)
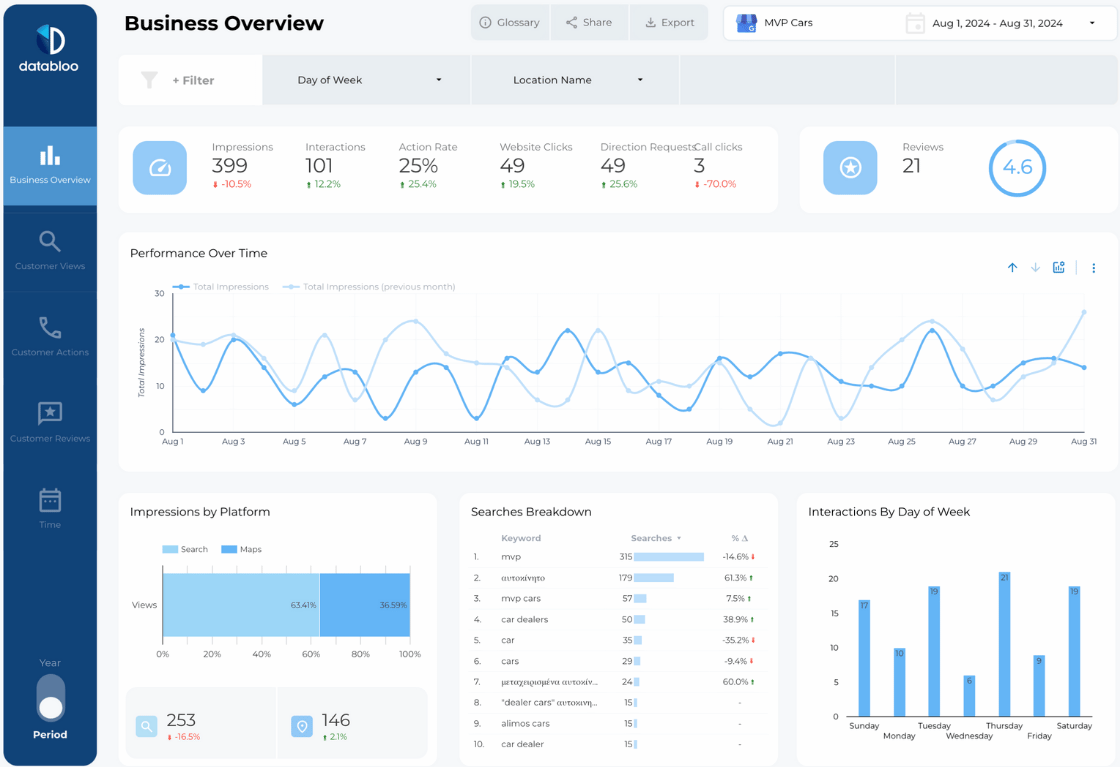
What’s the top traffic-generating country this month?
Which devices are driving the most traffic?
What’s the growth percentage in new users year-over-year?
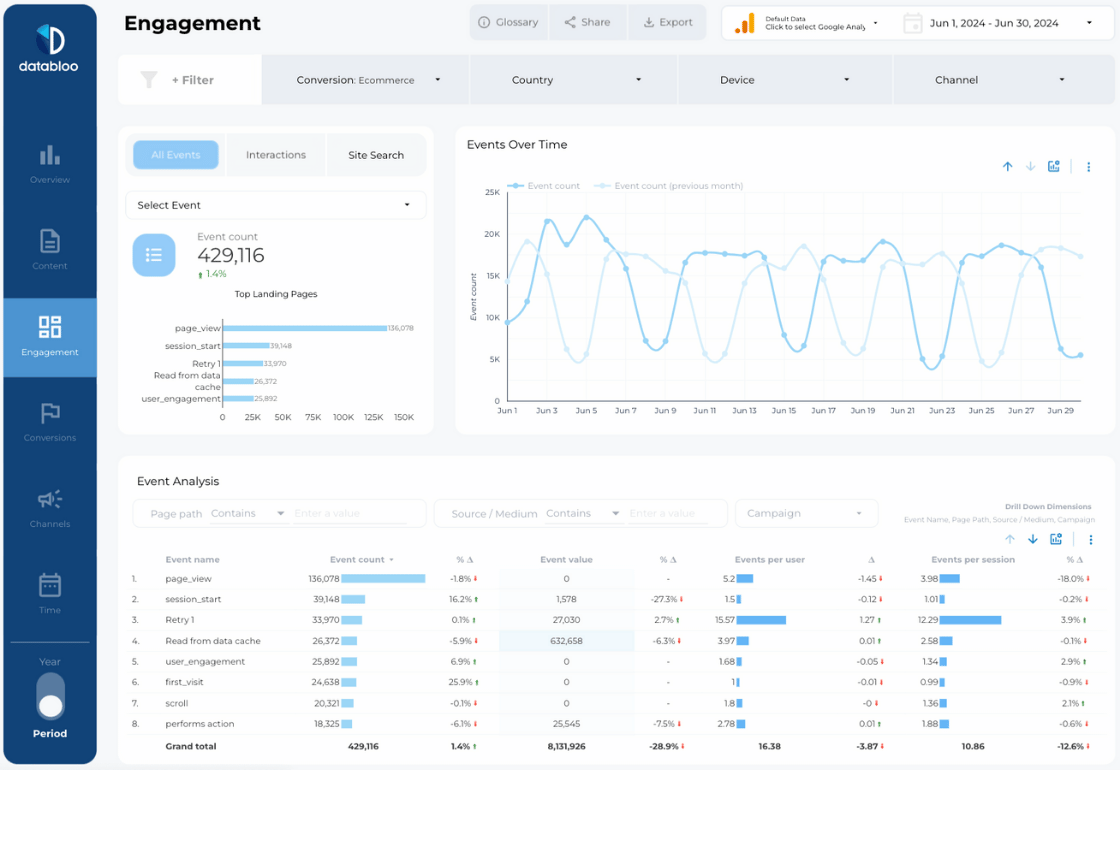
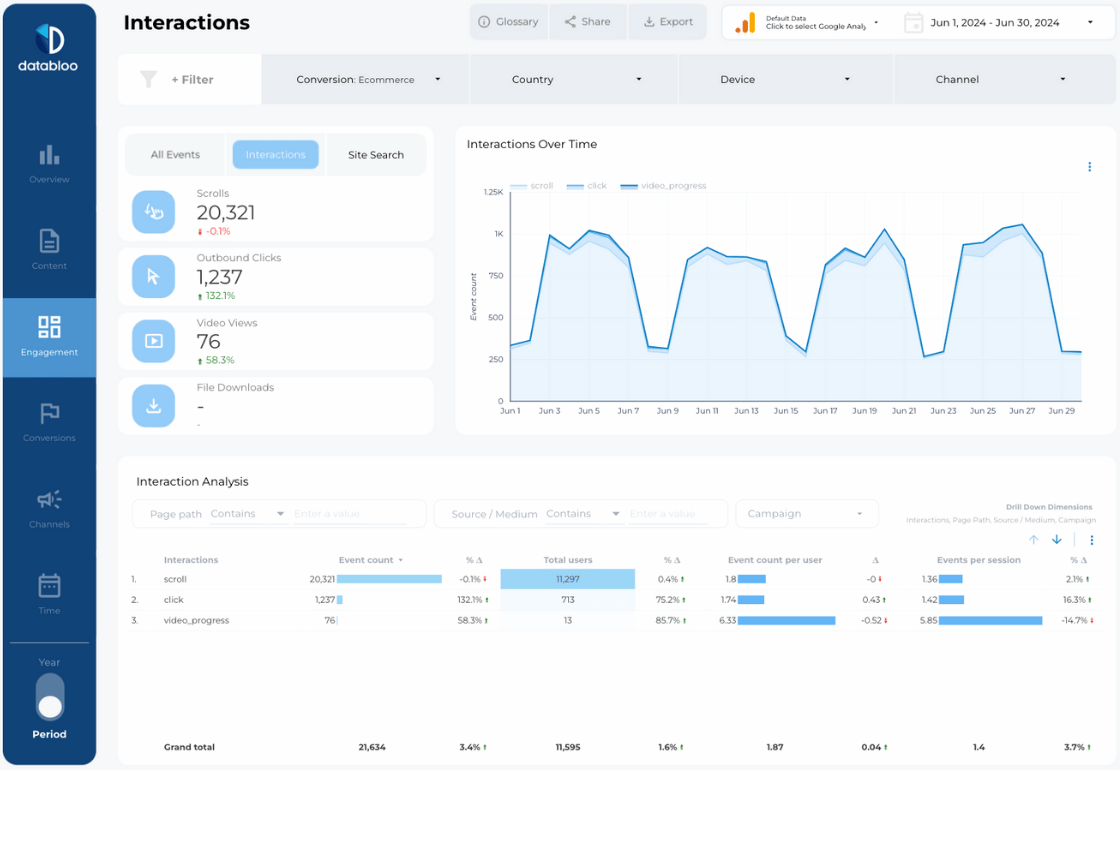
User Behavior
Where are users spending the most time on our site?
What’s the most common exit page on our website?
Which on-site action precedes most conversions?
What content type has the highest engagement rate?
What pages visitors interact the most with?
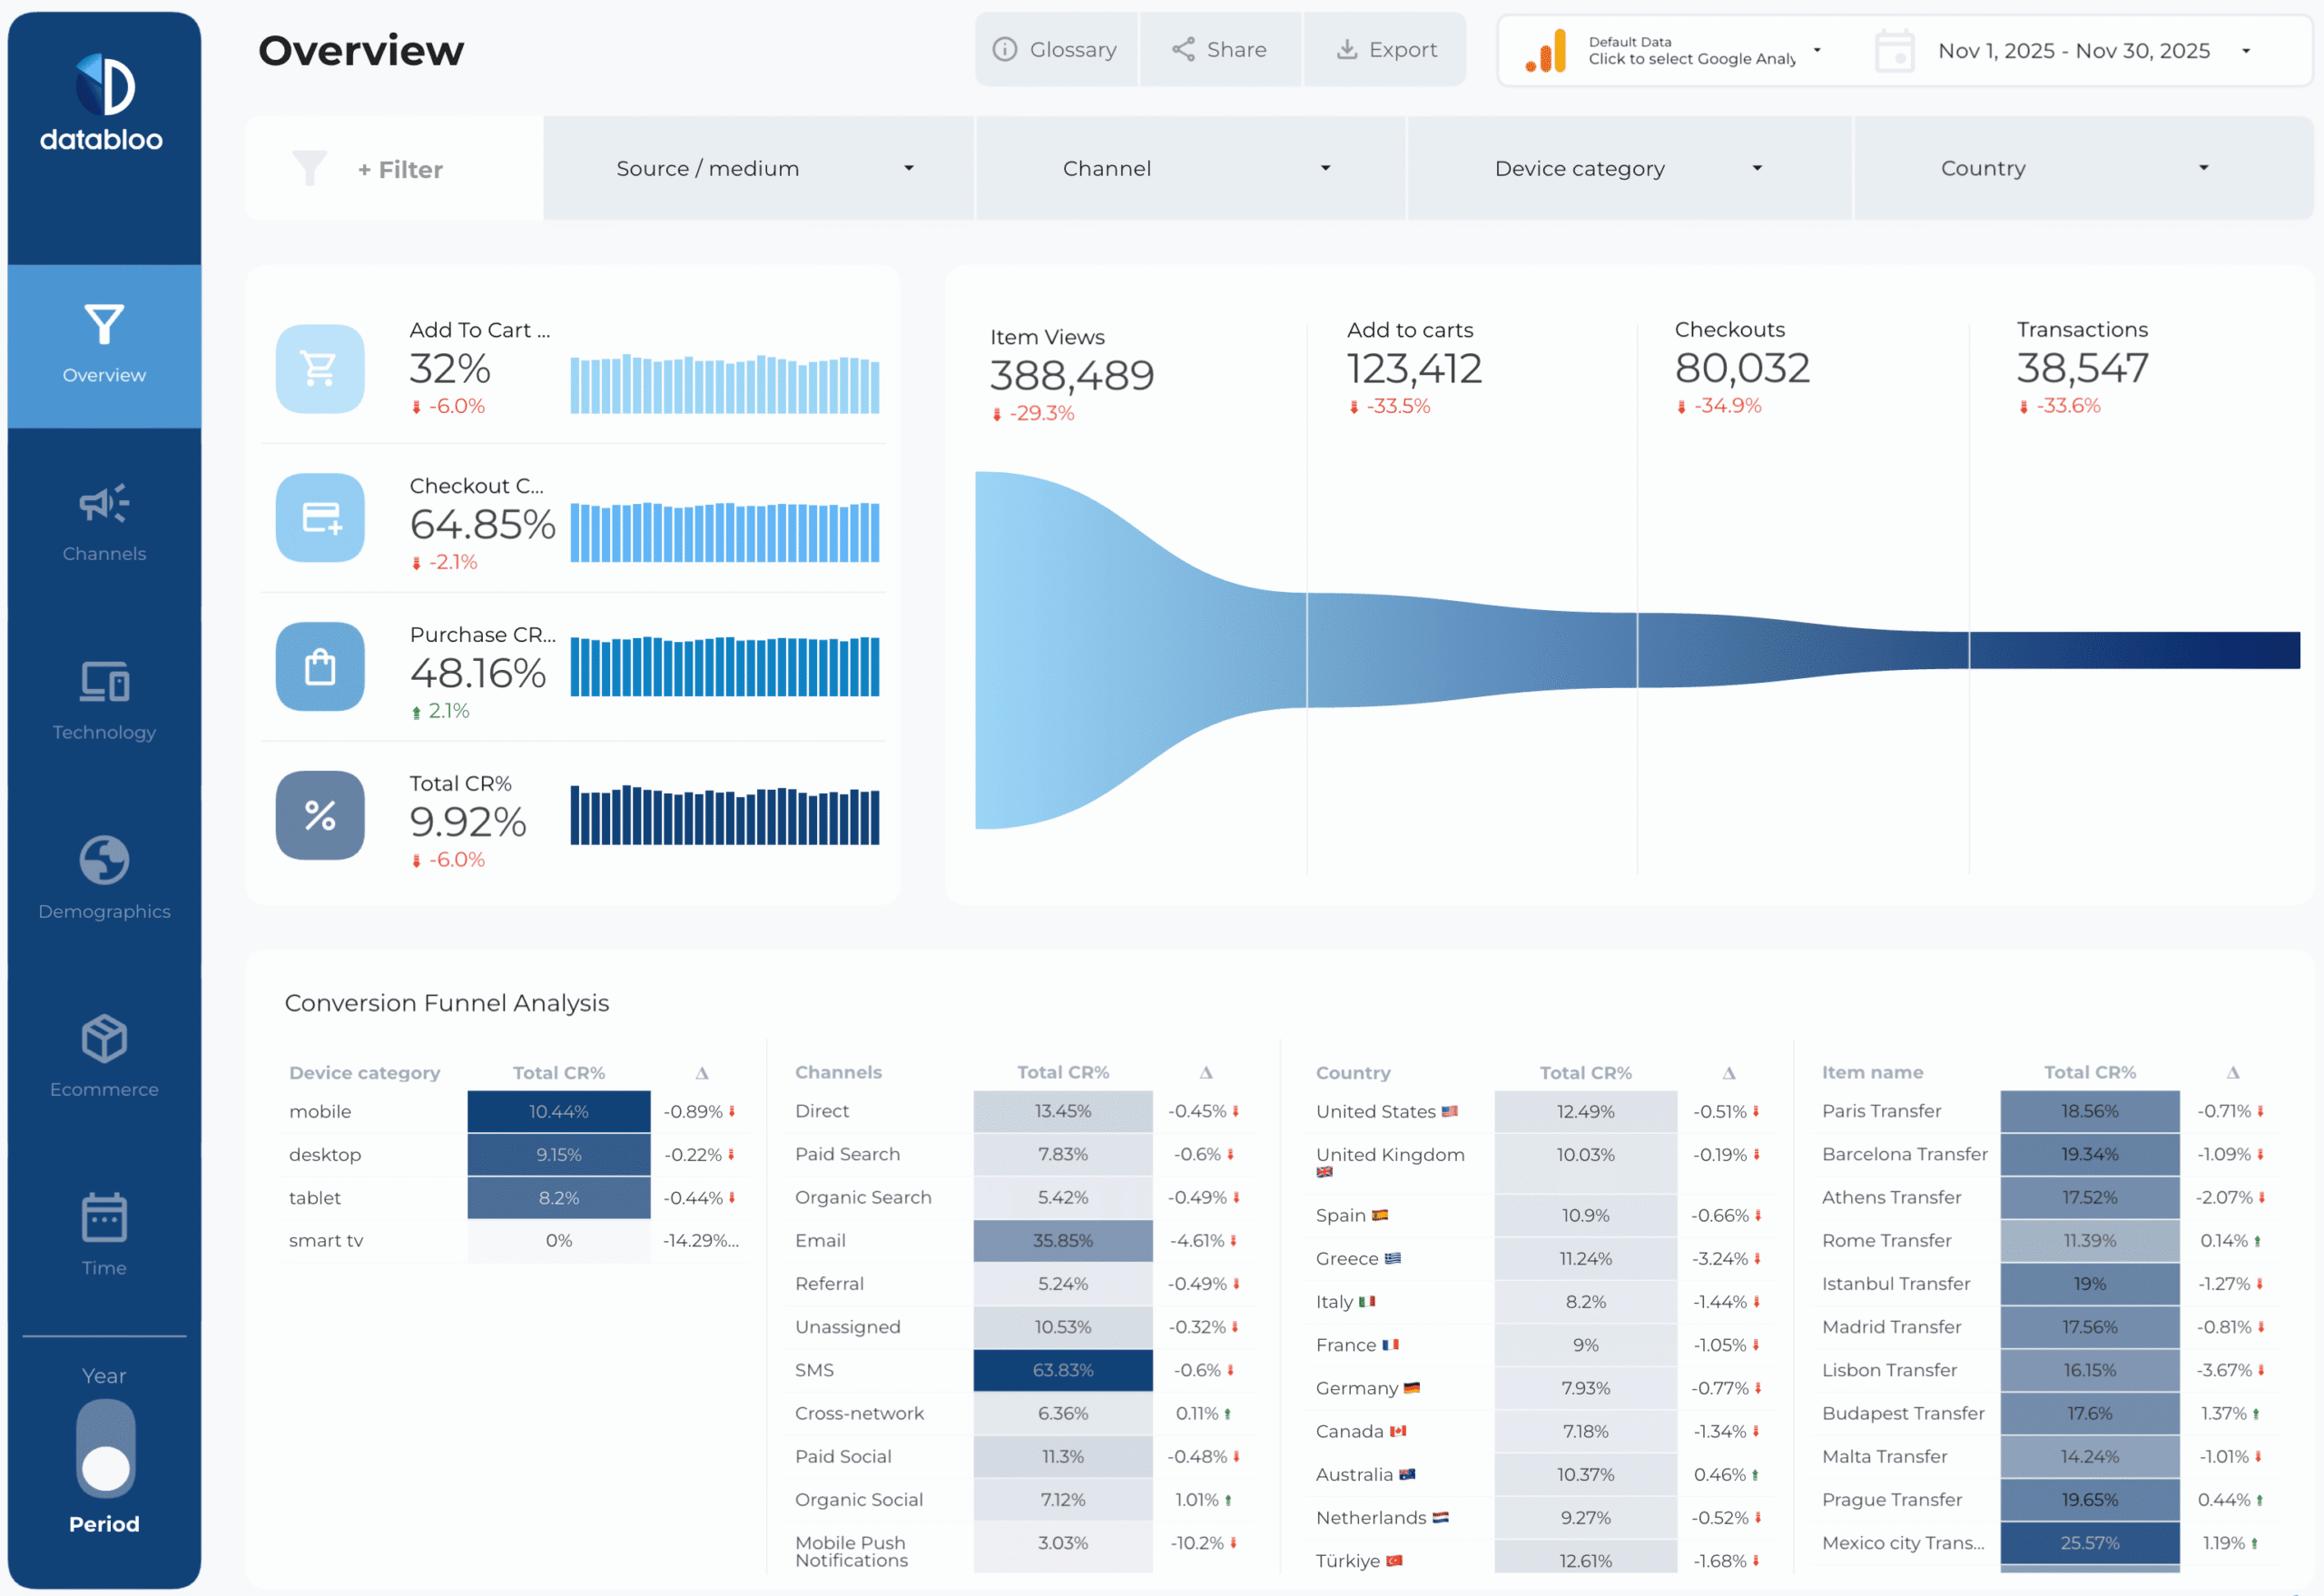
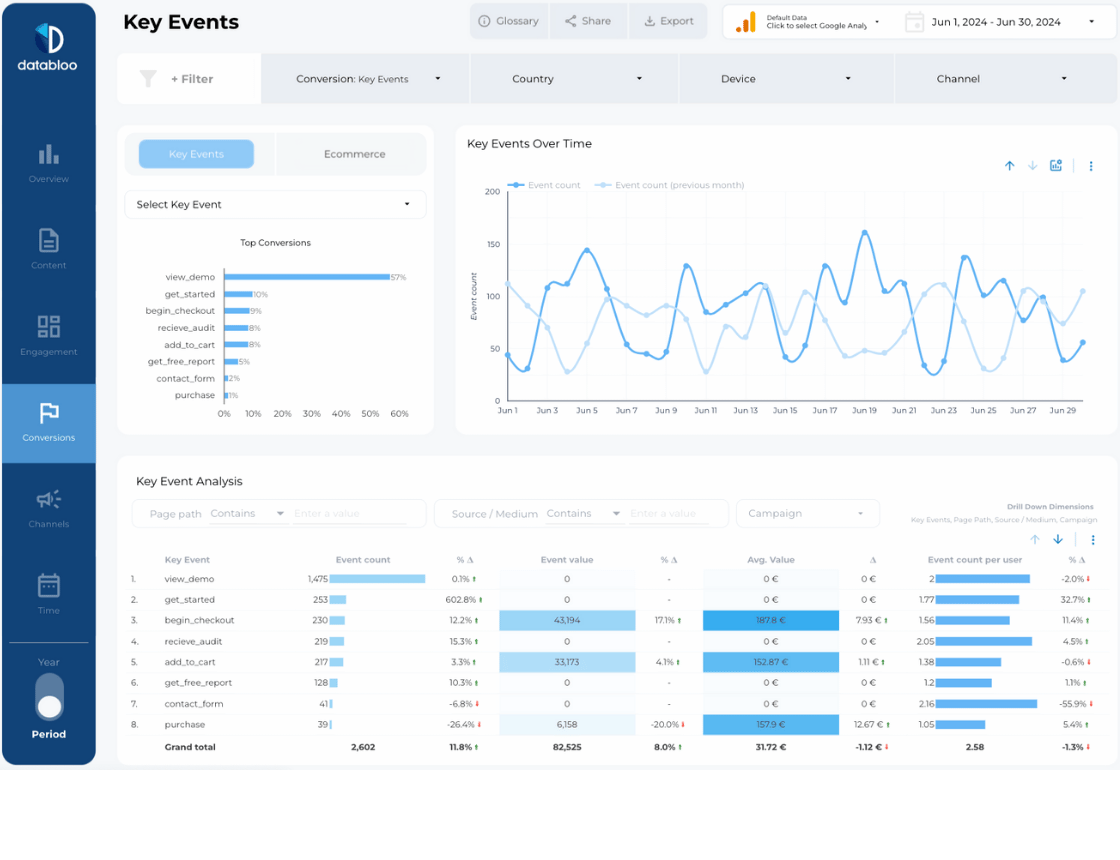
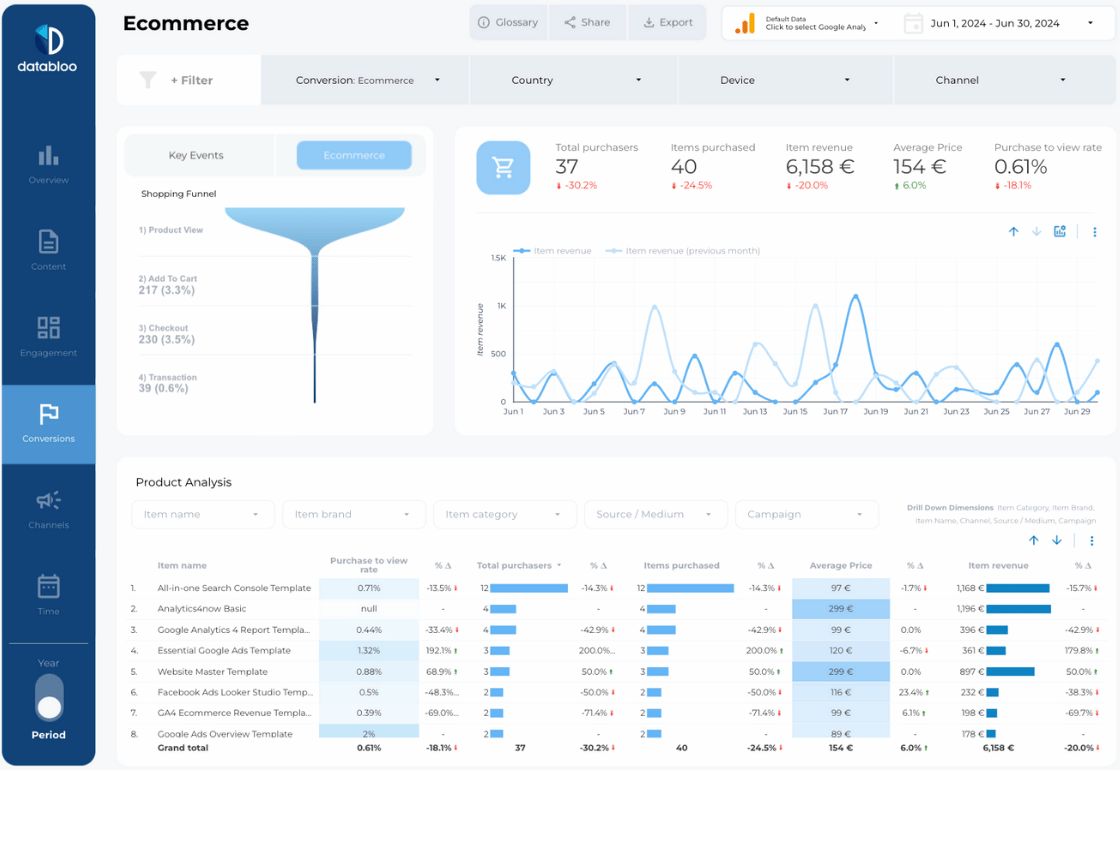
Conversions
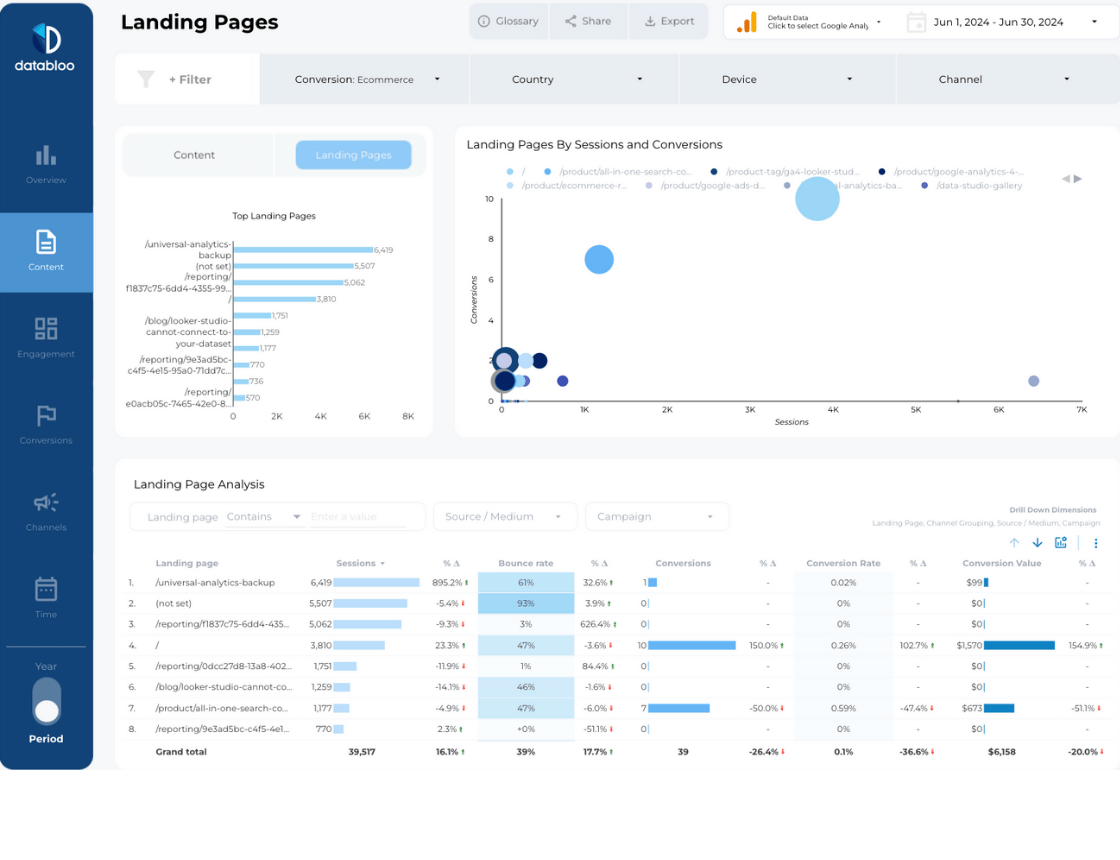
What page has the highest conversion rate?
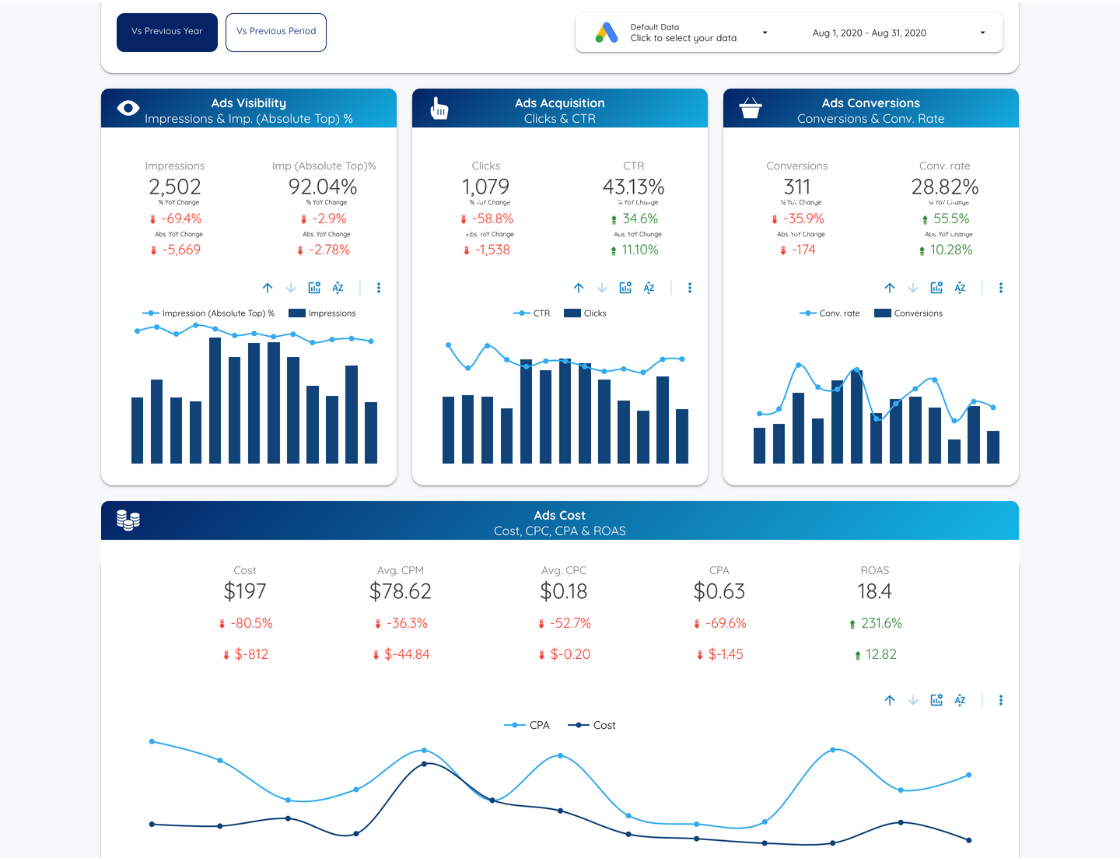
How do conversion rates from paid vs. organic search compare?
Is there a shift in conversion sources from last month?
What are top selling categories and brands? (optional product section of a template)
How many organic search visitors drop off at checkout?
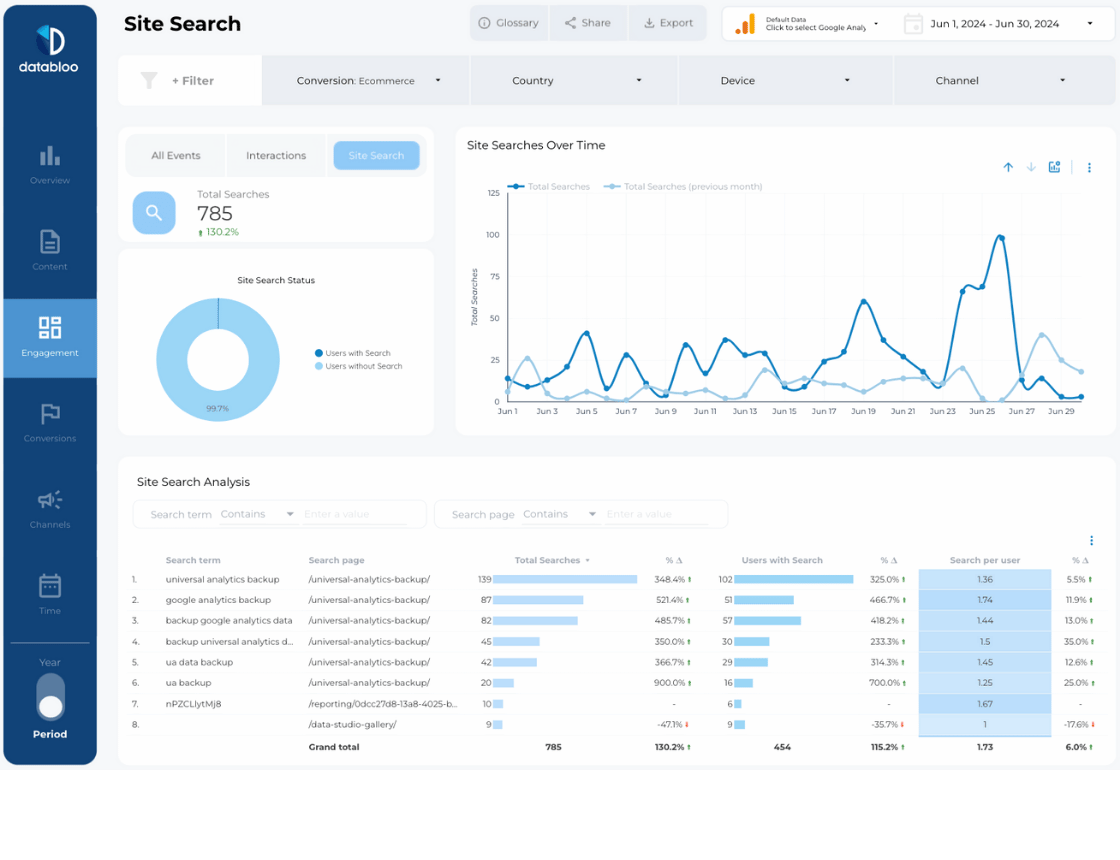
Advanced Insights
How do individual page performances correlate with conversion rates?
What product has rising interest based on search trends?
Which service page has the potential for increased conversions next quarter?
Is there a conversion discrepancy between desktop and mobile users?
Which non-English-speaking region shows unexpected conversion growth?
Common Use Cases For The GA4 Report
Need to highlight features of this template/report – product / content gap explained
Spot Website Traffic Patterns
Easily and intuitively monitor and analyze website traffic trends. By observing sudden increases or decreases in traffic, you can quickly respond to changes in user behavior or market trends.
Identify gaps by understanding which content or products are not performing well, leading to a drop in traffic. Conversely, surges in traffic to specific content or products can indicate what your audience finds valuable, allowing you to replicate this success in other areas.
Boost Local SEO Performance
Track which pages are most effective at attracting local customers and driving conversions is crucial for businesses targeting specific geographic areas. This aspect of the report helps in optimizing local SEO strategies.
Analyzing the performance of different pages from a local SEO perspective can reveal which local content or products might be missing or underperforming. Make targeted improvements, such as creating content that addresses local interests or optimizing product pages for local search terms.
Reinvent Ecommerce KPIs
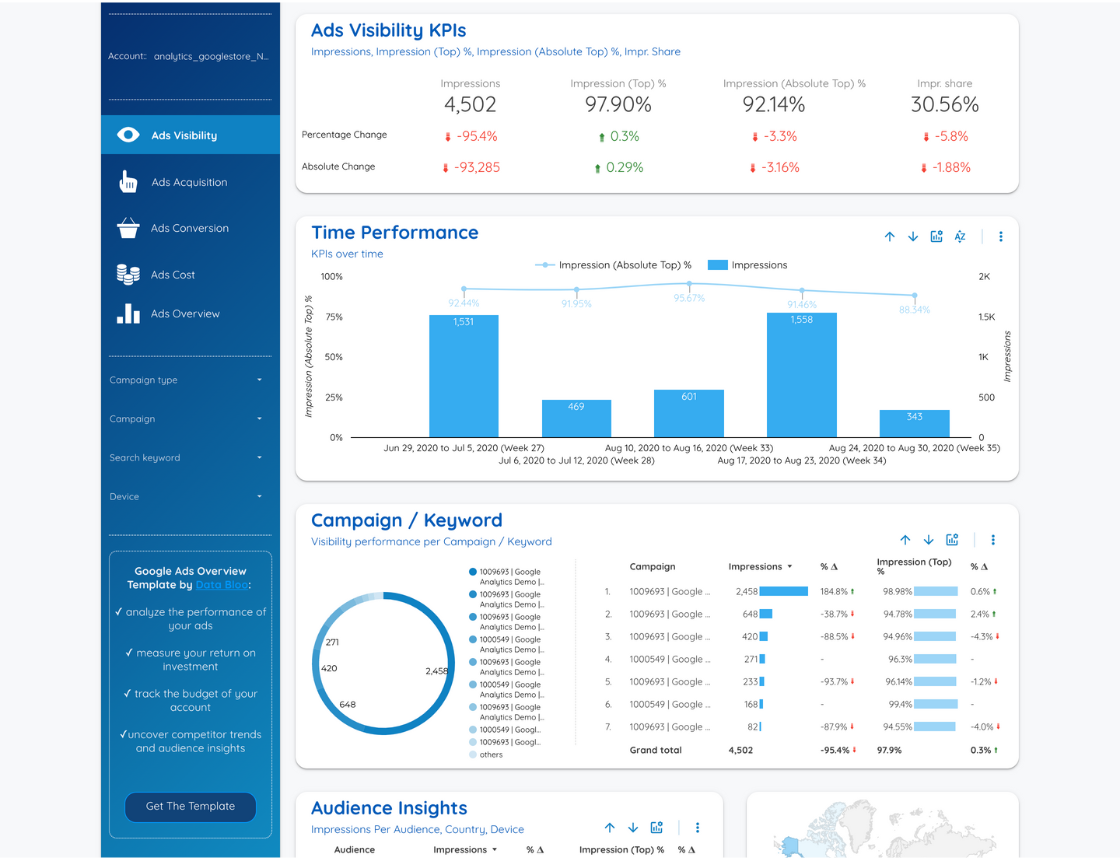
Gain detailed insights into ecommerce performance, focusing on top-selling products, their visibility in organic search results, and the conversion rates of different pages and keywords. This comprehensive view helps in fine-tuning product offerings and marketing strategies.
Understanding which keywords and pages have the highest and lowest conversion rates allows you to adjust your content and SEO strategies to better meet the needs of your target audience, potentially highlighting areas where additional products or content could fill existing gaps.
Benefits of GA4 Report
Get the most out of your data with our Data Studio Template for GA4. This report enables you to:
- Effortlessly create multiple versions versions with a quick setup. Setup time less than a minute for one new account.
- Easily download raw data from charts for deeper analysis in Google spreadsheets.
- Share with your team and various stakeholders for insightful performance monitoring.
- Customize the report’s design and aesthetic to align with your brand. With full edit access you can build your own branded version by changing the theme and layout settings.