


What Questions Will Keyword Ranking Report Help Answer?
Our SEO keyword report provides you with critical business information about how your content keywords rank over time. It answers questions such as:
- What are my Top 3, Top 10, and Top 20 performing keywords?
- What keywords drive the most organic traffic to my website?
- How do my generic keywords measure up against my brand keywords?
- Are my short tall keywords performing better than my long tall keywords?
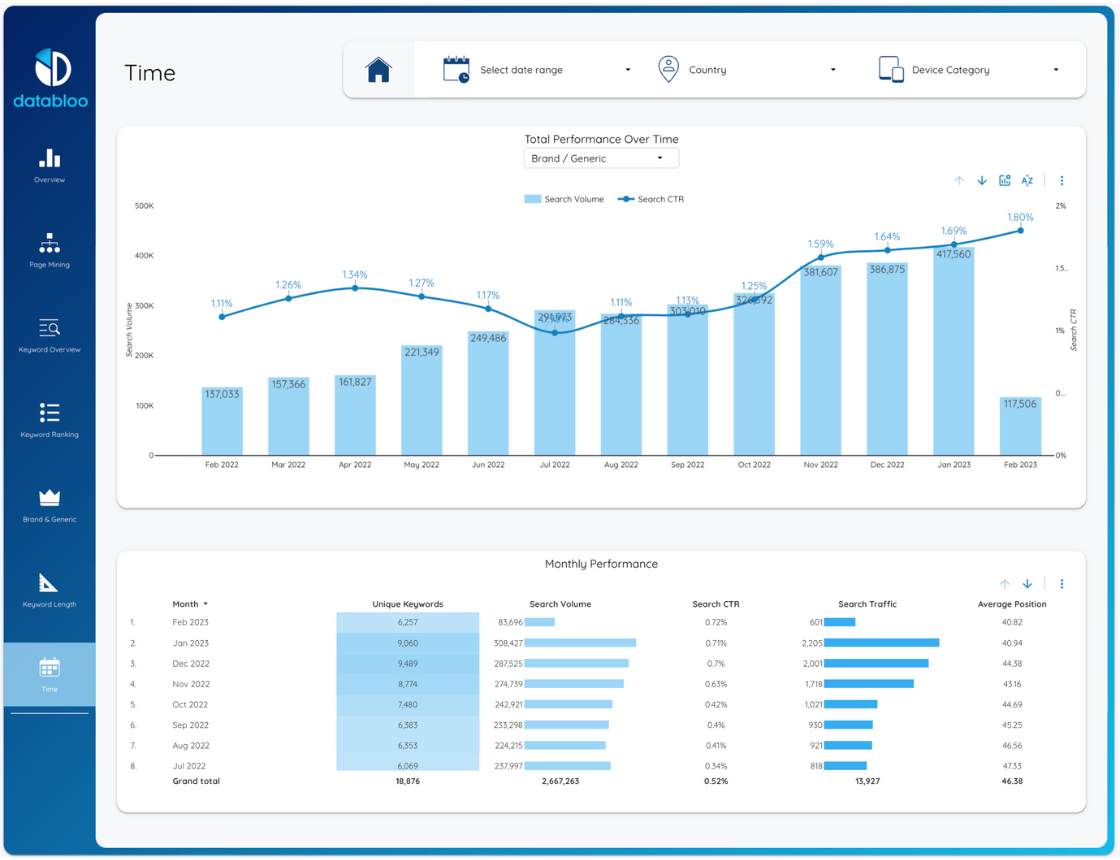
- How do my keyword rankings fluctuate over time?
- Are there any keywords with a high search volume that I am not currently ranking for?
- What is the trend in search volume for my target keywords in a given period?
- How has my website’s visibility on Google changed over time?
- What are the top-performing keywords in specific countries or regions?
- Is my keyword data affected by different devices?
Our keyword research template is designed to make sense of complex data, letting you capitalize on new content opportunities while retaining keywords that work.
How to Use This Keyword Ranking Template
The template includes several tabs, each helps you understand your keyword performance from different perspectives for more unique insights.
You can quickly select between tabs to quickly switch between high-level overview of your SEO performance or advanced analytics about the performance of specific keywords in specific circumstances.
To mine even deeper insights, you can use filters that allow you to segment performance data and focus on specific groups of keywords, geography, devices, and many more.
What This Keyword Ranking Report Template Shows
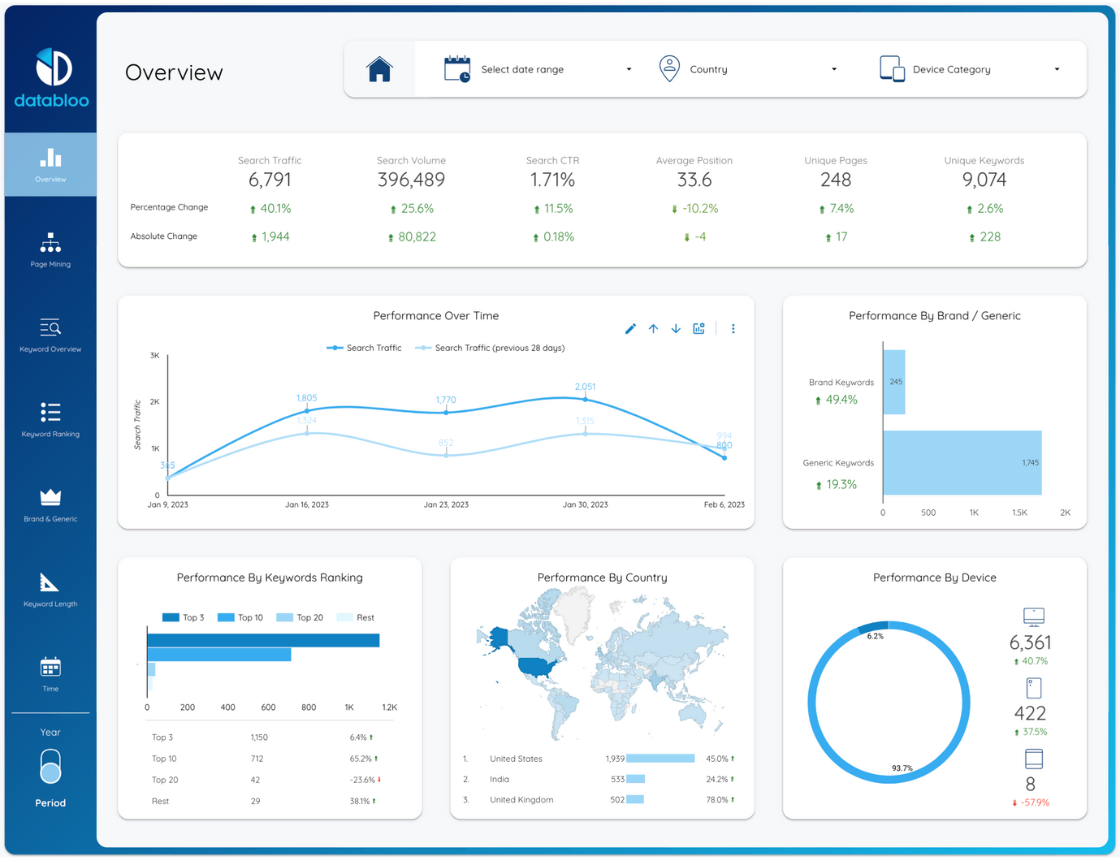
Overview
SEO reports traditionally start with high-level overview, and this first tab is ideal to understand your overall SEO performance without confusing yourself with too much data.
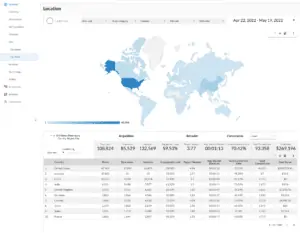
The tab provides visual data for search performance, brand vs organic performance, and performance by keywords, country, and specific device.
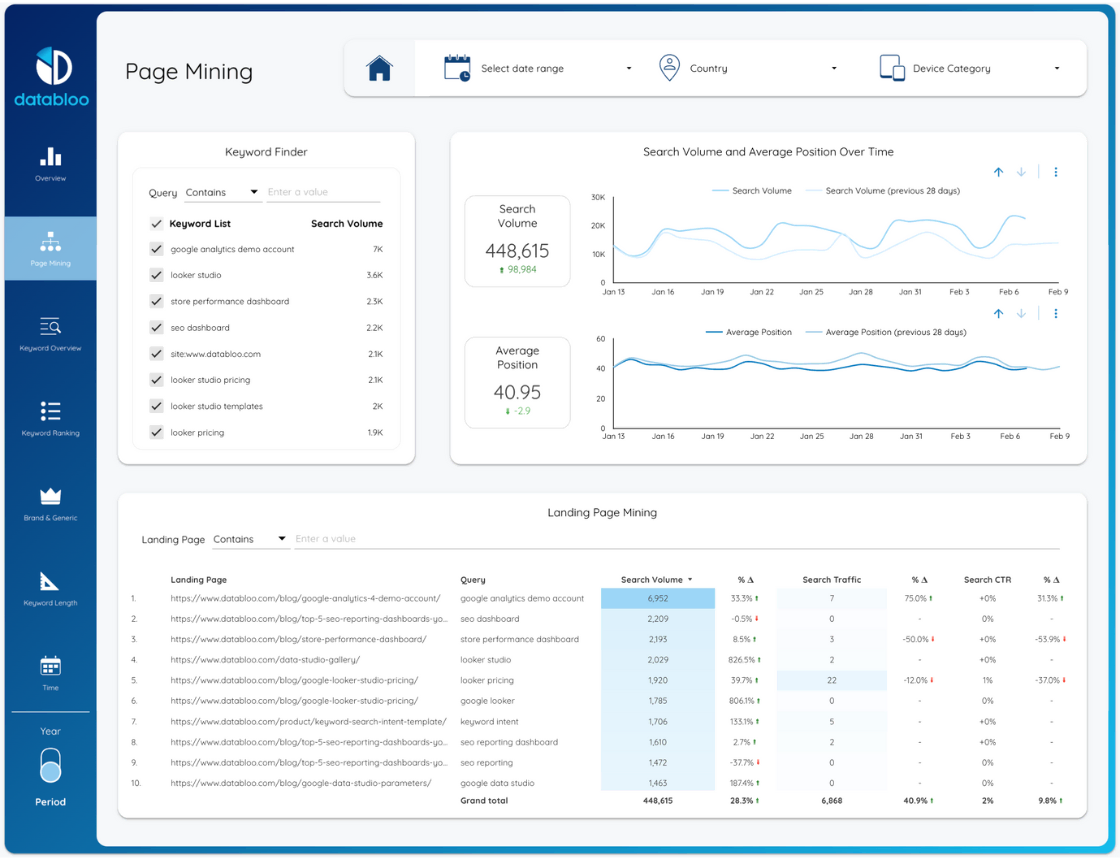
Page Mining
Page Mining tab is a deeper dive into performance of specific keywords and groups of keywords.
Use filters to pick specific keywords and the tab will show you search volume and average position over time.
Additionally, the keyword ranking template will show landing pages that rank for selected keywords and changes in their CTR, search volume, and search traffic over time.
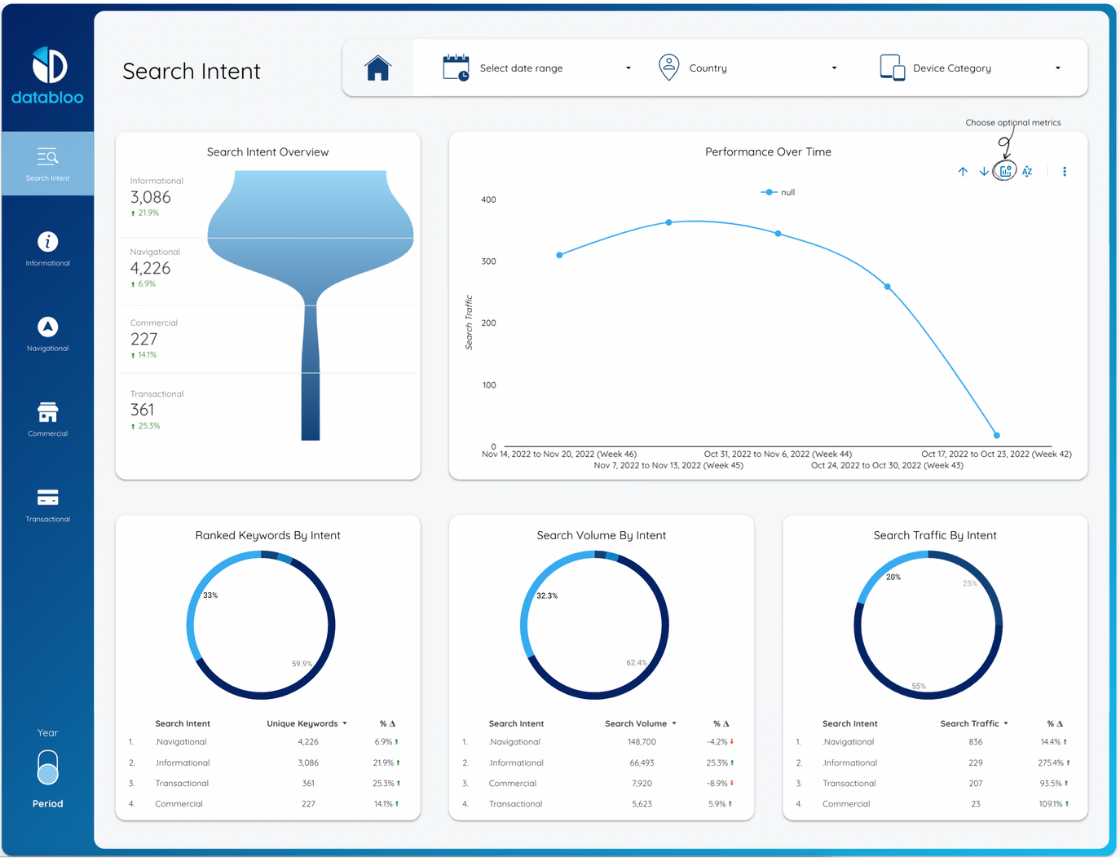
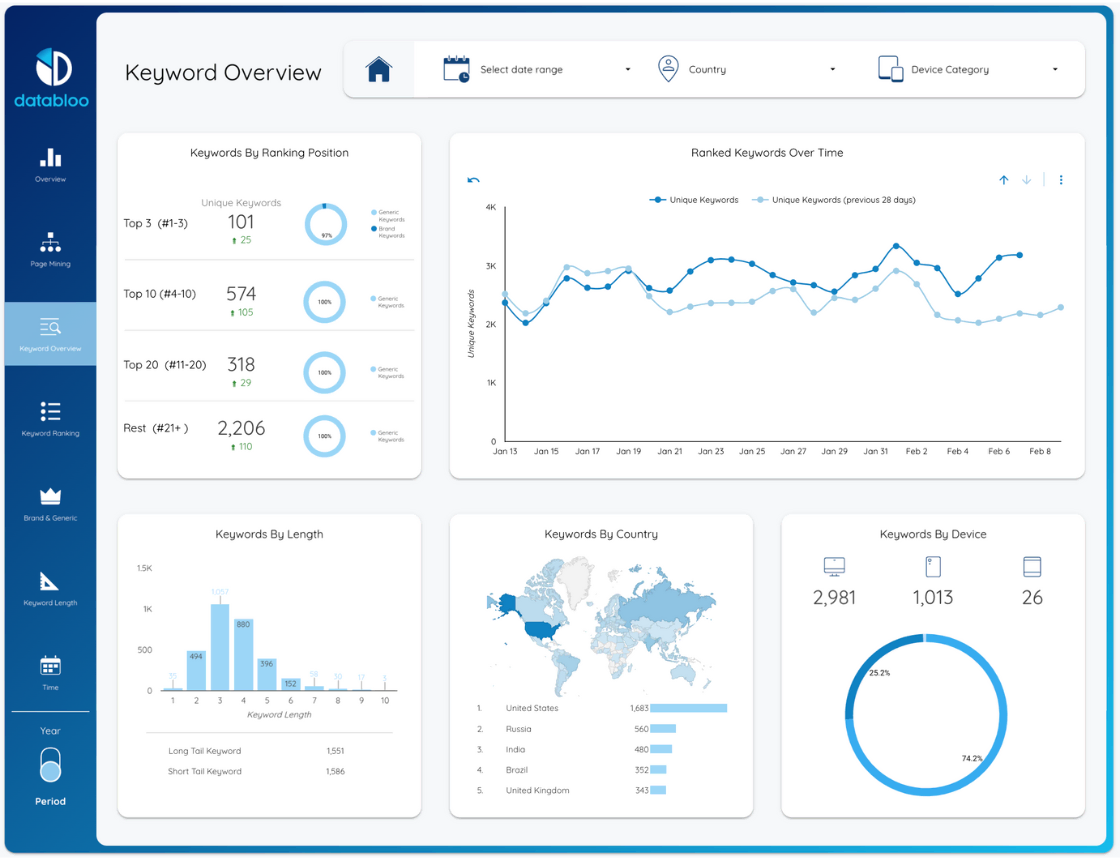
Keyword Overview
This overview tab is a deeper dive into keyword performance data.
Visual data is structured to let you quickly see how many unique keywords you started ranking for along with your presence in Google changed in that time period.
For example, you might notice that a huge group of keywords started ranking on the first page of Google and notice how that data correlated with increase in traffic from a specific country.
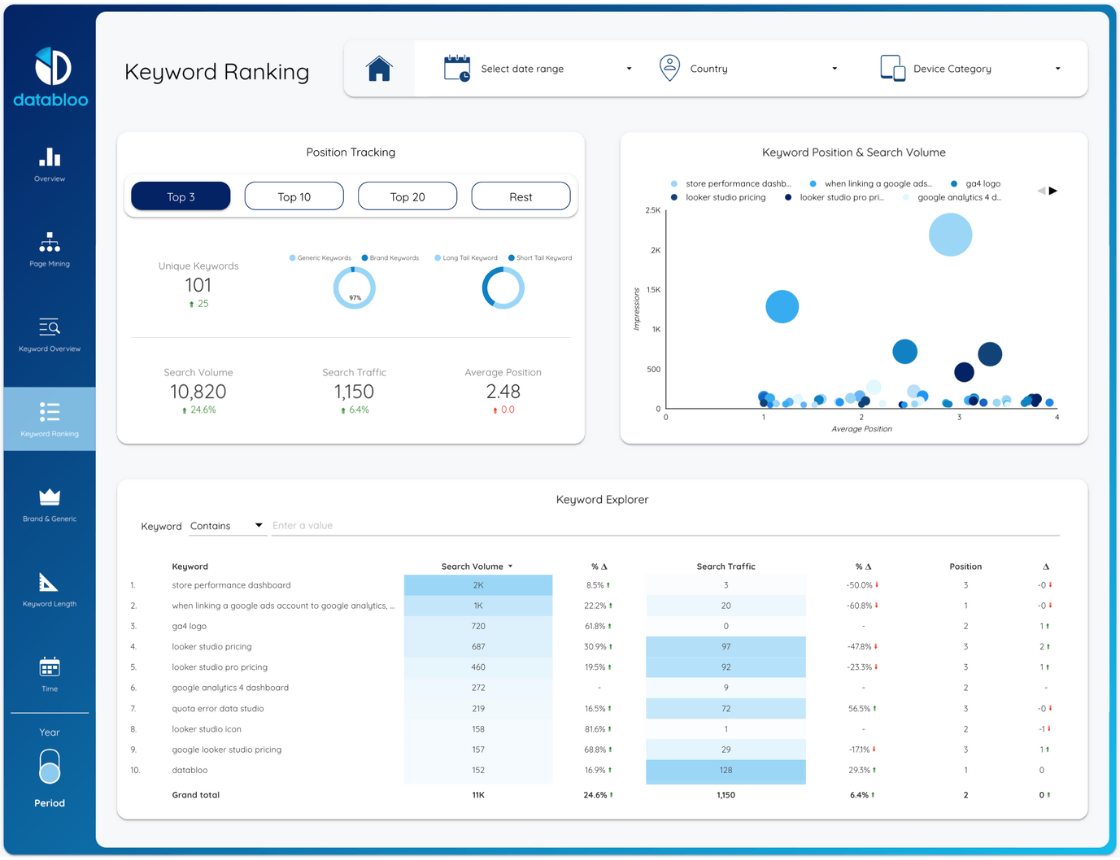
Keyword Ranking
Use the Keyword Ranking tab to understand your presence in the search results page (SERP).
See your top 3, top 10, top 20 groups of keywords and analyze performance of specific queries in the Keyword Explorer section.
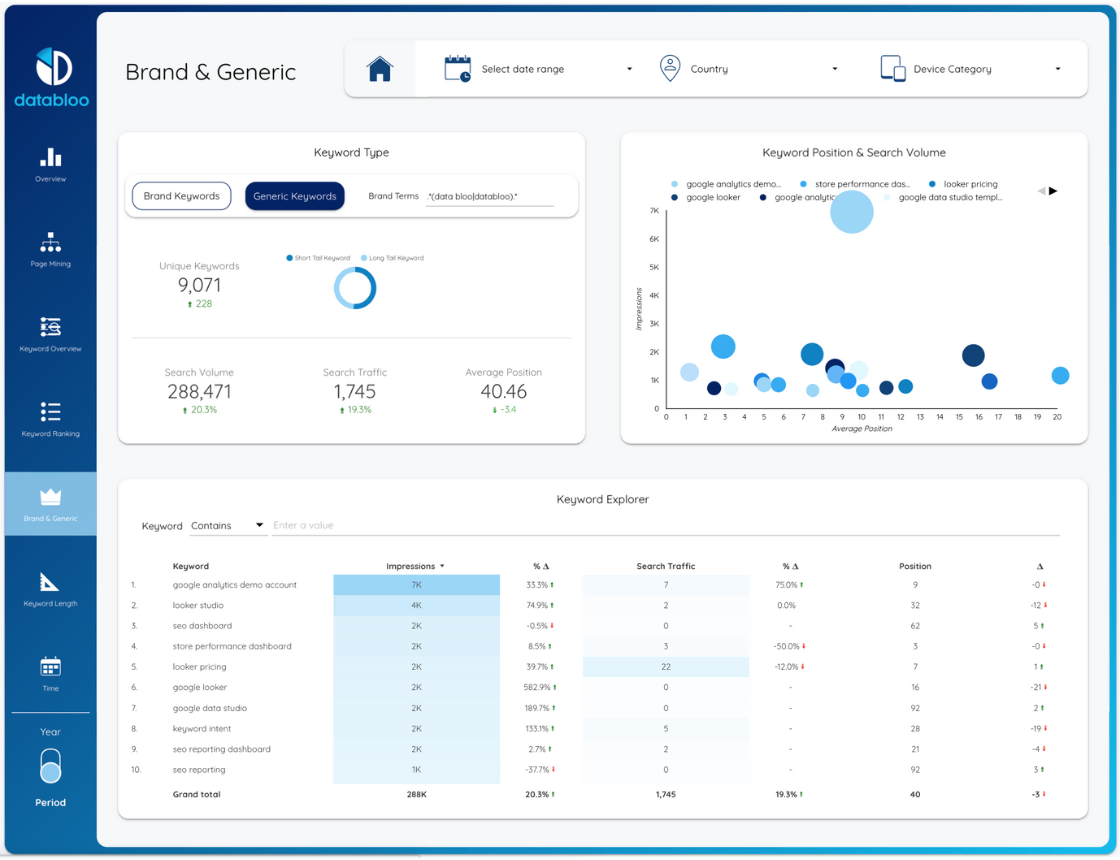
Brand & Generic
Brand & Generic tab in our keyword ranking template will provide a report on how your brand performs in SERP.
See how often people search for your brand directly over time, and any associated queries that people use to find your brand or your specific products.
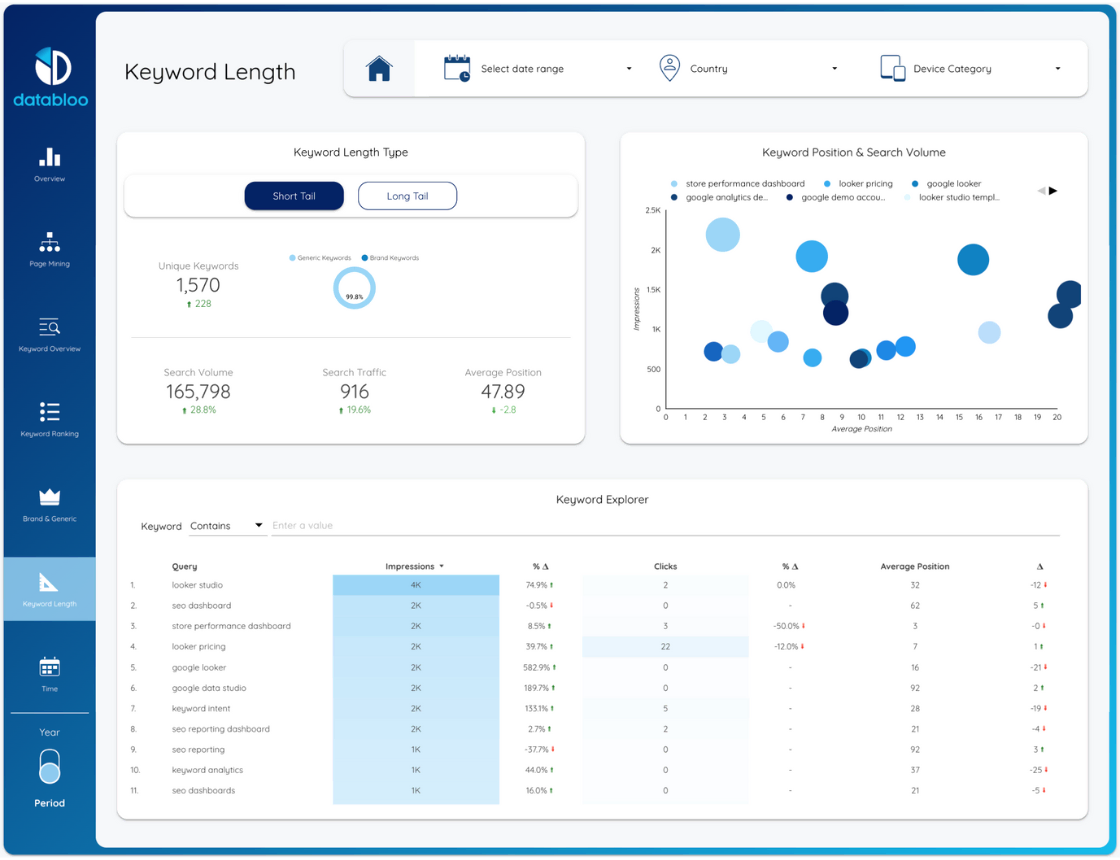
Keyword Length
Use keyword length data for deep analysis of your short tail and long tail keywords.
For example, if you notice that long tail keywords generate more search volume while short tail keywords are underperforming, refocus your attention on more competitive queries.
Benefits of This Keyword Ranking Report
Our SEO template for keyword ranking will help you:
- Quickly switch between high-level data and granular views to mine specific insights for your SEO marketing
- Present data in an intuitive visual way so it can be easily shared with stakeholders and clients
- Receive regular updates from Data Studio in your email
- Work with your data directly without sharing it with third parties