Description
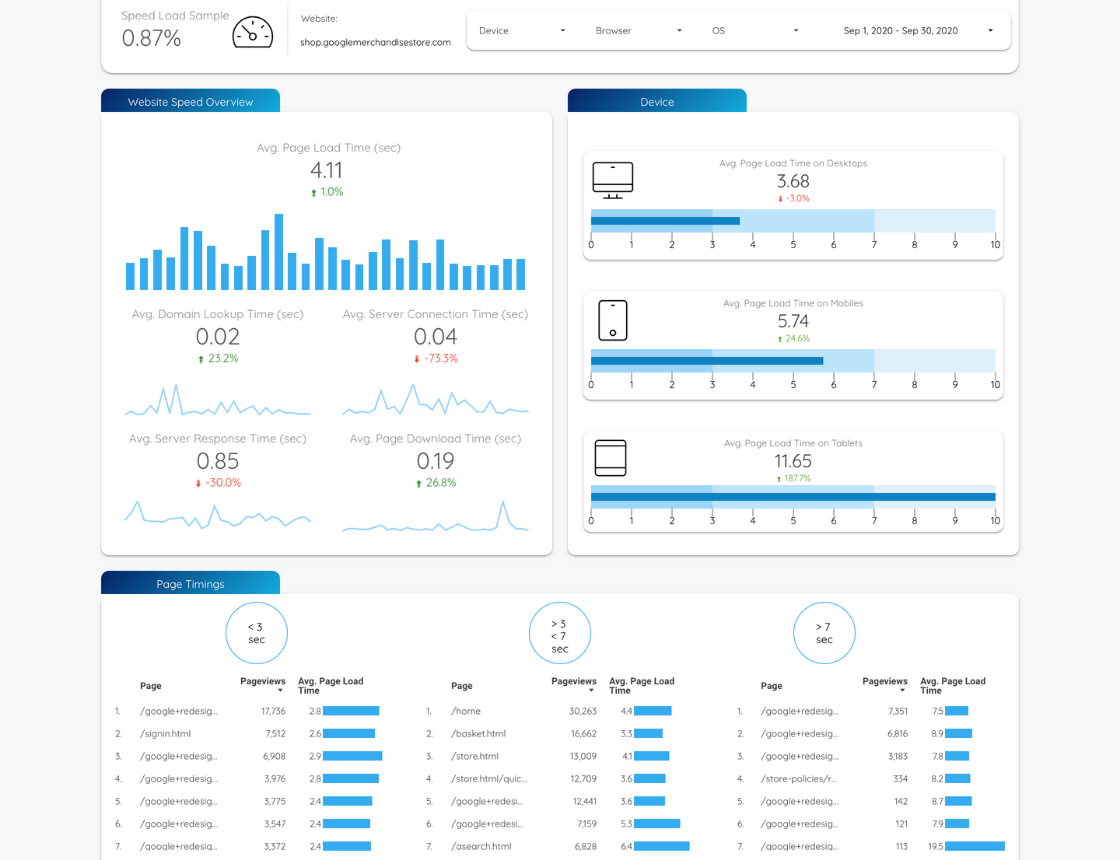
Enhancing Website Performance with Site Speed Performance Insights
The template will help you answer questions such as:
- What are the pages with the fastest load times (less than 3 seconds)?
- Which browsers have slower load times?
- How has my site speed performance changed over time on different devices?
- In which countries do we have the most speed performance issues?
- How is the load time of my website affecting visitor behavior metrics such as bounce rate and average session duration?
- How many potential customers are being lost because of slow page loading?
- Are there any specific times of the day or days of the week when site speed performance is worse?
- Do I need to consider more use of technologies such as content delivery networks (CDNs) or static web pages to improve site performance?
Template Layout
The user interface features a ribbon displaying your website’s name and controls that allow the selection of device type, data view, and date range. The report includes eight different sections:
- Website Speed Overview: This section presents all the speed KPIs such as average values for page load time, domain lookup time, server connection time, server response time, and page download time over the selected period, along with the percentage increase or decrease compared to the previous period.
- Device: It shows the average page load times for desktop, mobile, and tablet devices. You can easily find out if there are any loading issues for a specific device.
- Page Timings: This part displays the average page load time and the number of page views for pages in three categories, according to load time: under 3 seconds, 3-7 seconds, and over 7 seconds. You can target slow-loading pages with many views for priority attention.
- Date & Time: The bar charts show the average page load time for each day of the week and each hour of the day. You can spot performance trends that are related to specific days & times.
- Browser & OS: The user can toggle between operating system and browser view. Individual metrics include page views and averages for page load time, domain lookup time, server connection time, server response time, and page download time. You can answer performance-related questions that are related to user’s technology.
- Geolocation: A world map is provided, and hovering over a country will display its average page load time. You can check if a new or different CDN be used to improve performance in a particular area.
- Visit Type: The average page load time is displayed according to device (tablet, desktop or mobile) and user type (new or returning visitor). These are split into bounced visits and non-bounced. You can identify loading issues based on user’s behavior.
- Monthly Performance: The last part includes the overall speed performance over months. You can choose optional metrics from several average values: page load time, domain lookup time, server connection time, server response time, or page download time.
What is Included?
The website speed dashboard is easily installed and customized and can be used on multiple domains. Easy-to-use instructions and video tutorials are provided. Please note that this template is only compatible with Universal Analytics, as the speed metrics are not available in Google Analytics 4.