Data source:

Youtube Channel Report

49

The Youtube Channel Report provides a high-level overview of your Youtube channel, including your subscriber’s growth and video content performance.

Description

Youtube Channel Performance Analytics and Insights

The Youtube Channel Report is a four-section analysis of your Youtube channel’s growth and engagement, providing valuable insights to help you optimize your content strategy. This report includes an overview of your channel’s performance, a detailed analysis of your subscribers, a breakdown of your video performance, and the performance over time.

Youtube Channel Overview

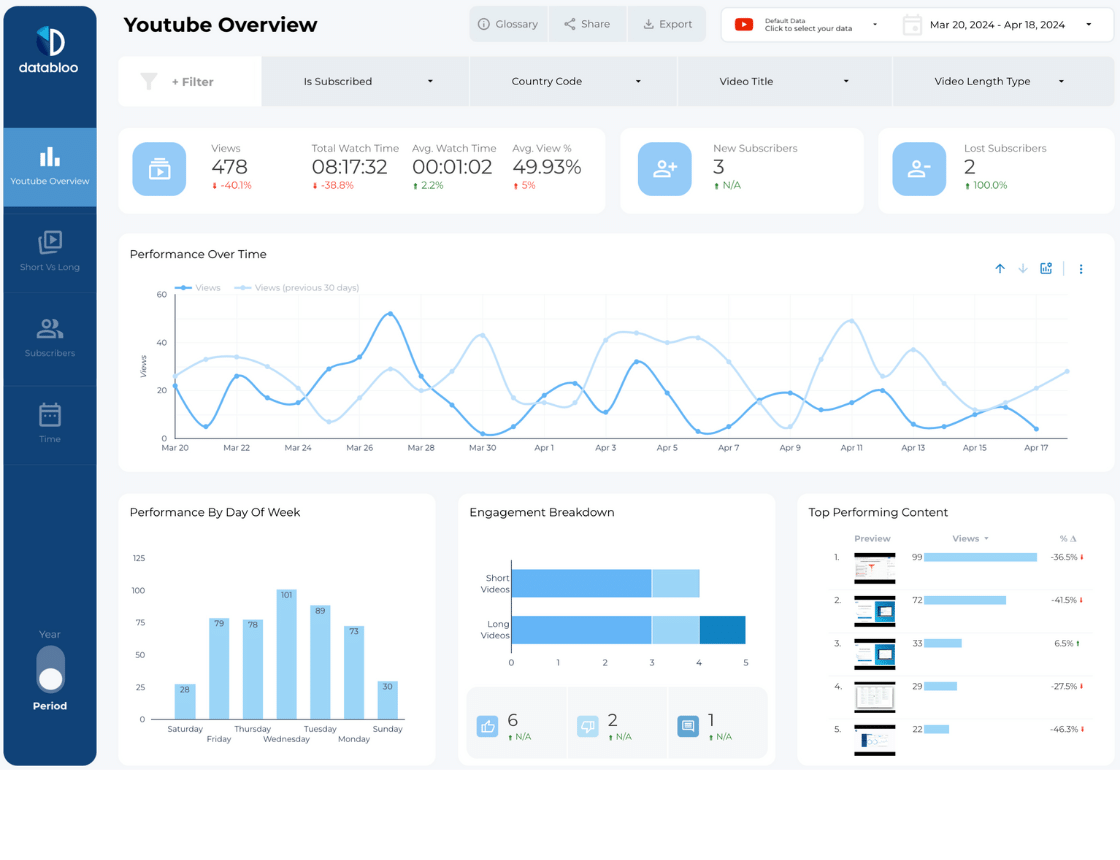
The first section of the Youtube channel report gives an overview of your video’s performance. The section’s data lets you monitor your channel’s growth and interaction rate. It includes

  • New subscribers count – Youtube users who subscribe to your channel
  • Lost subscribers – Youtube users who have unsubscribed from your channel
  • Key Performance Indicators (KPIs) – contains the number and percentage of views, total watch time, average percentage view, and average watch time. The report shows percentage declines and increases for each metric as well.
  • Audience engagement – the Youtube looker studio template also shows the number and percentage of shares, likes, and comments for all your Youtube videos and their decrease or increase rates.
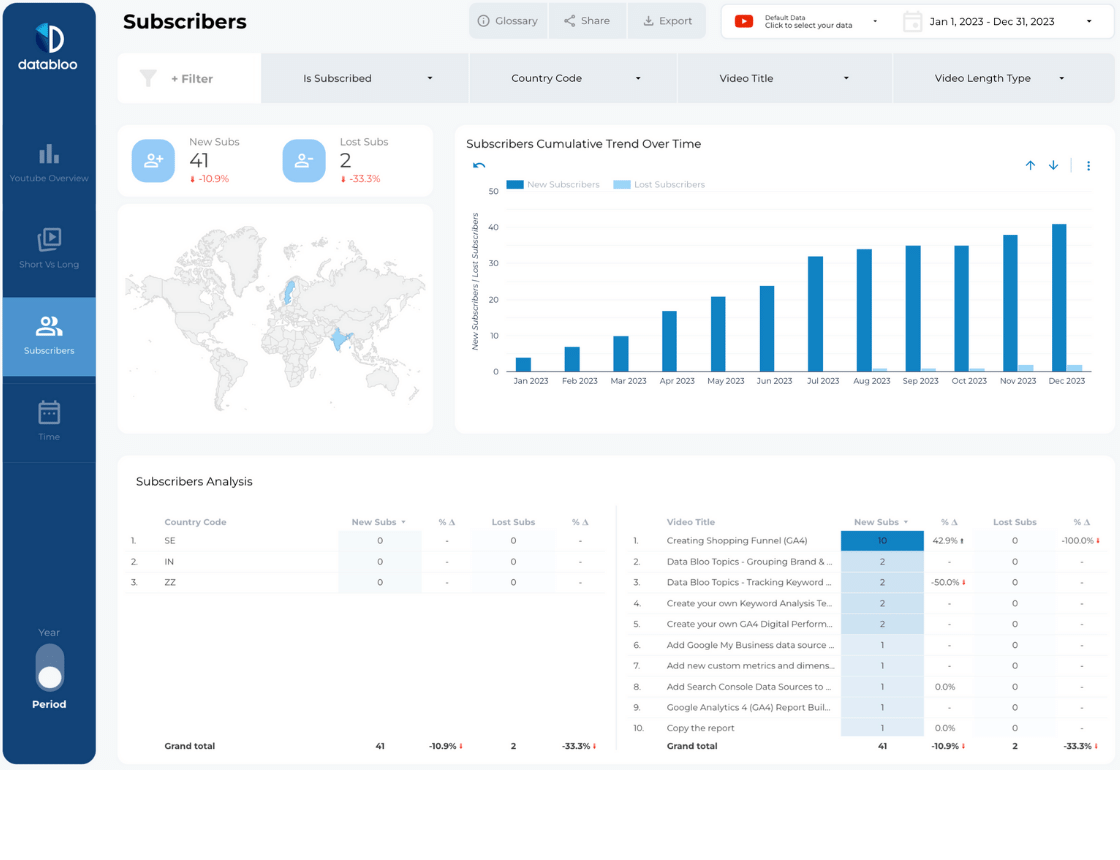
Subscribers

This part of the report provides an in-depth analysis of your subscribers. The key metric cards indicate

  • The number and percentages of new and lost subscribers per country or region
  • The geolocation of most of your subscribers
  • Your subscribers’ cumulative trend over time to track your channel’s growth

Videos

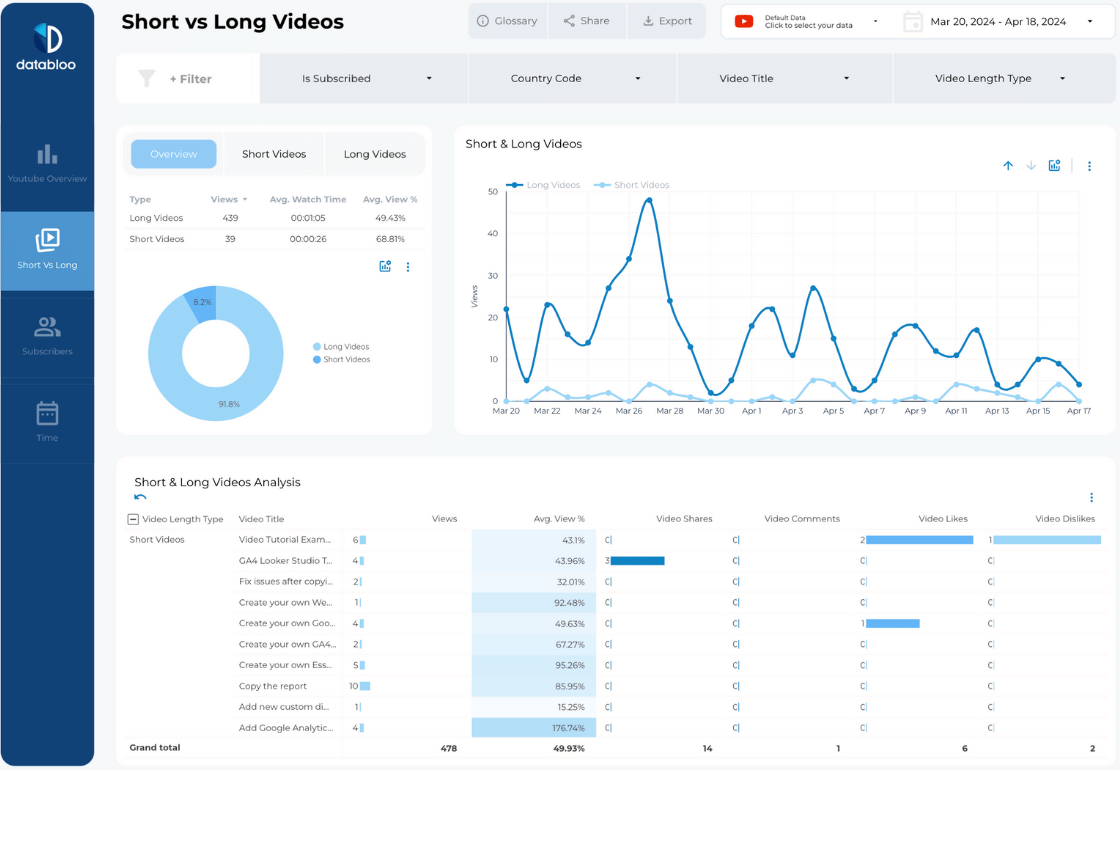
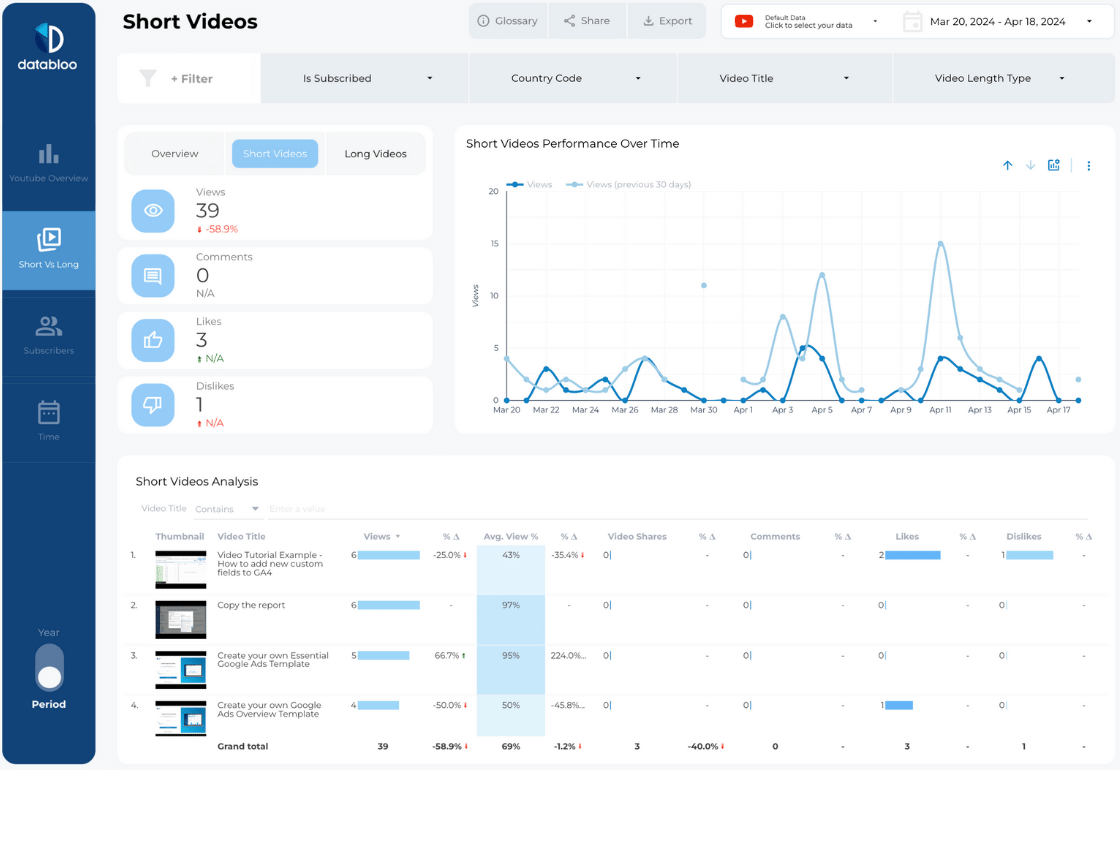
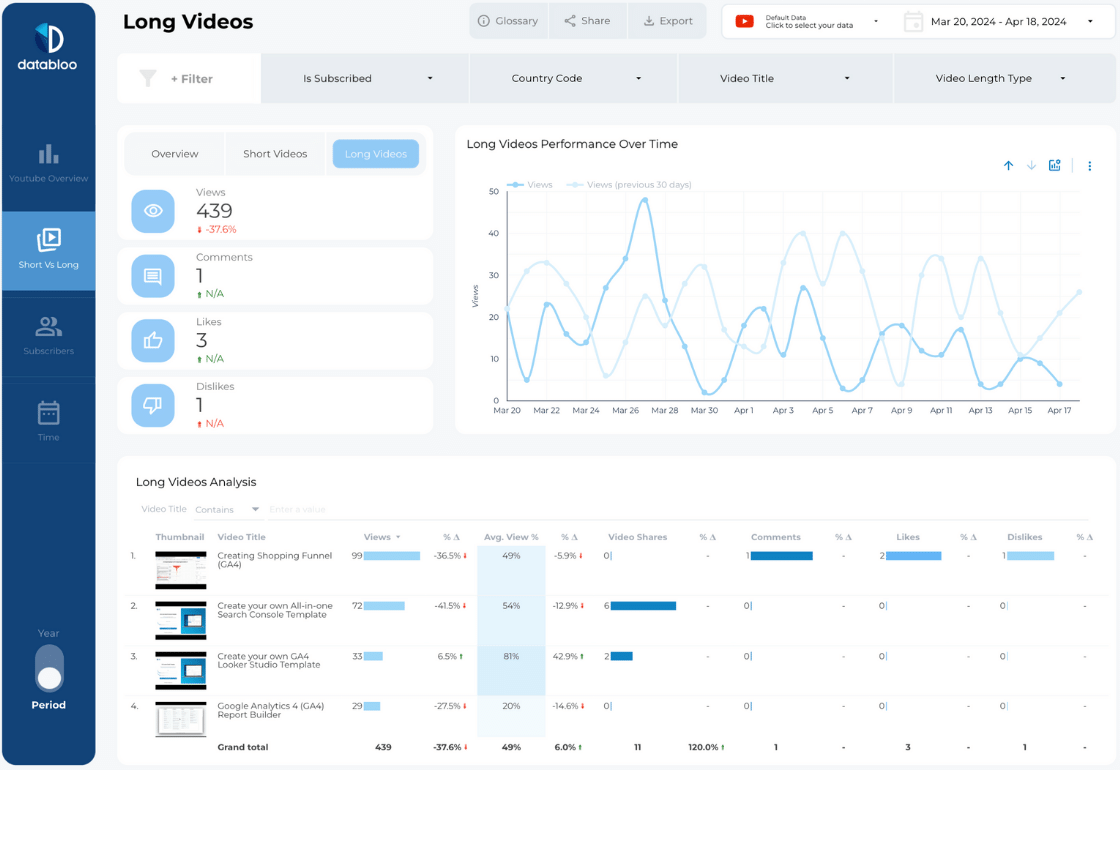
The Youtube channel report ranks video performance in two length categories – short or long videos to help you determine which size engages more your audience on Youtube. It also contains a graphical representation of your video’s watched data for a better visual of performance and easy comparison. The graph shows the average view percentages to help you monitor trends. You can analyze video data individually or as a group with the collective information in video explorer, which illustrates the average watch time, average view percentage, and video likes and shares.

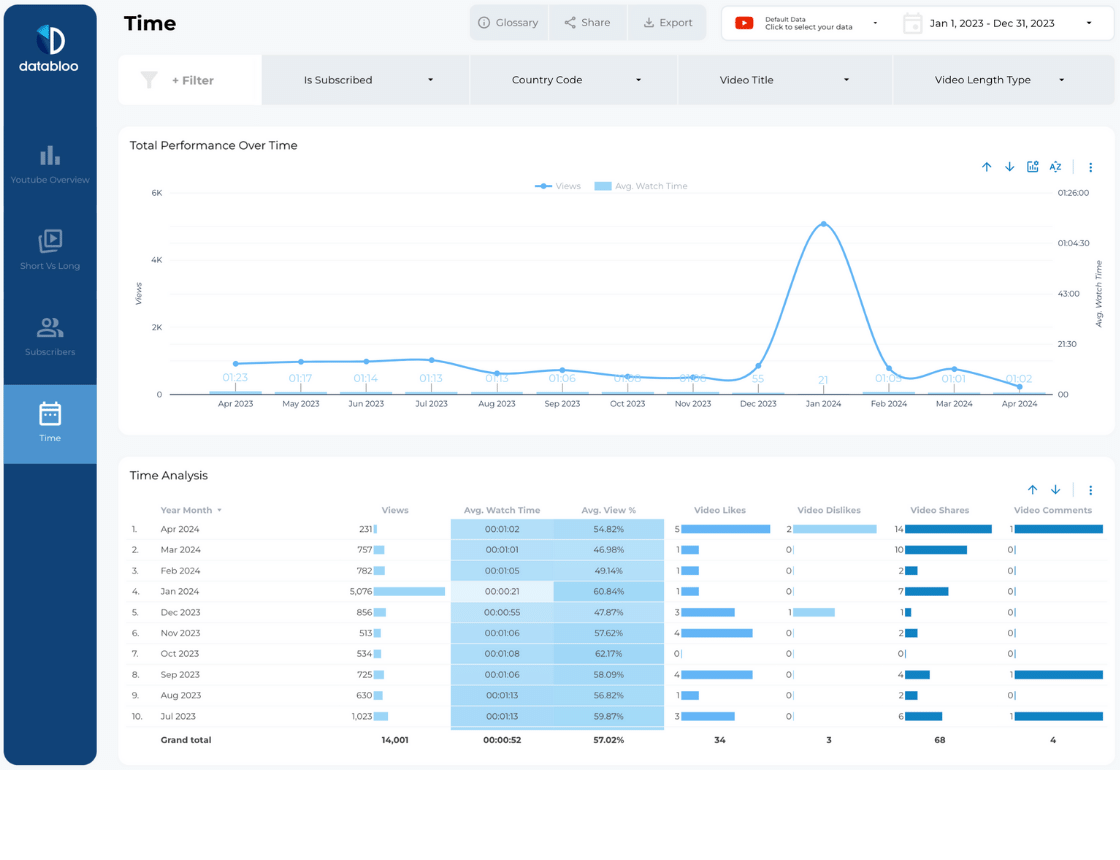
Performance Over Time

The last section of the Youtube Channel Report helps you track the performance of your videos over time. It shows statistical and graphical data for all your videos and their performance. The report makes it easy to compare results and spot performance trends for specific periods.

Why is the Youtube Channel Report Data Significant?

Your Youtube Channel data is essential for making informed decisions and optimizing your video content to grow better your community. It provides you with:

  • A better understanding of your target audience allows you to customize your content for them.
  • Metrics on your audience’s engagement including shares, likes, and comments which help in gauging your video’s performance and enable you to improve your videos.
  • Channel growth patterns to monitor the growth of your page over time (new and lost subscribers over time and geographically)

Why Should I Get the Youtube Channel Report?

The Youtube channel report provides data about your Youtube page performance in detail. You can use the information to grow your channel, know your audience, and provide the content they consume.

Is the Template Customizable?

You can customize the template to better match your reporting needs. For instance, you can change the aesthetics and colors of the report or add new widgets.

Additional information

Data Source

Youtube Analytics

Dashboard Type

Multi Page

Setup

Manual

Audience

Agency, Business Owner, Digital Marketeer

SKUYTB-SOM-01
Category
Tags, , , , ,

One Click Setup

One Click Setup is the ultimate time-saver for your reporting needs, enabling you to generate reports quickly and easily with just a few clicks, saving you valuable time and streamlining the configuration process.

Get started in minutes

Collect your data

Create your data sources and the required fields following our instructions.

Copy the template

Make a copy of our Looker Studio template.

Make the most out of your data

Being the owner of the new template and you can either modify it according to your needs or start using it immediately. Happy Dashboarding!

Frequently Asked Questions

Investing in our Looker Studio templates saves you the time and resources that are required to build a reporting solution from scratch. Our templates are designed by data & visualization experts who have spent +2 years building ready-to-use solutions for over 1,000 businesses globally. Additionally, our templates have been recognized as top-notch reports in the market, as they have been featured by Google on their official Looker Studio Gallery. With instant access to these templates, you can easily make the most of your data and grow your business faster.

You can get a comprehensive understanding of our Looker Studio templates through our live demos, where you can see all the capabilities and functionalities. Additionally, you can use the built-in data controls of Looker Studio for data sources such as Google Ads and Google Search Console to preview how your data will appear in our reports. Both options allow you to get a feel for our templates and make sure they are the right fit for your business.

Our Looker Studio templates are fully customizable to fit your business needs. By duplicating our templates, you are free to make changes to the aesthetics, data sources, visualizations, and layout, ensuring that the templates meet your brand guidelines and reporting requirements.

Yes, after purchasing a Looker Studio template, you have the flexibility to replicate it for multiple accounts, share it with others, and even schedule email deliveries. This allows you to effectively manage different clients, domains, or brands with just one report, making it a highly efficient solution for your reporting needs.

When you purchase a Looker Studio template, you receive a link with a comprehensive guide that provides step-by-step instructions and video tutorials on how to customize the report for your brand. This guide will give you a thorough understanding of the template’s setup, allowing you to get started quickly and easily. On top of that, our experienced support team is available to answer any questions you have after the sale.

Unfortunately, we do not offer refunds for our Looker Studio templates. As digital products, the templates can be easily copied once purchased, making it impossible for us to receive the product back. This is why we invest in technical support and comprehensive instructions to ensure our customers can fully utilize and make the most of their investment.

We use PayPal and Stripe to process payments. They accept Debit, Visa, Mastercard, and American Express. Your credit card information is not stored on our site. 

You cannot find your question?

Feel free to contact us