Top 10 Business Questions Answered by Our Template
Our WooCommerce Data Studio Template gives you a complete overview of your store’s sales, customer behavior, product performance, and more—all in a single, easy-to-use dashboard. Whether you’re running a fast-growing eCommerce business or just starting out, this report helps you understand what drives your revenue, what slows you down, and where to focus next. With clear charts, interactive filters, and real-time insights, it’s the easiest way to stay on top of your WooCommerce data without getting lost in spreadsheets. Our WooCommerce Data Studio Template helps you answer essential questions about your online store, giving you a clear picture of your performance and where to focus next. Whether you run a small shop or manage a growing eCommerce business, this report provides actionable insights without overwhelming you.
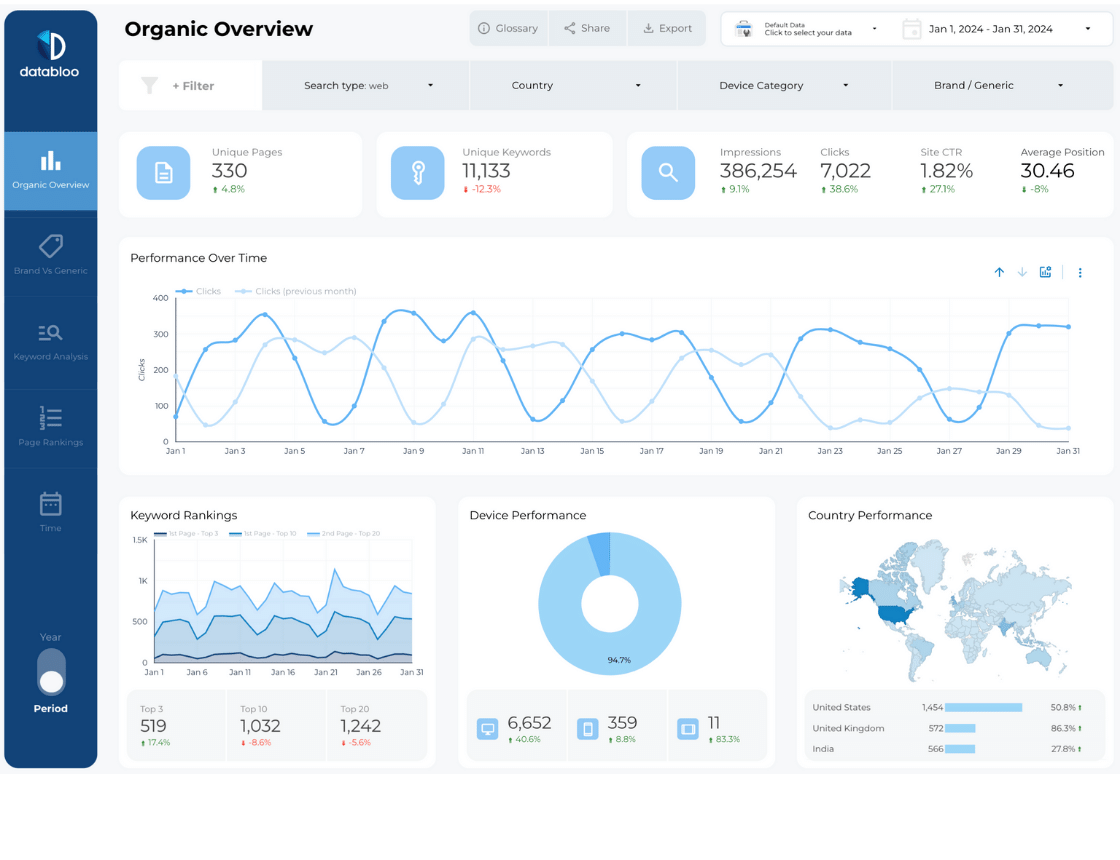
- How is my WooCommerce store performing over time?
- What are my total sales, refunds, and returns?
- Which products and categories are driving the most revenue?
- Who are my top customers and what is their average order value?
- Are discounts and coupons increasing or reducing revenue?
- What countries, states, and cities are most profitable?
- How do payment methods like cards vs PayPal affect total sales?
- What is the overall performance over the last 12 months?
- When do people buy the most during the month or week?
- What is my monthly sales trend?
Read More
What This WooCommerce Report Template Shows
Unlock the potential of your WooCommerce data with our advanced reporting template. Optimize your strategies, maximize your revenue, and elevate your business to new heights. WooCommerce Data Studio Template – where data meets actionable insights for your success in e-commerce in five different sections.
-
-
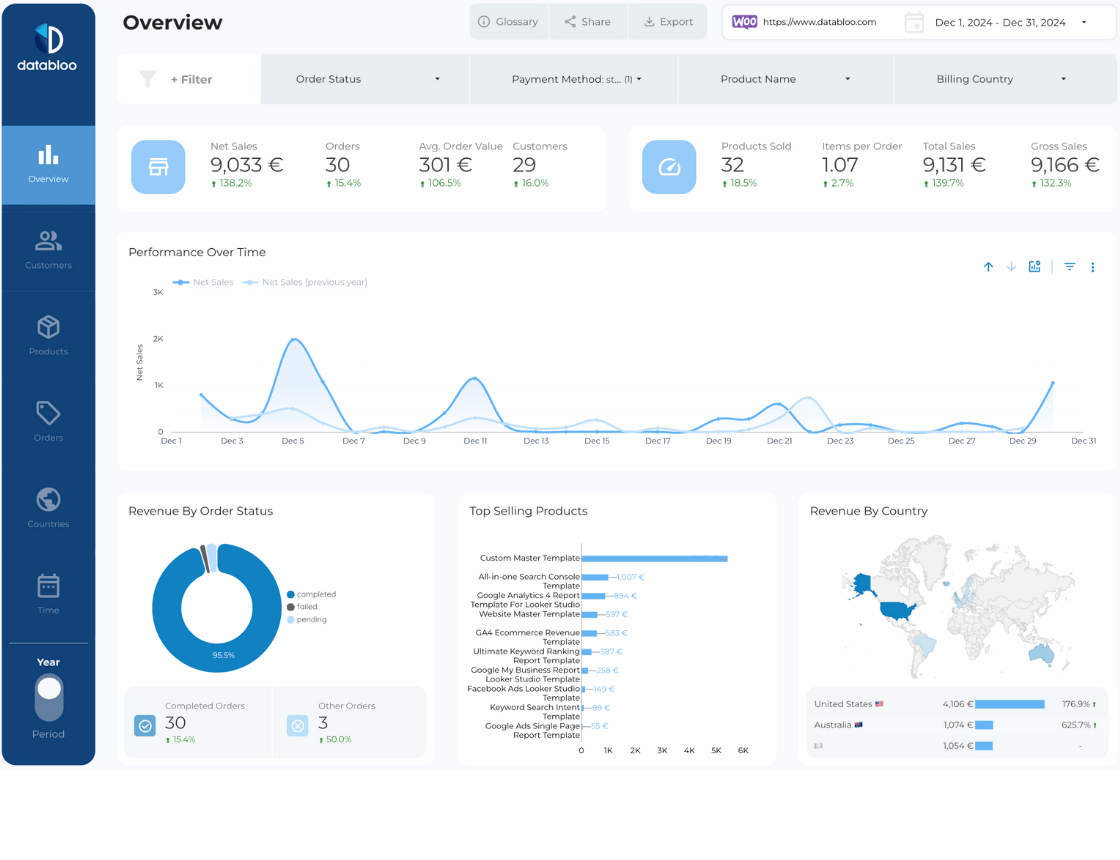
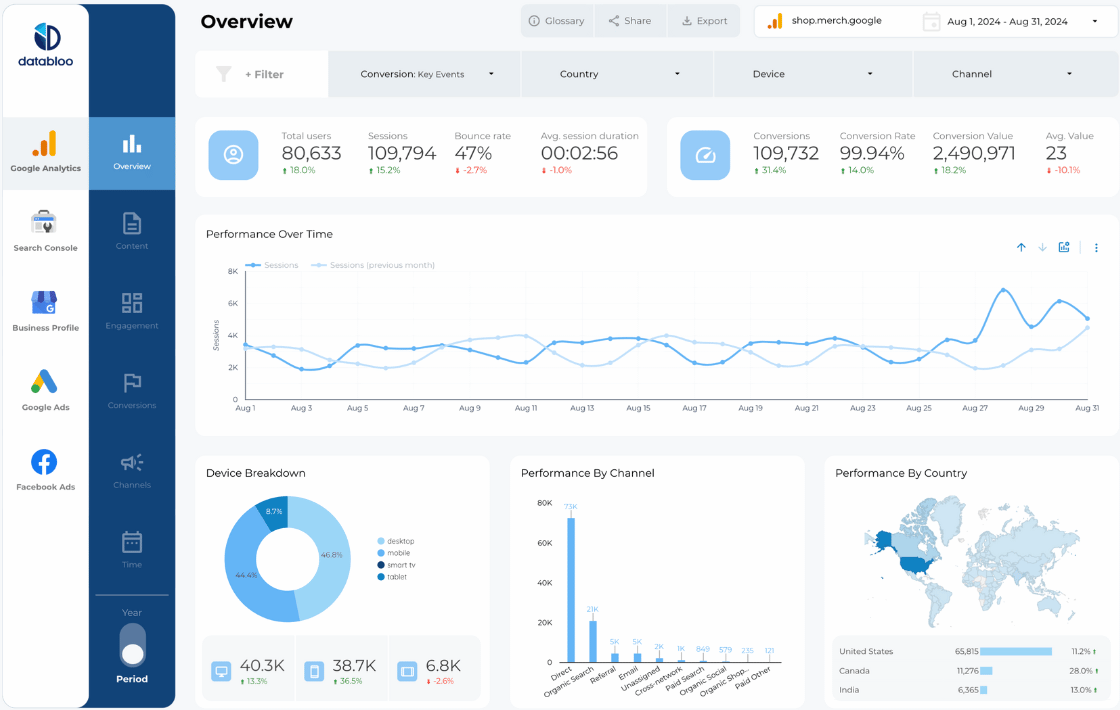
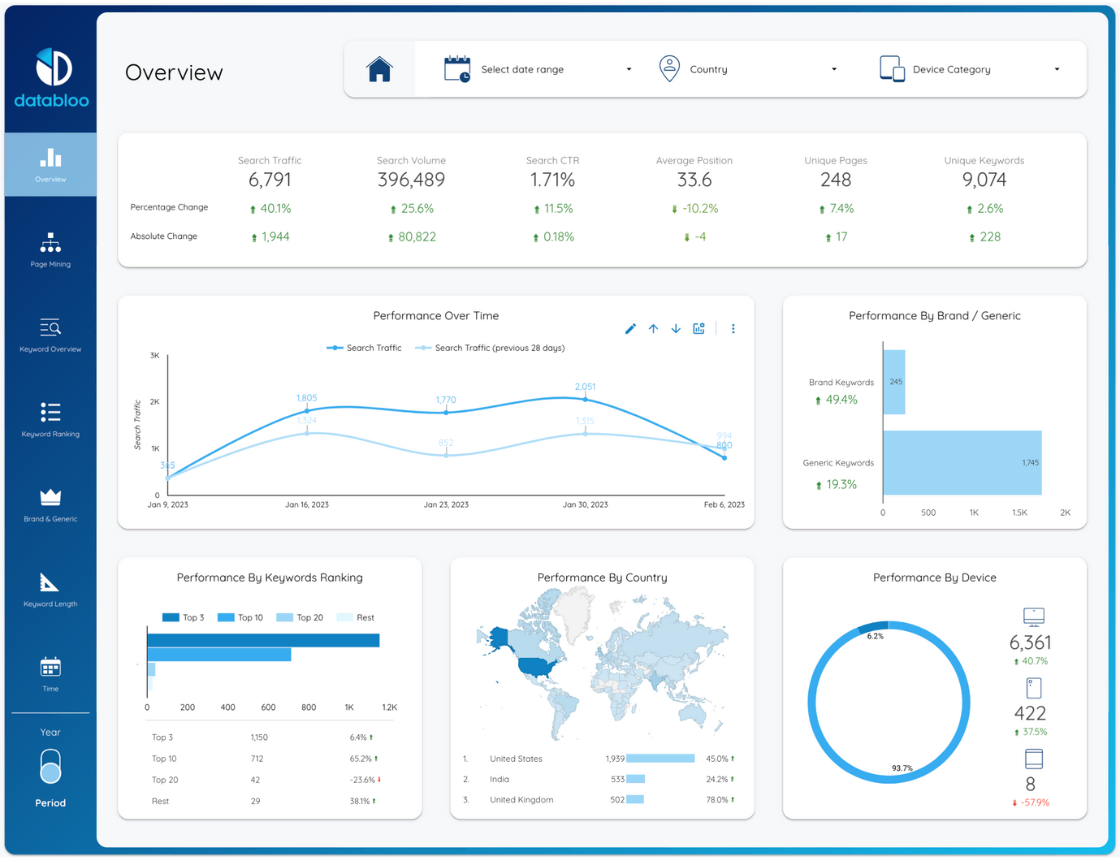
- Overview: Dive into the Overview section to get an in-depth look at your store’s health. Track essential KPIs such as Net Sales, Orders, Customers, and more. This section provides you with a quick snapshot of your store’s overall performance and trends. Visualize your sales performance over time through an interactive dynamic chart, enabling you to identify growth patterns, sales peaks, and areas that require attention.
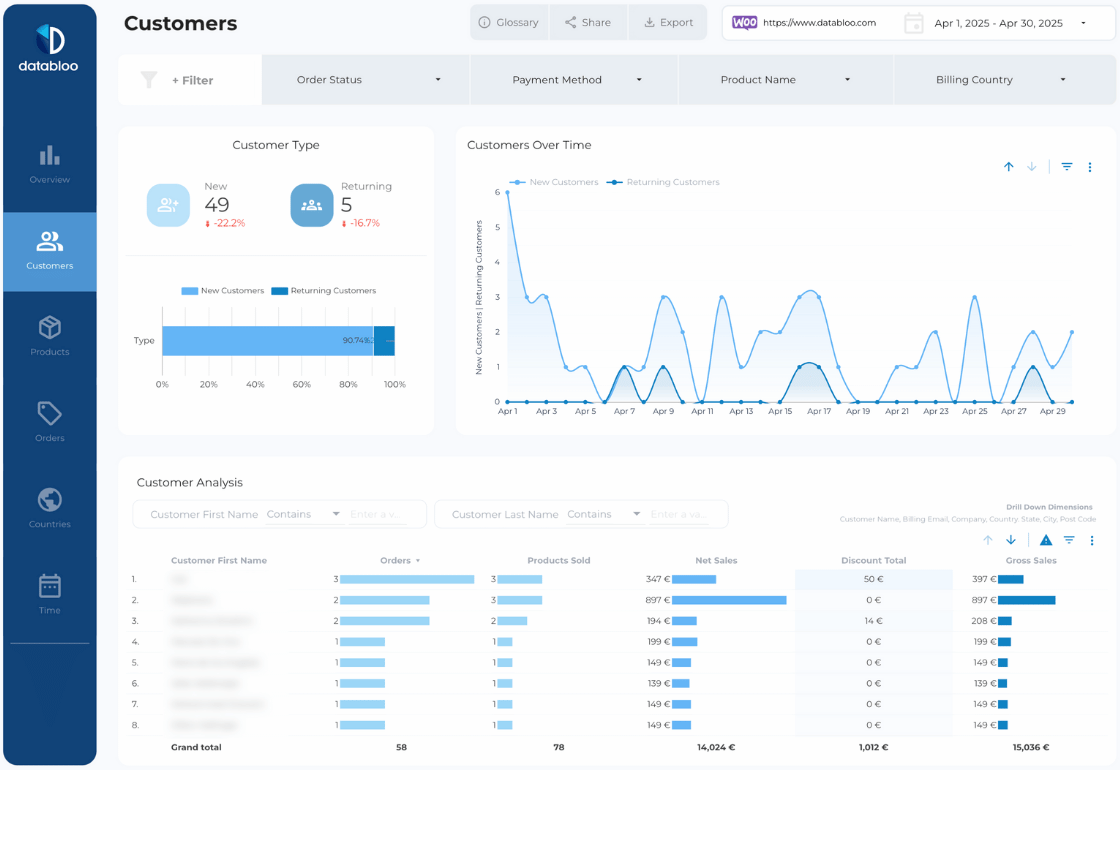
- Customers: This section highlights customer behavior. Track top new vs returning customs, top spenders, low spenders, and their average order value. You’ll also see the number of unique customers and how much revenue they’re generating. Use this data to tailor your retention and targeting strategies.
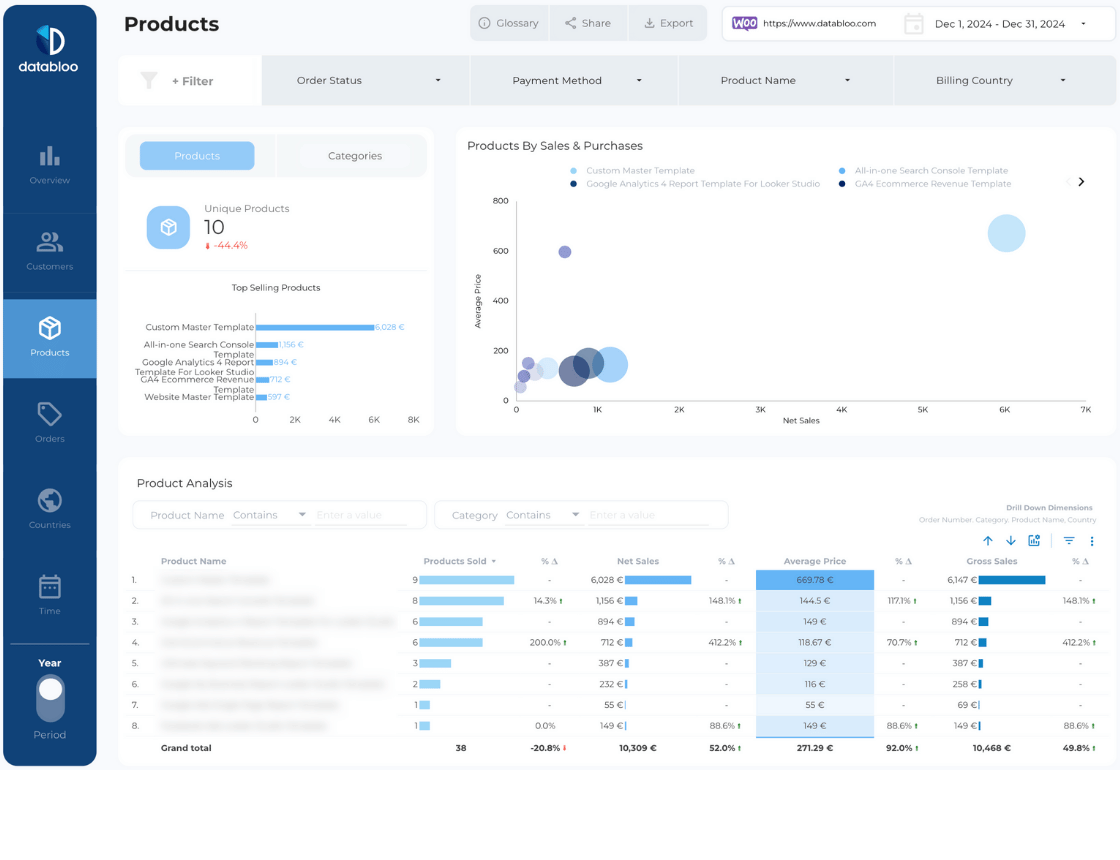
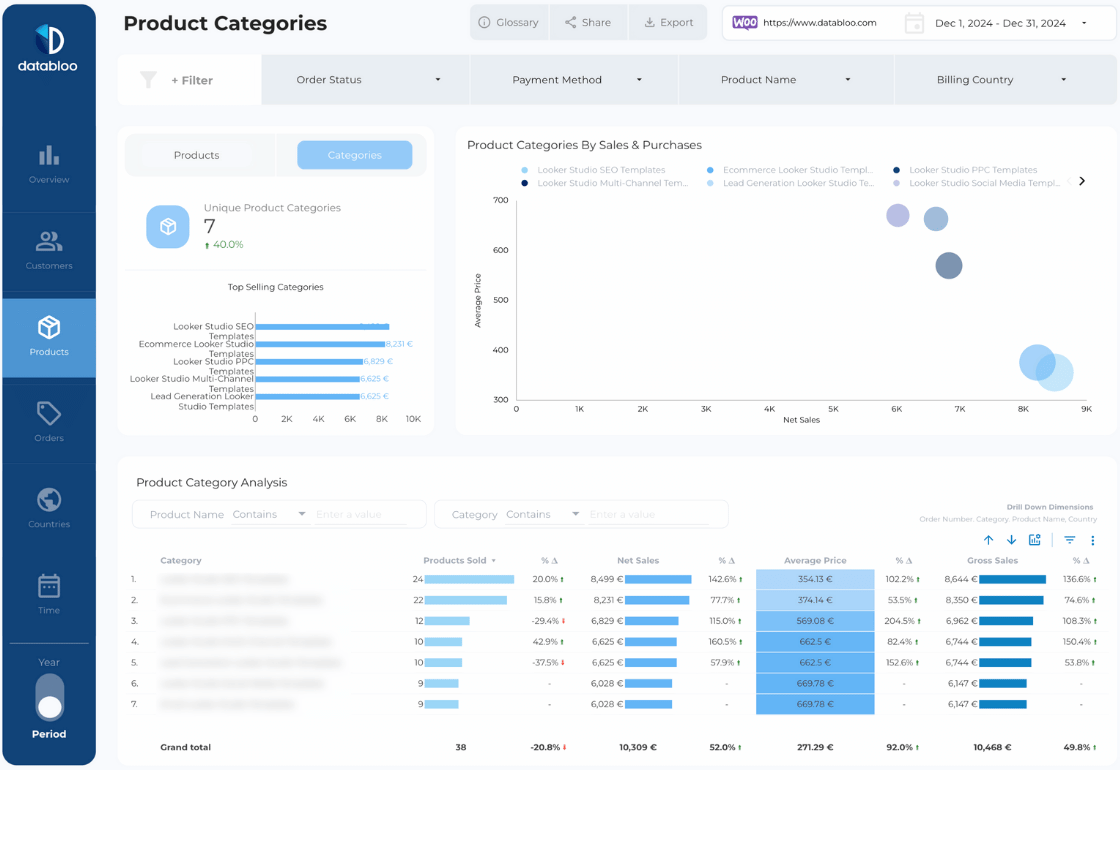
- Products: Understand what’s selling and what isn’t. This section has two parts: Products – see which individual products drive the most revenue. Product Categories – Spot which categories perform better, so you can promote high-performers and optimize underperforming ones.
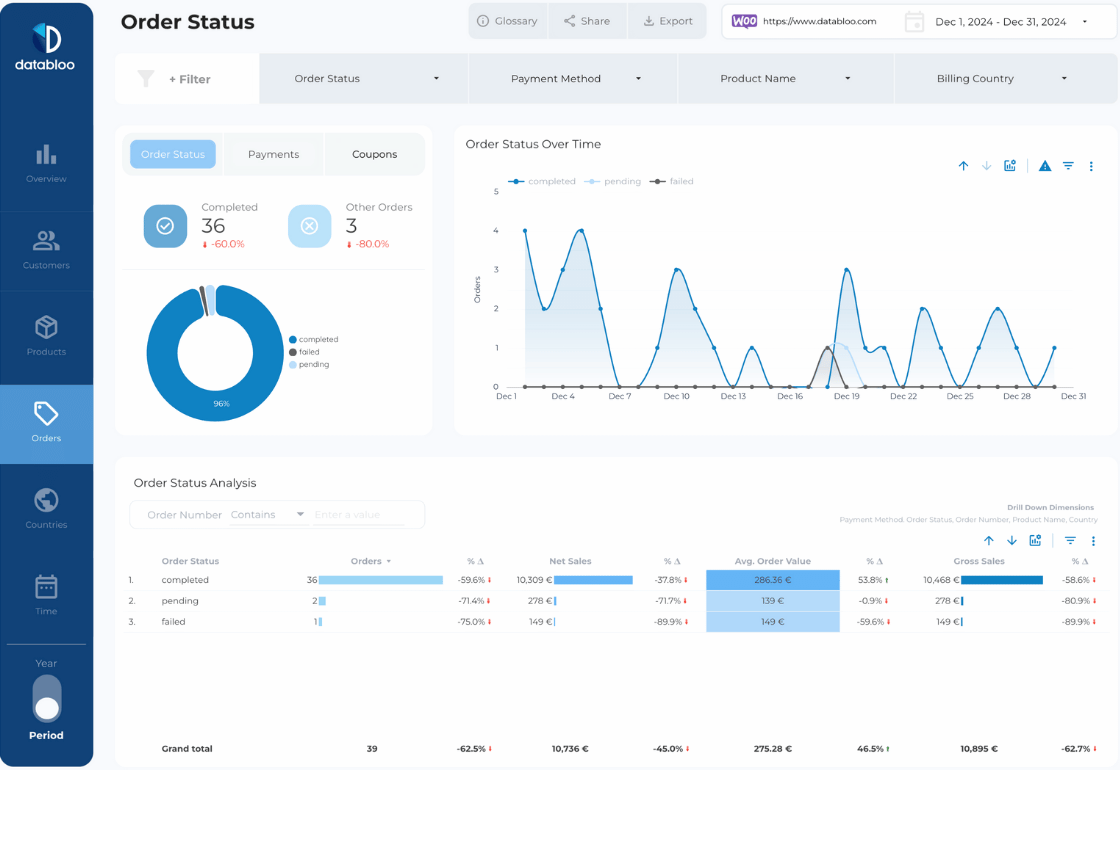
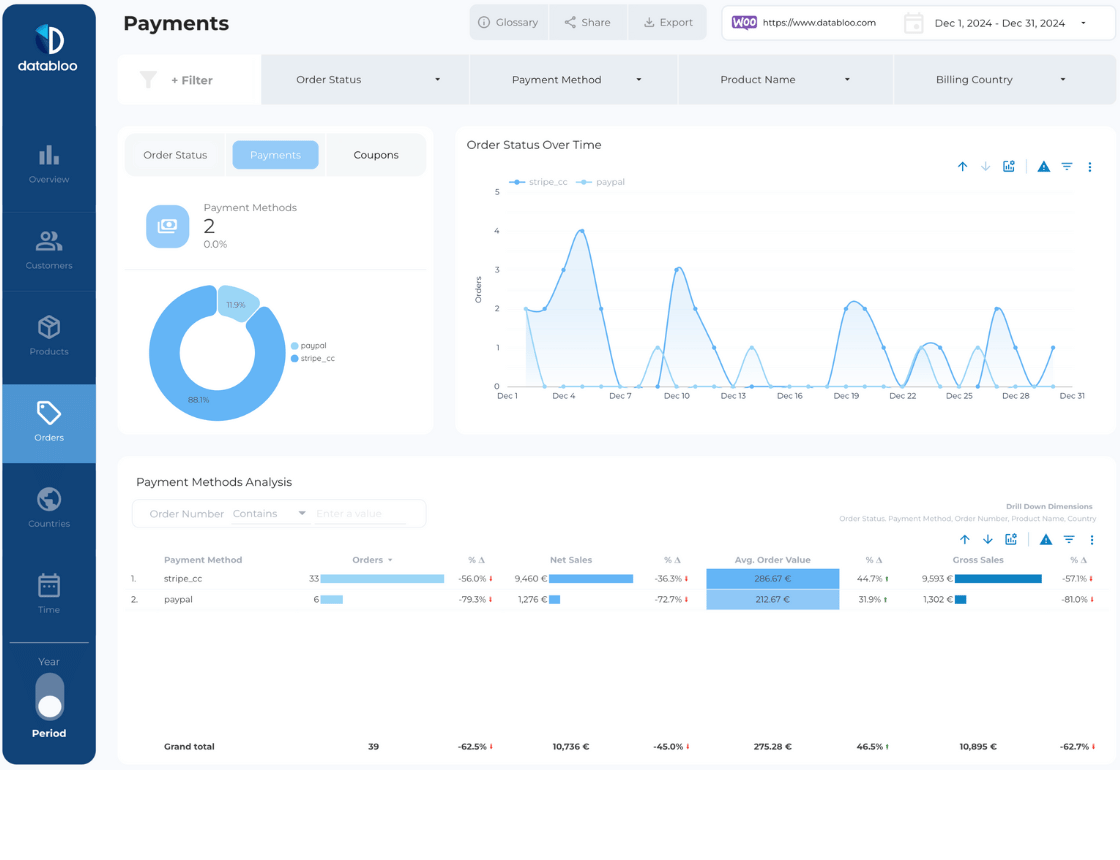
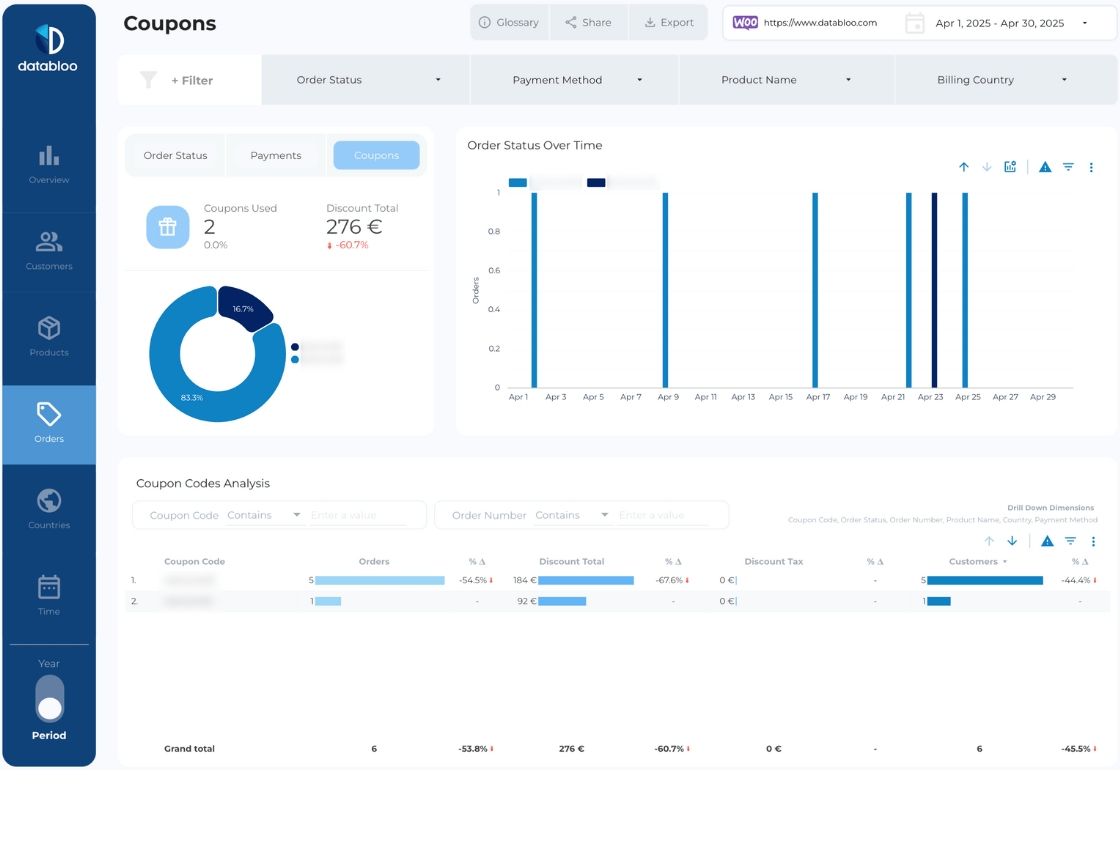
- Orders: In the Order Status section, you’ll gain valuable insights into the status of your orders. Discover which order statuses, such as Completed, Refunded, Cancelled, and Failed, contribute the most to your total revenue. Another section is related to payment methods – see whether PayPal, cards, or other methods are most commonly used—and how they influence sales. Lastly, the section for coupons allow you to analyze how promotions affect order volume and net sales.
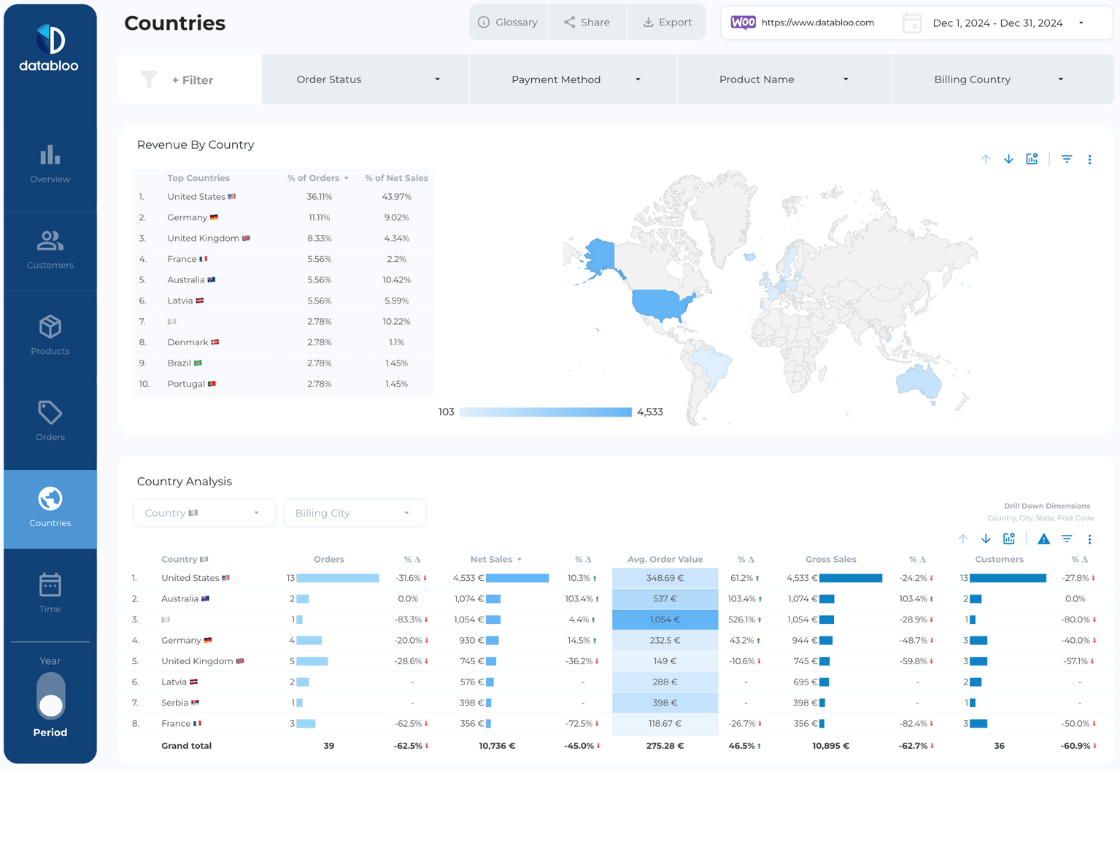
- Countries: Explore the global impact of your e-commerce business in the Billing Countries section. This section provides a world map highlighting sales and charts showcasing the top-performing countries by net sales and orders. Additionally, the country analysis allows you to drill down into billing states and cities.
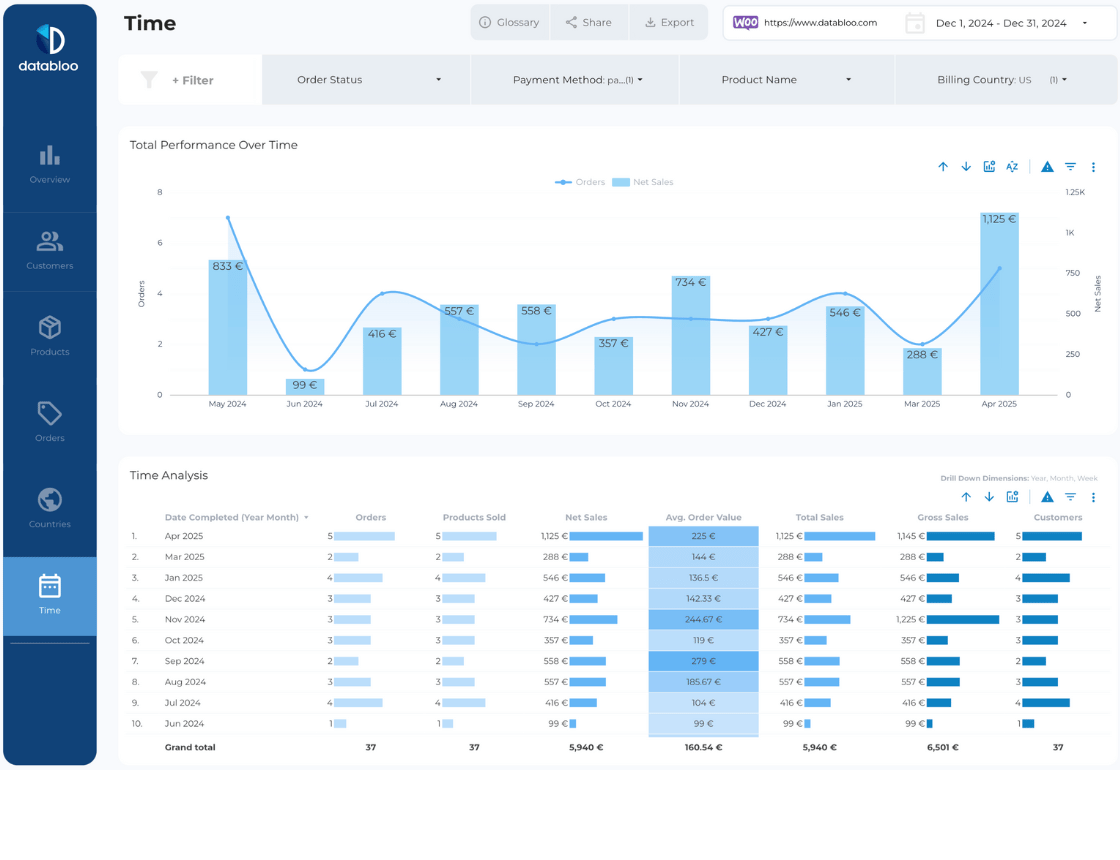
- Time: The Time section offers historical performance insights over the past 12 months. A bar chart displays key metrics such as Net Sales and Orders, helping you identify long-term trends and seasonal patterns. The table breaks down KPIs mentioned in the Overview section on a monthly basis, allowing you to dive deeper into your store’s historical performance. You can easily drill down from month to week to pinpoint trends and make data-driven decisions.
Use Cases
This WooCommerce Report is perfect for:
E-commerce store owners who want to monitor sales and customer behavior
Marketing teams looking to improve conversion and retention strategies
Agencies managing multiple WooCommerce clients
Business owners needing clear, monthly reports to inform decisions
Free and Easy Setup
And the best part? Our WooCommerce Template utilizes our free Data Studio connector, eliminating the need for subscription fees. You can set it up in under a minute and start exploring your data right away.