Table of Contents
Reporting is one of the most crucial processes in every agency’s operation.
A reporting well done keeps clients informed and satisfied, while internal reporting improves collaboration between colleagues and reduces the friction between different departments.
In this article we’ll cover 11 various agency reporting tools to help you create insightful, intuitive, multi-channel marketing reports.
Important Traits of Agency Reporting Software
Customization
To make a custom report that fits perfectly a specific client scenario is to boost client loyalty tenfold.
The best agency reporting tools allow reports to be easily edited, rearranged, and tailored to play into specific client preferences and expectations.
Multiple Channels Integration
The best reporting tools can connect to several data sources and platforms at once, helping you present and find insights at the intersection of several data points.
Data Visualization
Crucial part of any reporting software is how easily data is shared and presented. For agencies, data visualization plays a pivotal role as it helps quickly communicate progress and insights both within internal teams and when reporting to agency customers.
White Labeling
White labeling, in simplest terms, refers to the ability to create branded agency reports with logo, fonts, and other visual elements that are part of your marketing agency brand.
Aside from making your reports look more professional, white labeling is paramount when working with a wide array of clients, especially enterprise clients. When your report is shared across several departments, companies or public events, it’s easier to track it back to your company when it’s branded.
Drag and Drop Functionality
If you have an ability to quickly adjust reports to specific clients or scenarios, it’s always a win. But in practice, it’s usually such a tedious task that many agencies are reusing the same reporting templates for years.
In our experience, if an agency reporting tools features drag and drop functionality, it’s always easy to make quick adjustments to reports and increase customer loyalty through reports tailored to each customer.
Automated Reporting
Automated reports can refer to two different things: reports that are automatically filled with data and reports that are being sent to you automatically at regular intervals.
Obviously both options save a lot of time for marketing agencies.
Other Good To Have Features
There are obviously dozens of other features useful for agencies, such as:
- Client access portals
- Historical data tracking
- Collaboration features
- Access on mobile devices
And more!
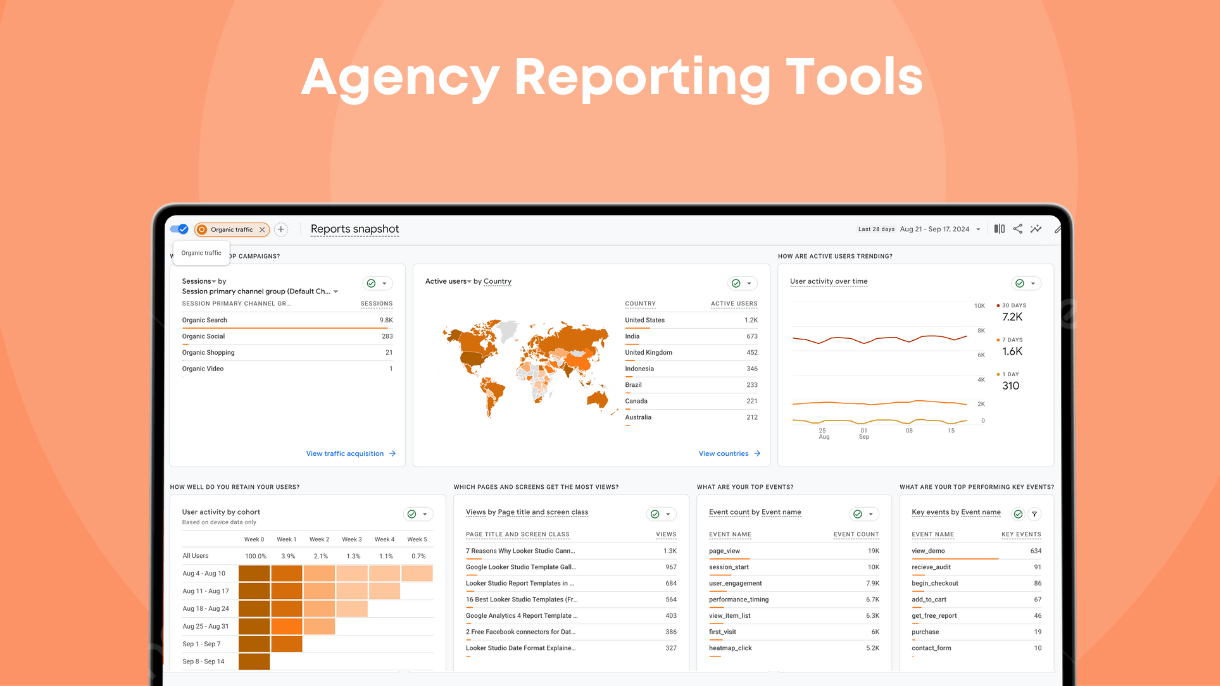
Now let’s look at the most reliable and professional agency reporting tools that have been tested and used for agency reporting for years.
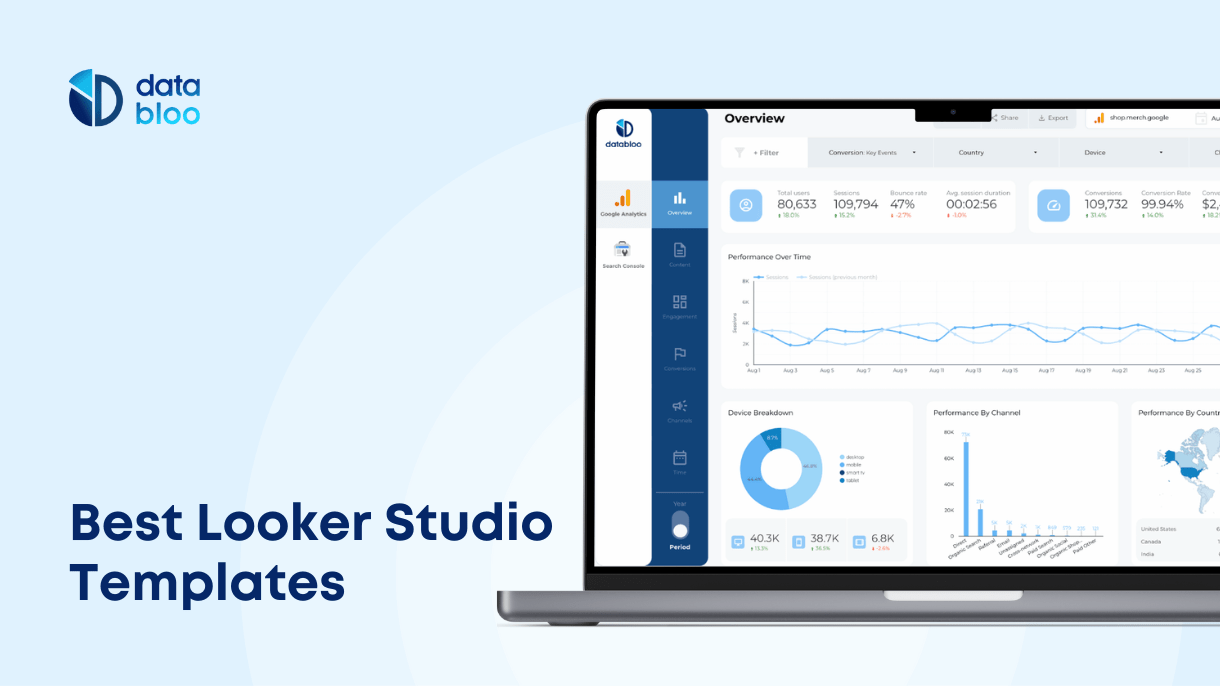
Looker Studio
Looker Studio is a powerful reporting platform with unlimited number of features options to accommodate reporting needs of any marketing agency.
The platform is both versatile and very well documented – you can build marketing reports from scratch or use pre-made reports from its vast and growing library of templates.
Looker Studios can be used to build fully customizable reports and dashboards that connect to any number of data sources through looker connectors.
Looker Studio supports real-time updates and features an intuitive drag-and-drop interface to quickly adjust and rearrange reports visually.
Here are some notable features that makes Looker Studio an efficient reporting solution for agencies:
- Real-time updates
- Drag and drop interface
- Multiple data sources
Some cons:
- Steep learning curve
- Overwhelming UI for beginners
Databloo
Databloo is an all-around solution for agency reporting built on top of Looker Studio, meaning it has all of its features and more.
For starters, Databloo offers a wide variety of reporting templates for every aspect of agency marketing: SEO, advertising, social media, lead generation, e-commerce, and so on.
So, if your agency needs a specific report filled with data, all you need is simply log-in with your account and the report will be automatically filled with your data.
Every Databloo report is white-labeled and can be edited or rearranged to tailor to your specific needs. It also has a free demo, so you can try it with no strings attached.
If, however, you need a more custom solution, Databloo offers a custom report builder where you can build a professional report with multiple data sources, dashboards and graphs within minutes using intuitive drag-and-drop interface:

Databloo unique features include:
- A vast library of professional, field-tested marketing reporting templates
- Free demo for every report
- Custom connectors for different data sources
- While labeling out of box
- Unlimited customization
- Automated reporting (data collection, real-time updates)
Google SpreadSheets
Google Spreadsheets remains a surprisingly viable tool for agency reporting if you don’t mind a lot of manual control over data.
Despite its simple interface, you can build marketing reports of varying complexity as the tool supports data visualization using graphs and dashboards.
You can, however, automate data collection for Google Spreadsheet, allowing the tool to pull data from various sources using API connection, but you’ll likely have to use a 3rd party API for that.
Some notable Google Spreadsheets features for agency reporting:
- Easy and quick to use, hard to master
- Collaboration workflow is straightforward
- Takes extra effort to automate (or using Apps Script to connect spreadsheet with other Google products)
- Can build reports of varying complexity
- A lot of manual work required for creating and updating report
Tableau
Tableau is a powerful data visualization and business intelligence platform for agencies that are looking for advanced analytics and complex interactive dashboards.
It particularly shines when working with enterprise clients that force agencies to manage large volumes of data and are looking for deeply customized solutions.
A feature worth mentioning here is Tableau Prep, an AI-powered visual framework for cleaning and preparing data for reporting that is especially viable for cleaning up data on scale.
Here are some highlights of using Tableau for agency reporting tool:
- Works well for large data sets, but might be an overkill for smaller agencies
- Powerful data blending and cleaning tools
- Scalable solution
- Highly customizable data visualizations
Microsoft Power BI
Microsoft Power BI is a robust business intelligence tool that allows agencies to create data-driven reports and dashboards with a professional look.
It is known for its deep integration with other Microsoft products like Excel and Azure, and hence will be a natural extension for agencies already operating within the Microsoft ecosystem.
BI helps agencies to import, transform, and visualize data from a wide range of sources, enabling rich, interactive reporting across marketing, sales, and performance metrics.
Its data preparation engine-feature, Power Query, lets users clean, shape, and merge data from several sources without writing code – especially valuable for marketers operating with complex datasets on their own. Using DAX (Data Analysis Expressions), its native query language, you can build formulas and expressions in Power BI for calculating values and performing data operations on the go.
Some notable features of Power BI:
- Scalable for multiple clients and sets of data
- Enterprise-level security
- Advanced data modeling with DAX
- Drill-down, interactive dashboards
- Steep learning curve
Databox
Databox is an agency-friendly reporting platform for performance tracking and client reporting.
Unlike more robust or traditional BI tools, Databox focuses on marketing, sales, and service KPIs—making it an ideal out-of-the-box solution for agencies.
Its intuitive interface, pre-built templates, and fast setup help agencies build real-time dashboards with low effort. Databox pulls data from dozens of sources and centralizes it in one visually engaging, client-ready view.
Pros of Databox as an agency reporting tool:
- Mobile-optimized dashboards
- Dozens of native integrations (some integrations require paid plans)
- No-code custom metric creation
- Can get expensive as client volume grows
Zoho Analytics
Zoho Analytics is a complex business intelligence and reporting platform with capabilities for data analysis, visualization, and collaboration – a solid choice for agencies that need to deliver deeper insights to clients.
Zoho supports a wide range of data sources, including marketing platforms, CRMs, spreadsheets, and cloud databases. Marketing agencies can build interactive dashboards and in-depth reports all within a clean, user-friendly interface.
One of its interesting features is AI-powered insights via Zia, Zoho’s smart assistant, which helps agencies uncover trends and data anomalies using natural language queries. Agencies also benefit from role-based access controls and white-labeling, which make it easy to manage multiple clients in a secure way.
Pros of Zoho Analytics for agency reporting:
- Strong data blending capabilities
- AI assistant for insights and analysis
- White-labeling for branded client portals
- Broad integration with marketing and CRM tools
- UI may feel less modern compared to other solutions
Supermetrics
Supermetrics is a reporting tool for marketers and agencies that doesn’t create reports on its own but acts as sort of a bridge that pulls data from various marketing platforms (e.g. Google Ads, Facebook Ads, LinkedIn, HubSpo) into tools agencies already use, such as Google Sheets, Excel, Looker Studio, and BigQuery.
This makes it ideal for agencies that are seeking full control over their reporting format while automating the data pipeline behind it.
Its major benefit is coverage – Supermetrics supports over 100 marketing data sources, including niche and regional platforms.
Pros and cons of Supermetrics for agency reporting:
- Seamless integration with popular reporting tools
- Supports 100+ marketing and analytics platforms
- Automated data refresh and scheduling
- No built-in visualization or dashboarding
- Limited data transformation capabilities without external tools
Klipfolio
Klipfolio is a cloud-based dashboard and reporting platform with over 130 native integrations such as Google Analytics, Facebook Ads, HubSpot, and Salesforce.
It can be used to consolidate various marketing data into interactive dashboards and facilitate insights and analysis through custom visualization.
Highlights of using Klipfolio as a reporting tool:
- Highly customizable dashboards
- Client management features
- Steep learning curve
- Limited data transformation capabilities
- Domain Overview: Provide clients with a high-level snapshot of organic search traffic, keywords, and competitive benchmarks.
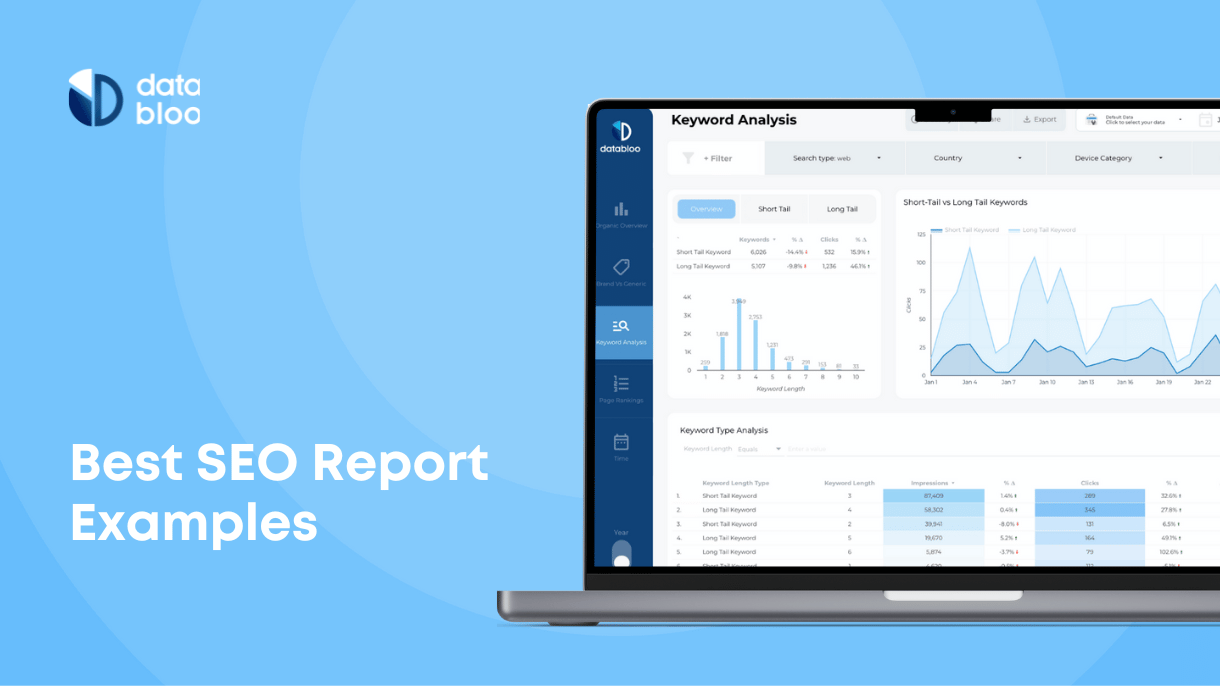
Semrush
Semrush over years grew into a comprehensive marketing platform and a reporting solution, although primarily for SEO and search advertising.
But, if your agency is only focused on these two services, Semrush might be a viable alternative to purchasing or developing a custom reporting platform if you don’t need white labeling or report customization, especially if you’re already using the platform for SEO analysis and research. It might be costly to purchase Semrush for just reporting, though.
Check out Databloo advanced SEO reports with free demo here.
Some notable Semrush features for SEO reporting include:
- Site Audit Tool: identify technical SEO issues with crawl reports
- Backlink Analytics: Track new and lost backlinks, assess link quality and overall balance of your link profile
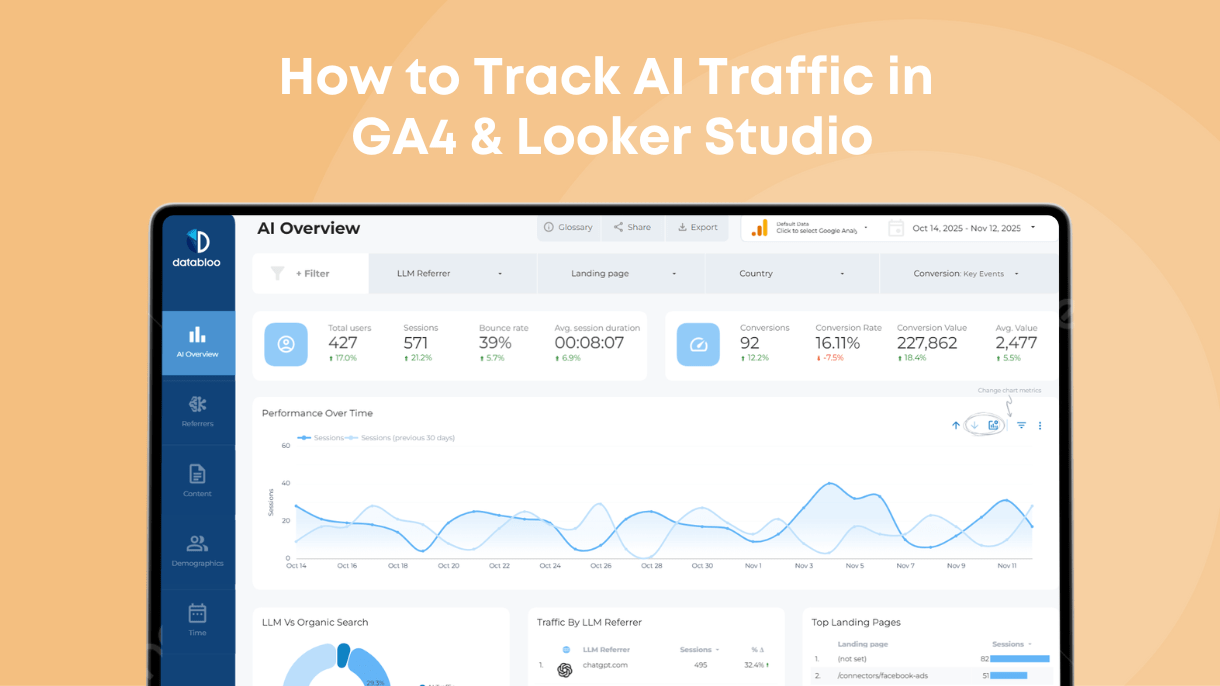
Google Analytics
Google Analytics is a free SEO and PPC marketing platform that helps marketing agencies to track lead generation efforts within Google infrastructure – Google search, Google advertising, etc.
Given that Google ecosystem is vast, Google analytics can easily be used as a reporting tool, as it can cover all the needs of your marketing agency clients’.
Google Analytics offers multiple reports to present data in new and meaningful ways, for example, reports on ad spend, on organic conversions, etc.
The downside of reporting using Google Analytics is that you are limited by its functionality (you can’t customize how reports look, only filter some data points) and limited by the data presented (Google Analytics accumulates only data within Google ecosystem).
Notable Google Analytics features and limitations:
- Easy to use
- Only shows data within Google infrastructure (traffic, advertisement)
- Can’t support multiple data sources from other platforms (or requires advanced setup)
- No customization (a rigid set of reports and limited visualization options)
- No white labeling