Data Studio Is Back. Here’s What It Means for You
Looker Studio is becoming Data Studio again. Discover what’s changing, what stays the same, and how it affects your dashboards, reports, and connectors.
Looker Studio is becoming Data Studio again. Discover what’s changing, what stays the same, and how it affects your dashboards, reports, and connectors.
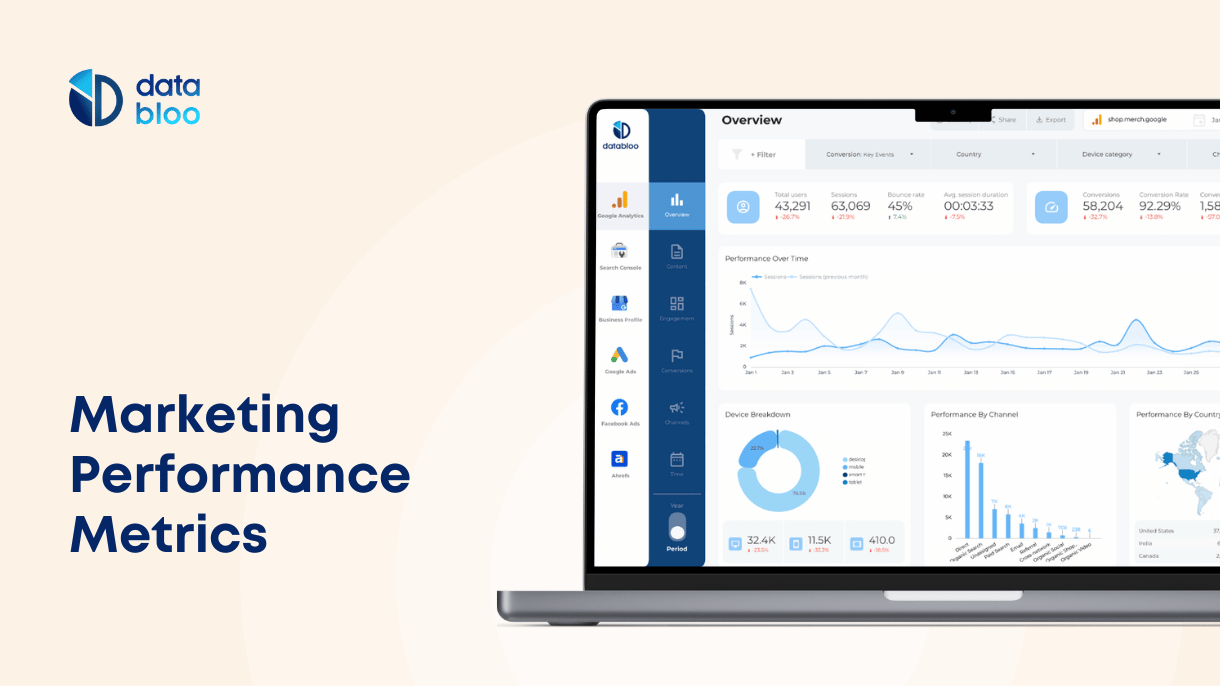
Discover essential marketing performance metrics for agencies. Learn how Data Bloo automates tracking and reporting to boost client satisfaction.
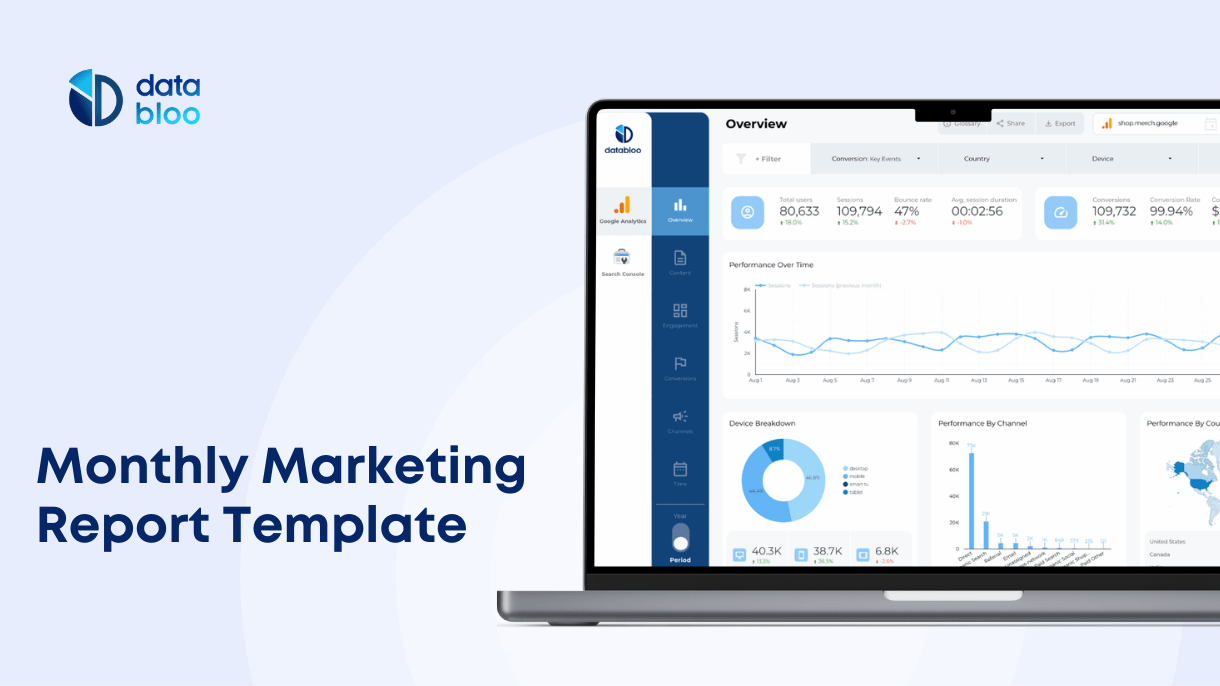
Learn how to build a monthly marketing report template that impresses clients and saves time. Automate reports with professional templates today.
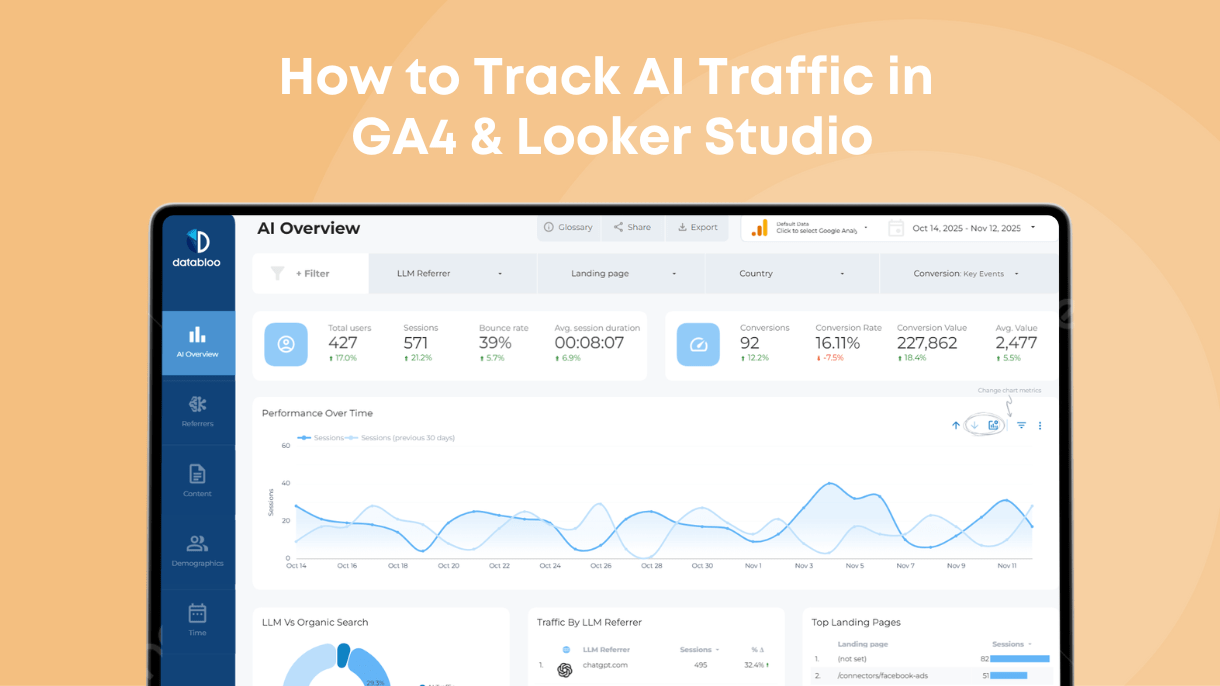
Learn how to track AI traffic from ChatGPT, Perplexity, Claude & Gemini using GA4 and Looker Studio. Full guide + AI traffic tracker dashboard examples.
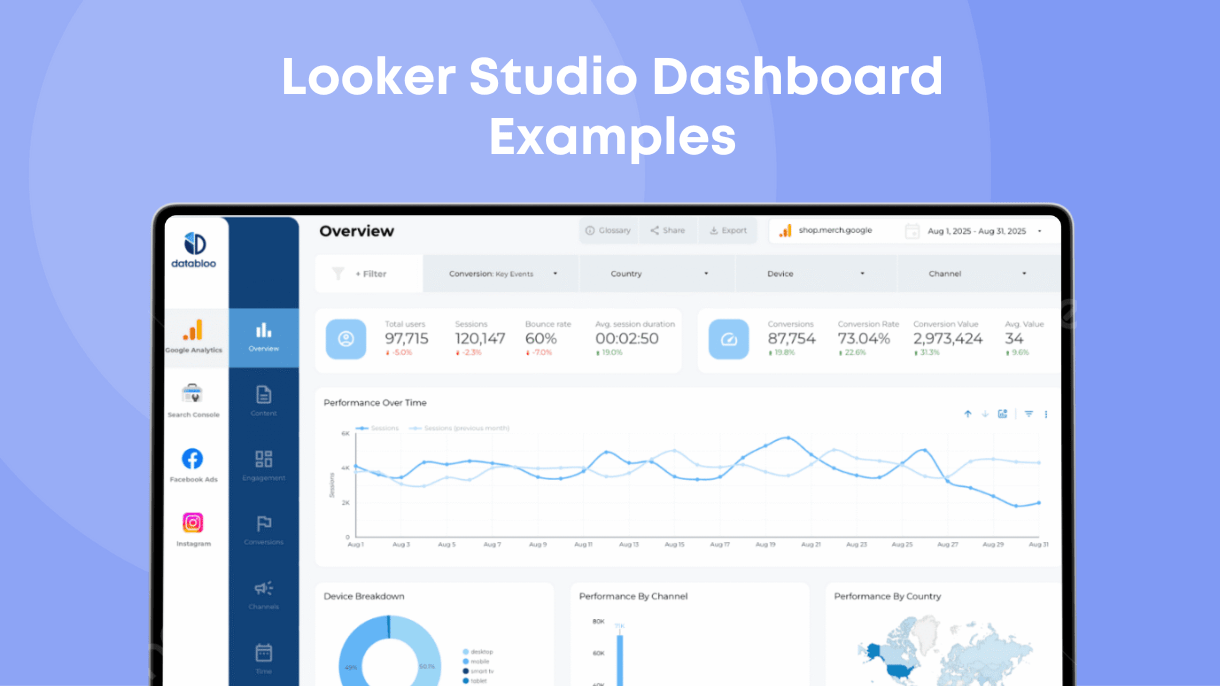
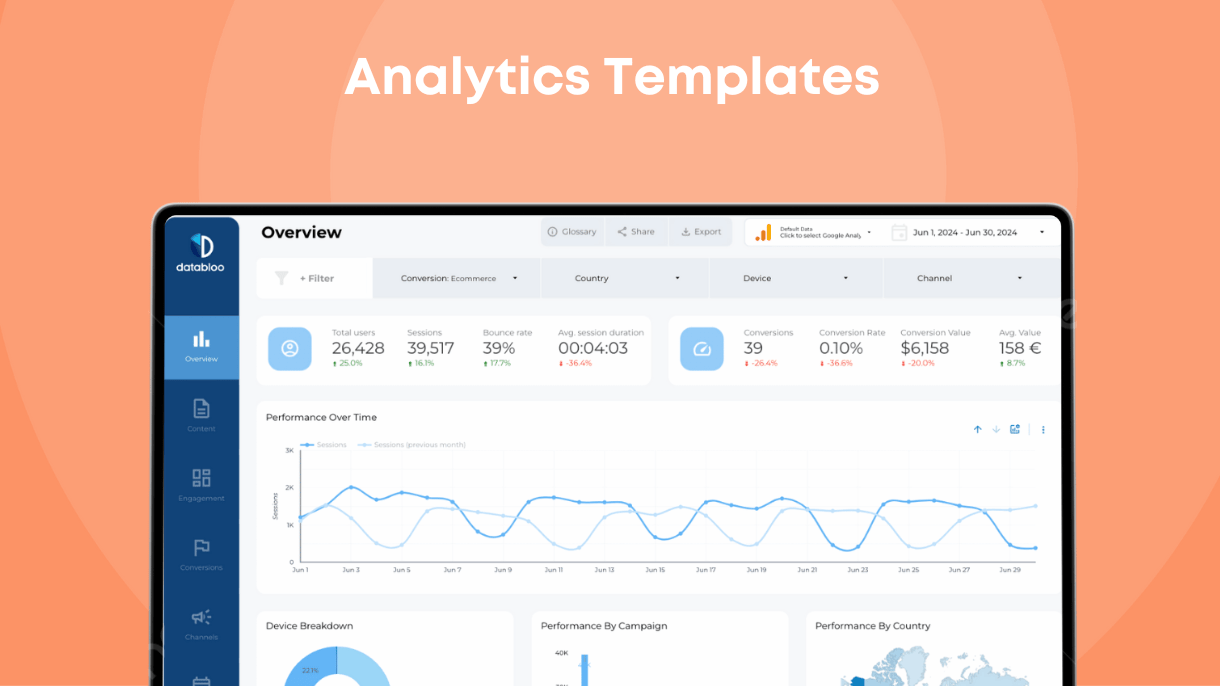
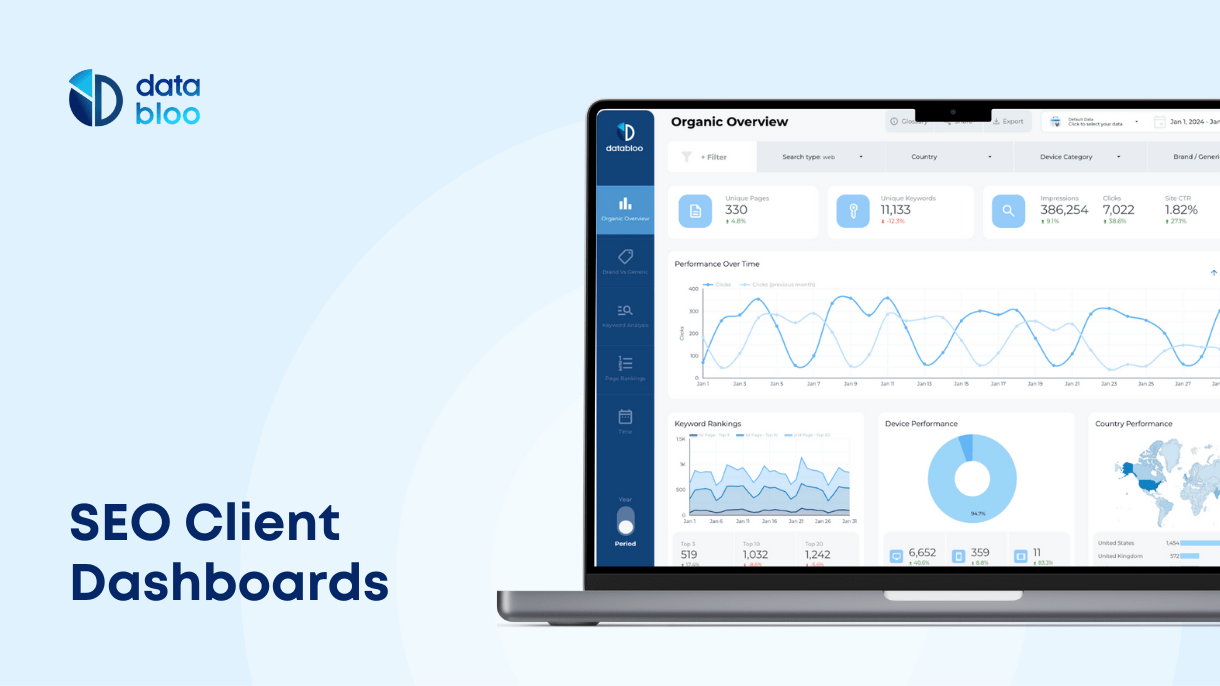
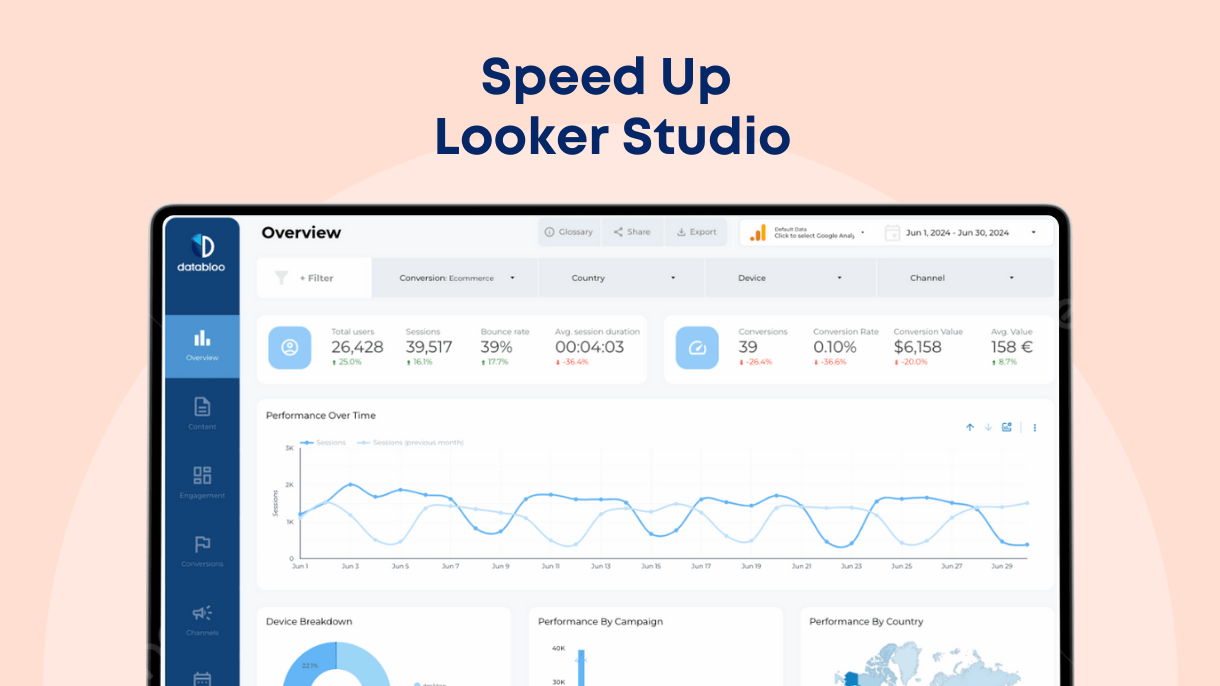
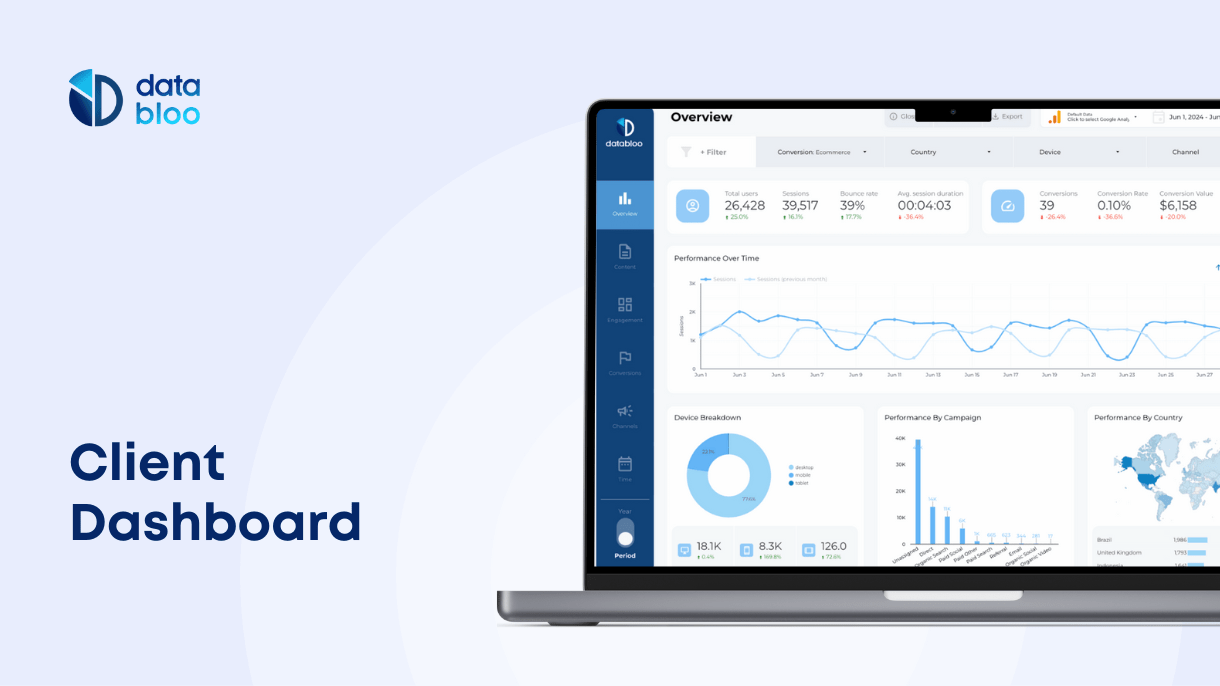
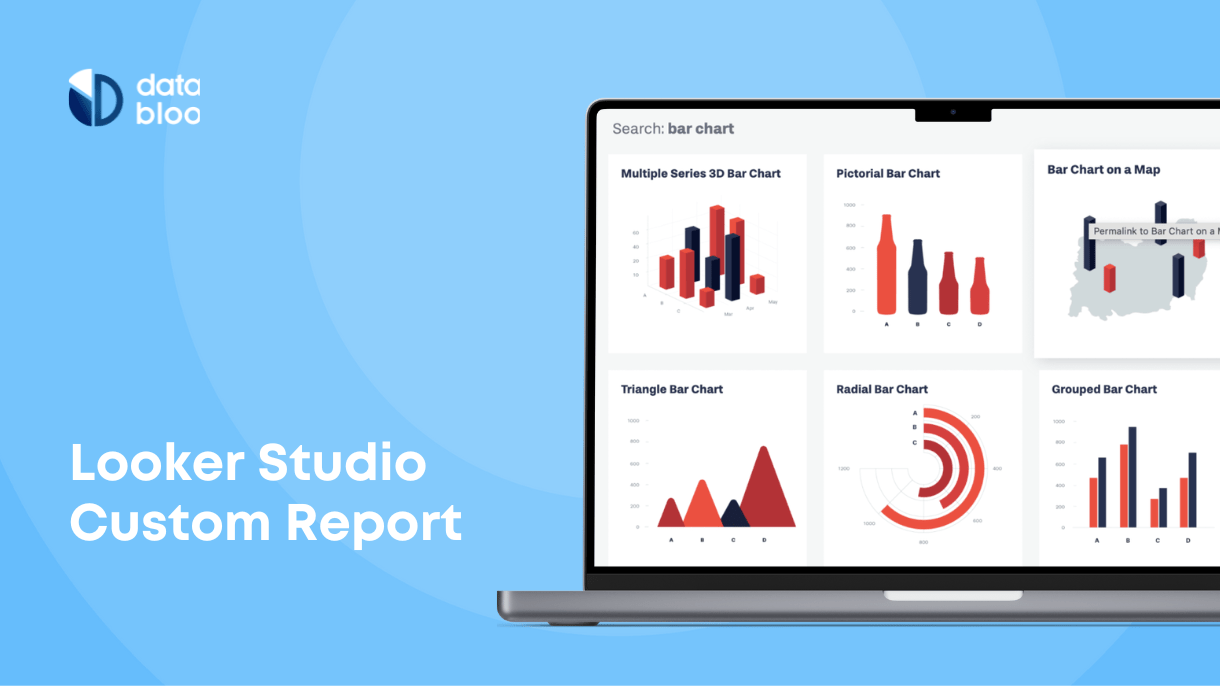
Explore the best Looker Studio dashboard examples for 2026. See how to design, customize, and track your performance using these free and paid templates.
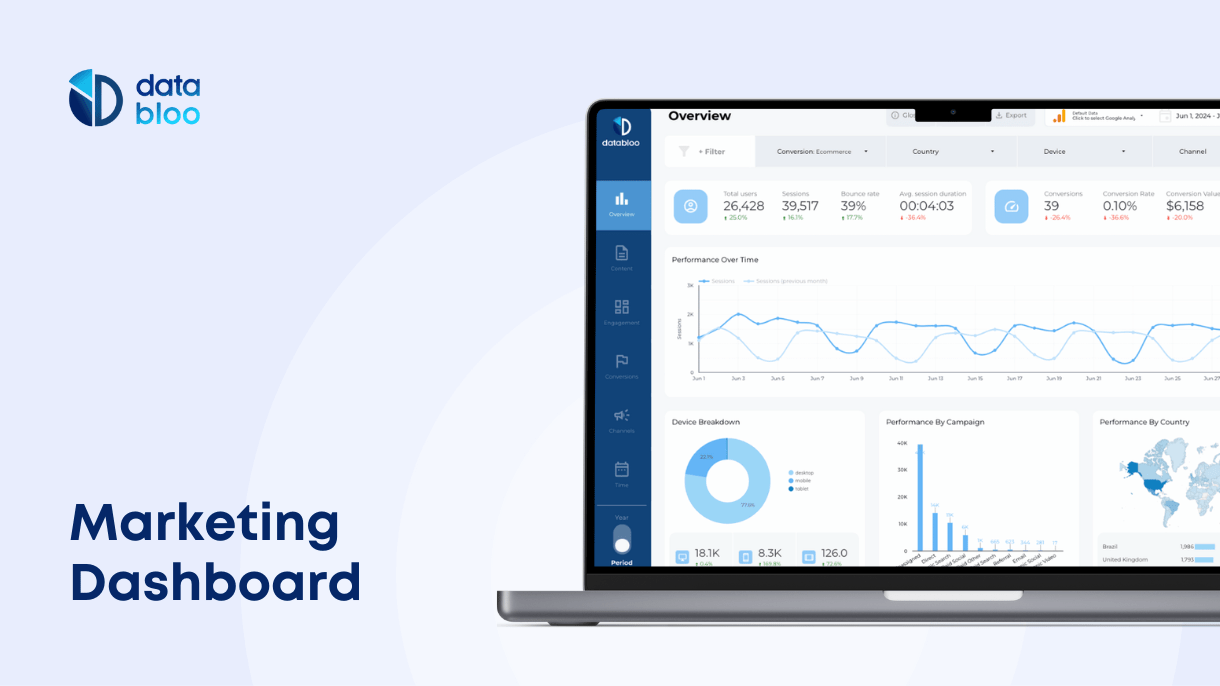
Unlock the full potential of your marketing dashboard with key insights, metrics, and tools that drive real conversions and help you make smarter decisions.
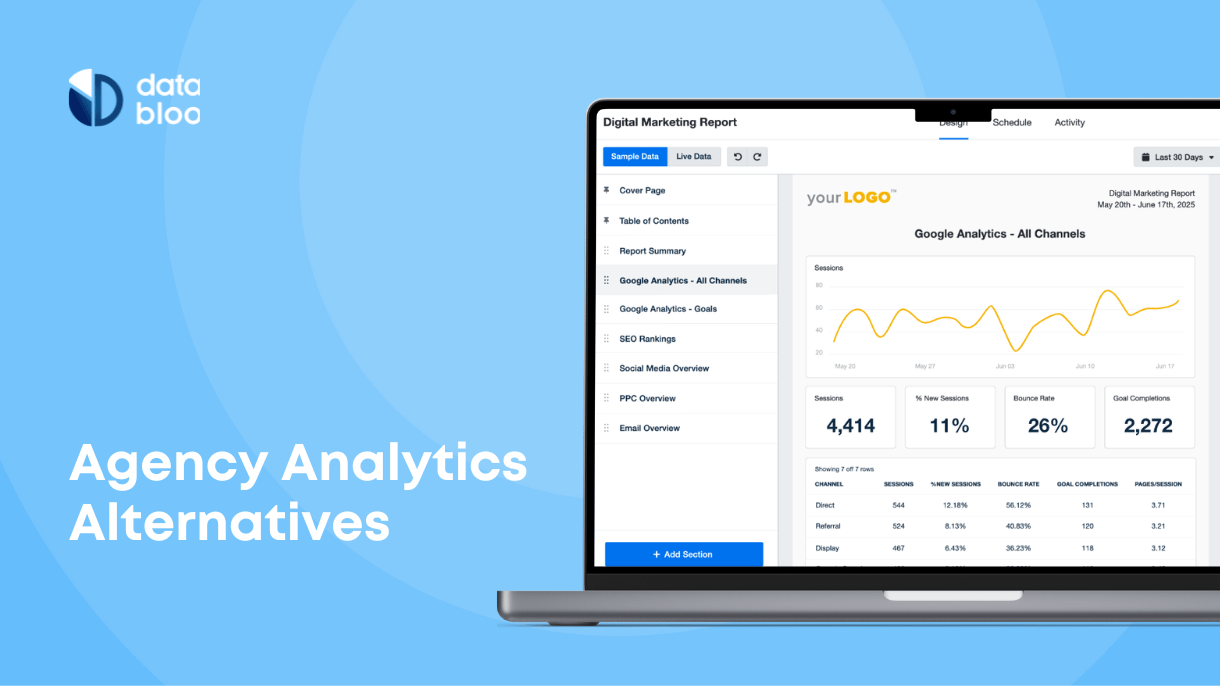
Using our guide, you can quickly compare AgencyAnalytics with other tools and choose the one that your data needs the most.
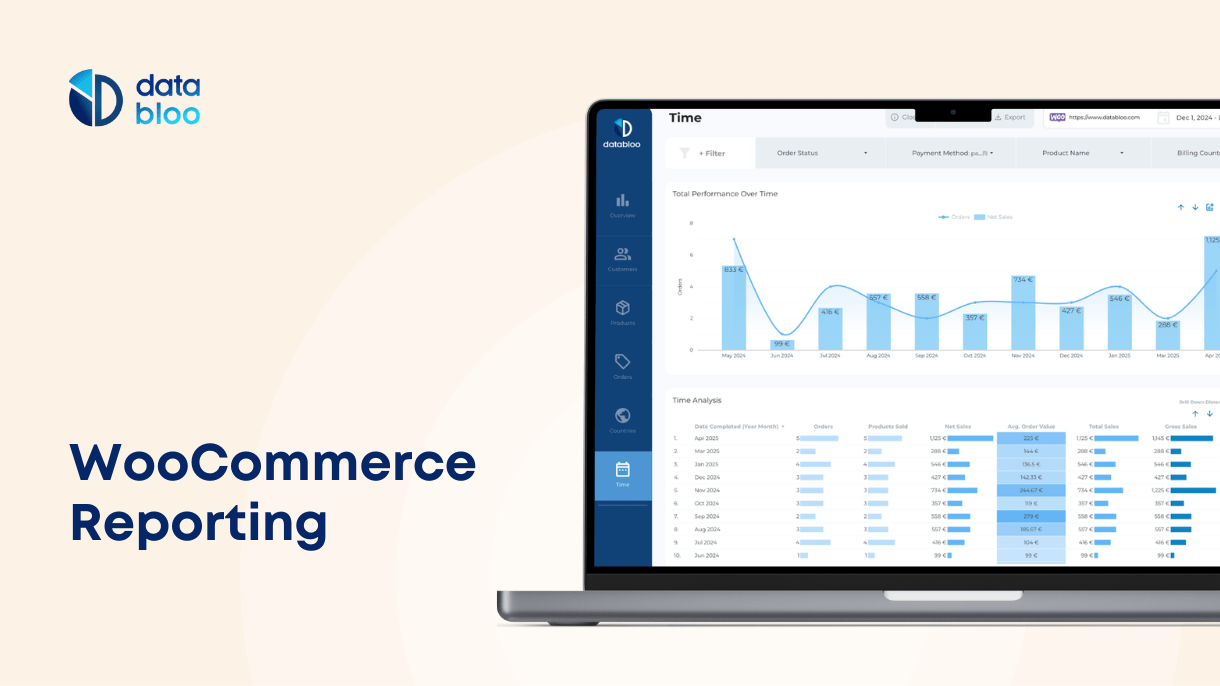
In this guide we will provide a comprehensive overview into WooCommerce reporting capabilities.
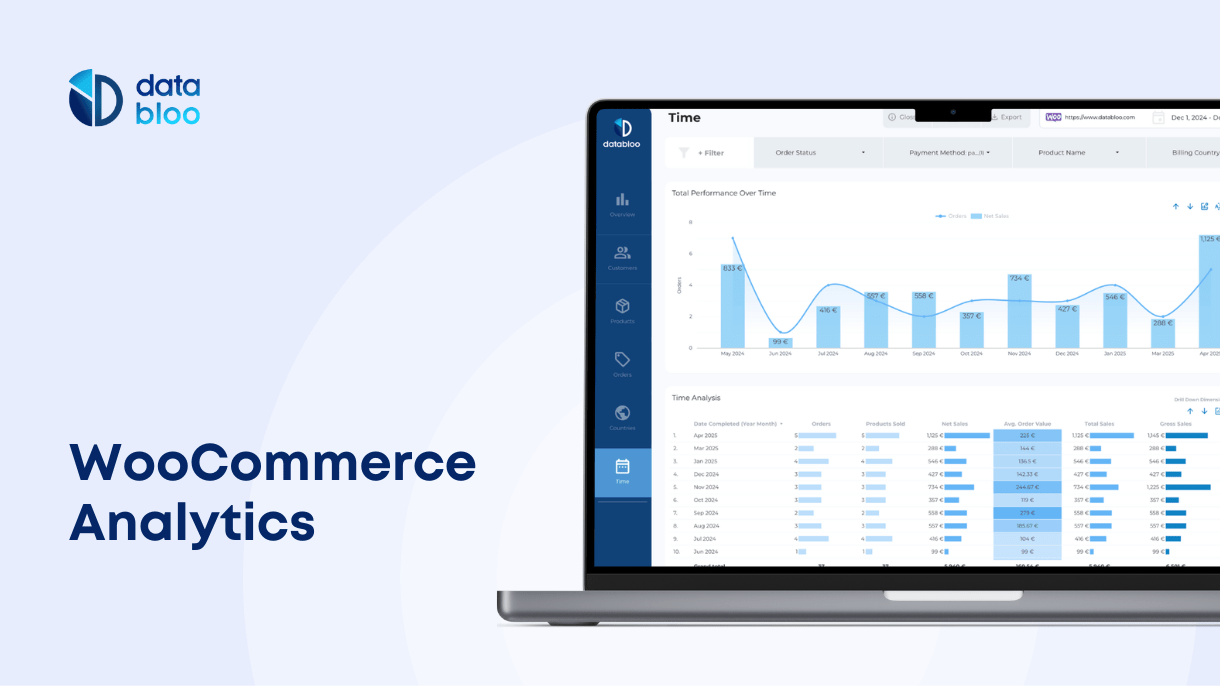
Track sales, revenue, and orders with WooCommerce Analytics. Learn reports, key metrics, and how to extend insights with Databloo.
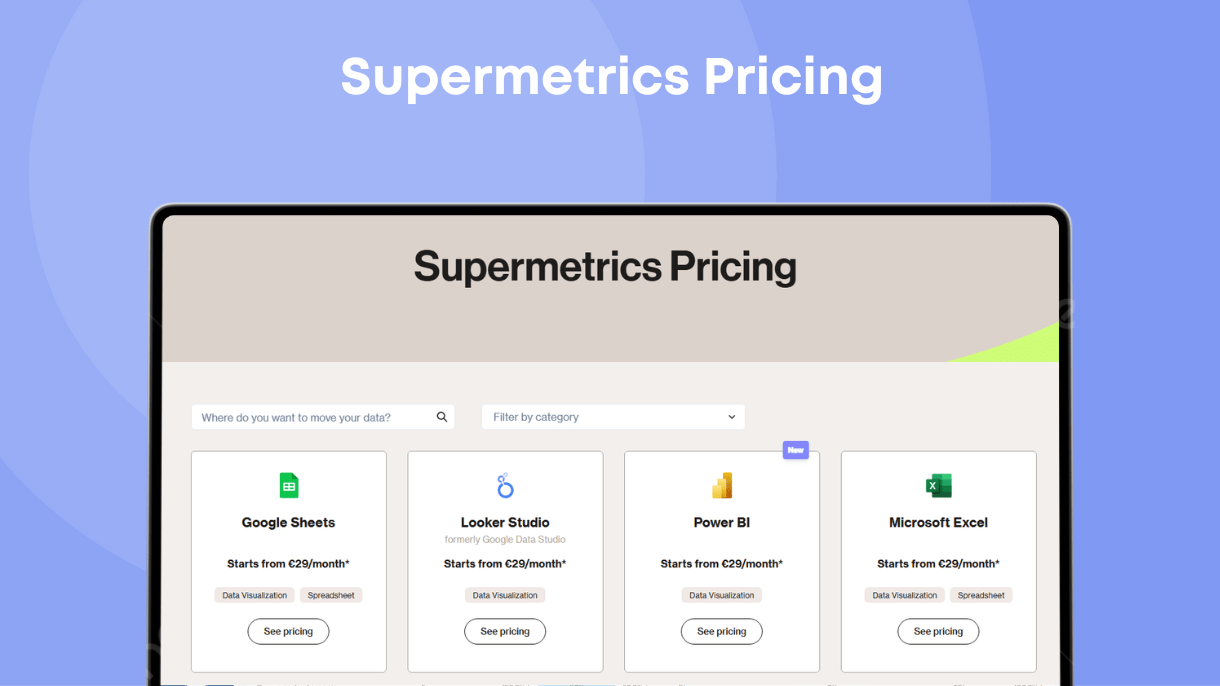
In this guide, we’ll cover what exactly you pay for in Supermetrics plans and how its pricing model compares to other similar tools.
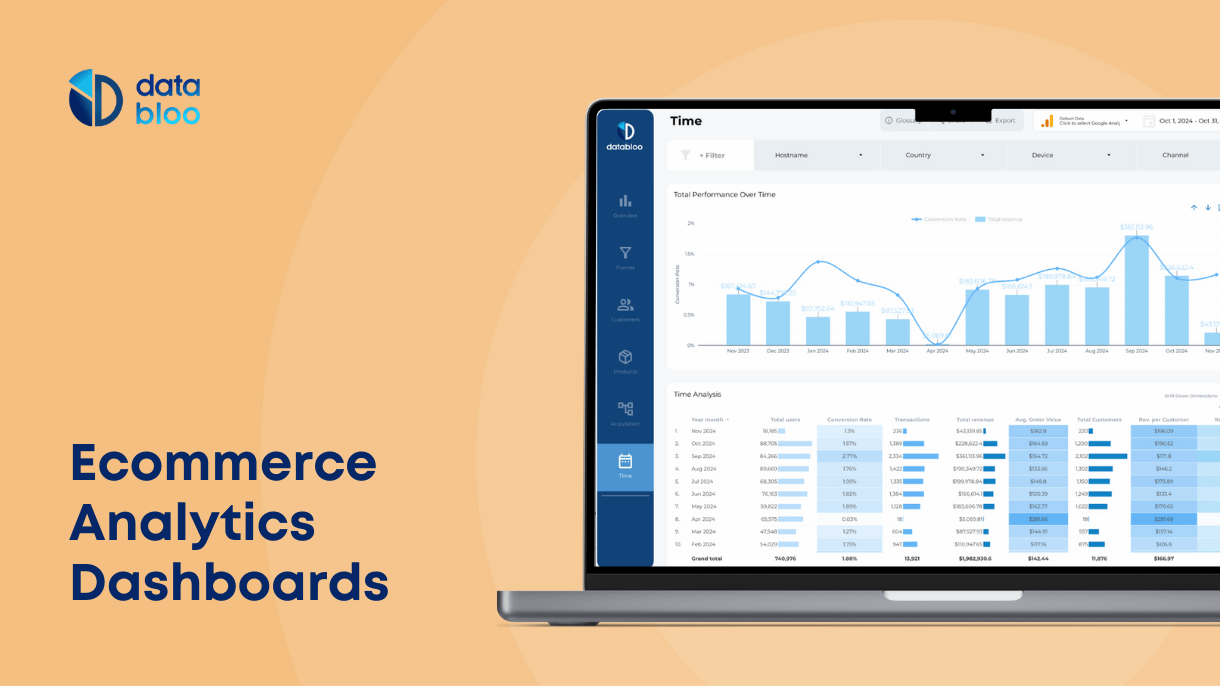
In this article, we’ll cover 5 best ecommerce dashboard options for different scenarios.
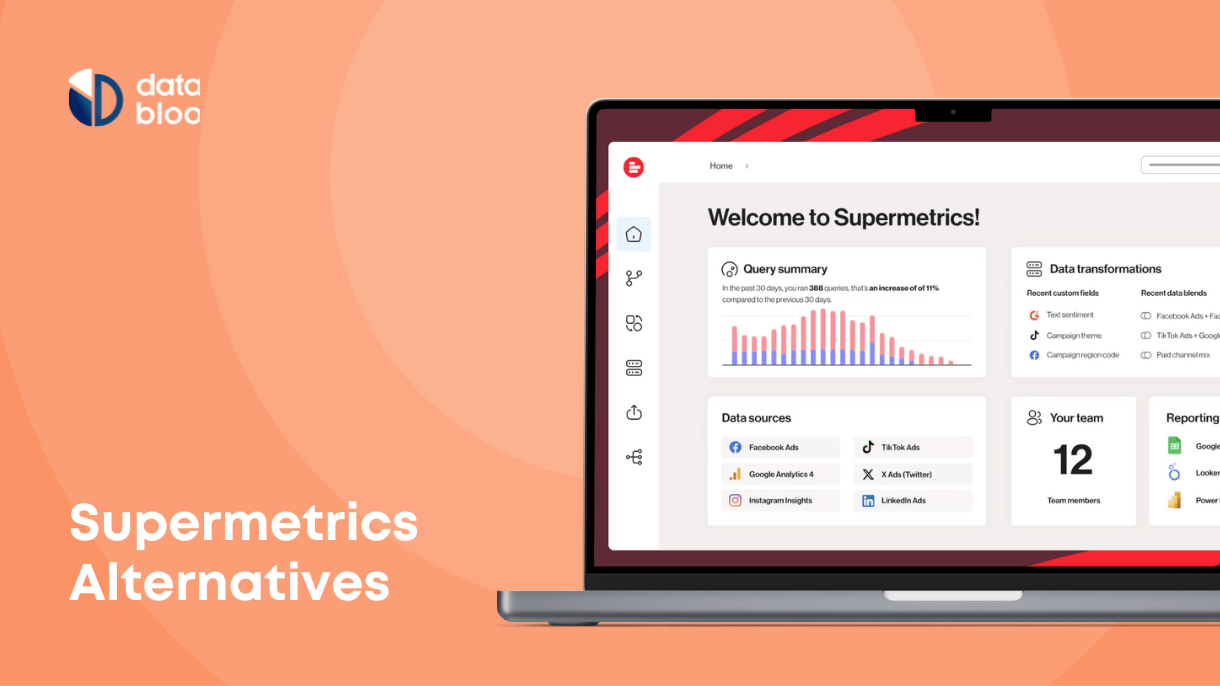
In this article, we cover 9 Supermetrics alternatives to help you find a more suitable tool for your specific project or company.
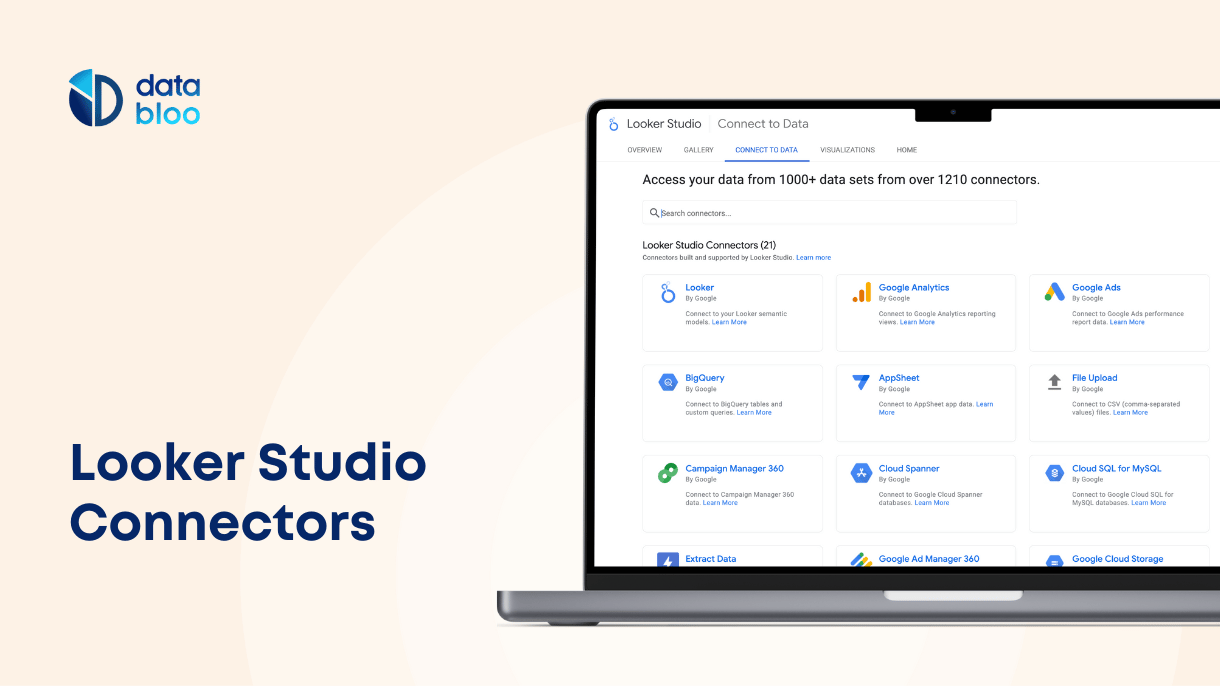
In this article we’ll cover the most essential looker studio connectors, both free and paid, and will highlight why you should be using them for your reports.
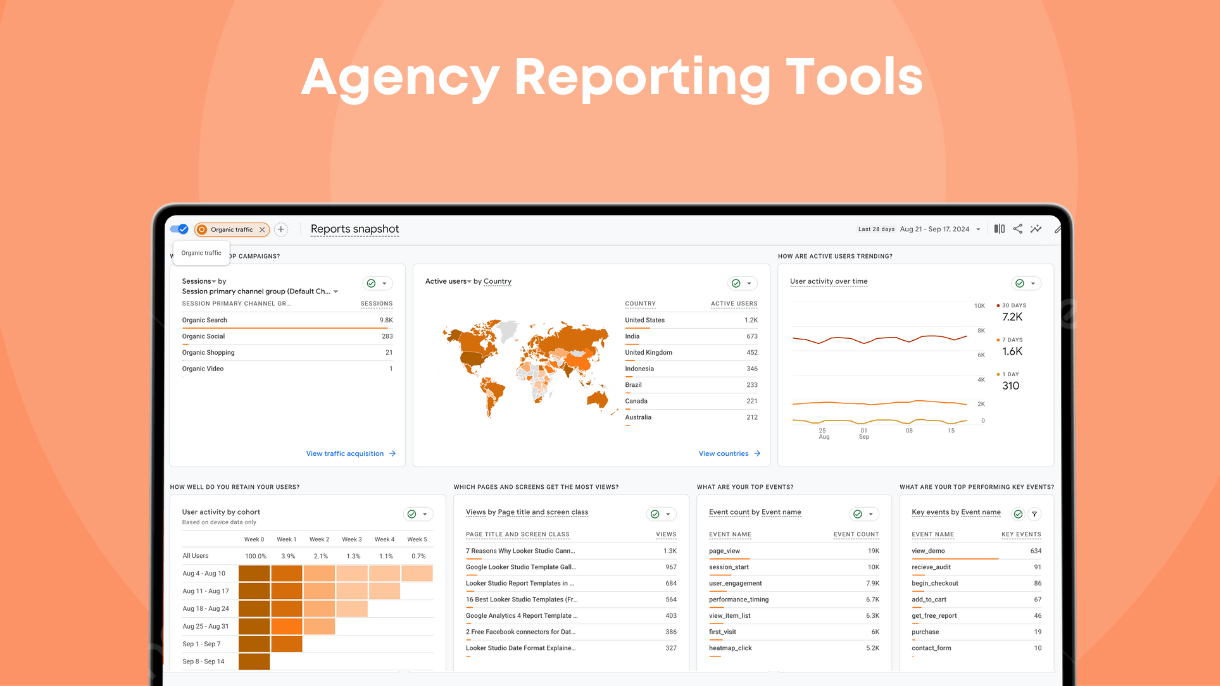
In this article we’ll cover 11 various agency reporting tools to help you create insightful, intuitive, multi-channel marketing reports.
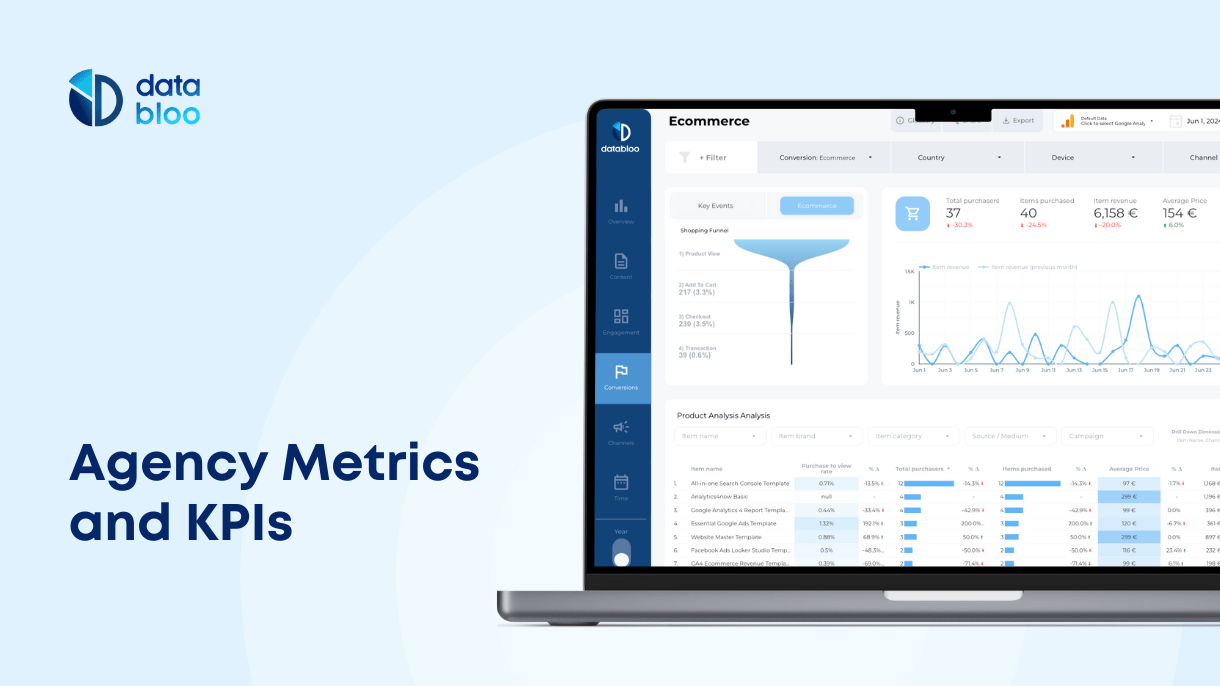
In this article, we cover the most crucial (and yet, sometimes overlooked) agency metrics.
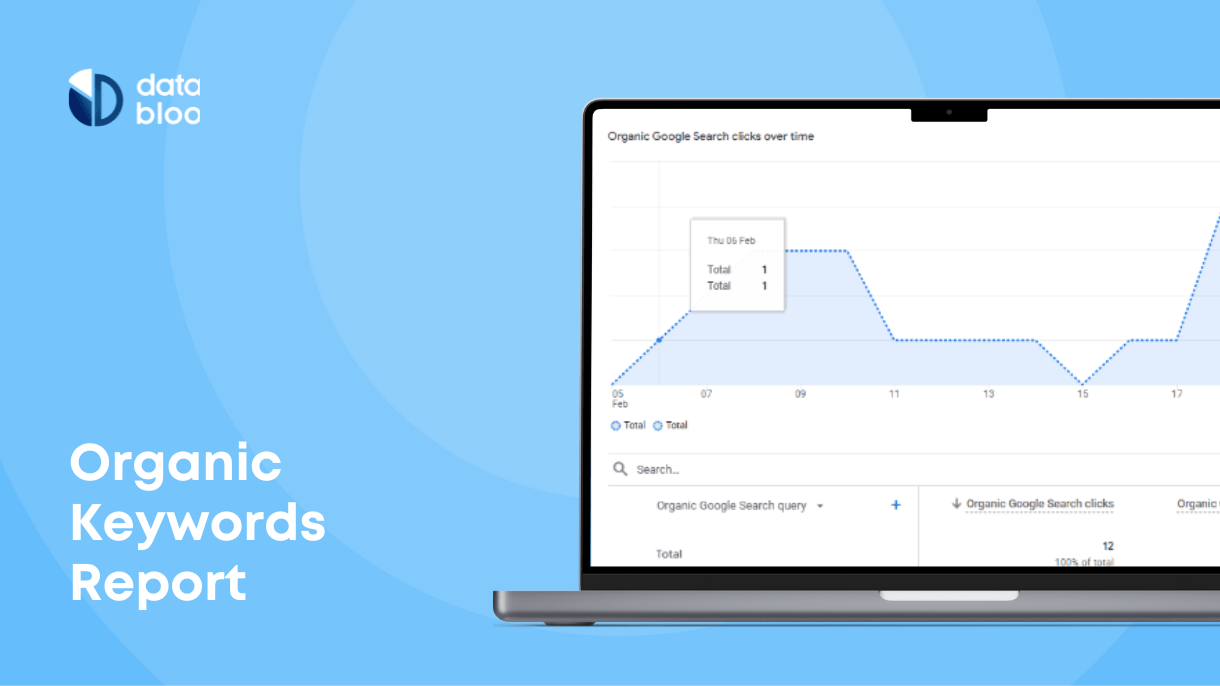
Let’s explore how you can access organic keywords data in Google Analytics, depending on the version of Google Analytics you are using, and cover alternative ways of accessing organic keywords report.
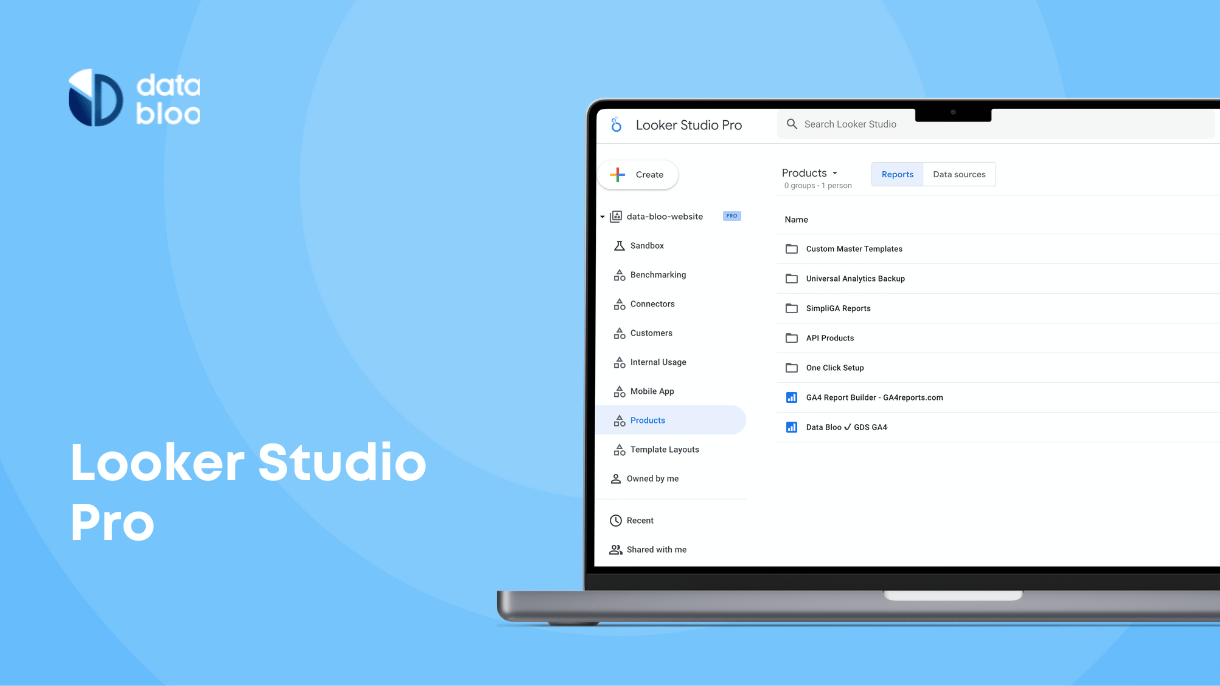
Google Looker Studio (formerly Data Studio) has long been the go-to free platform for creating interactive data visualizations. However, in
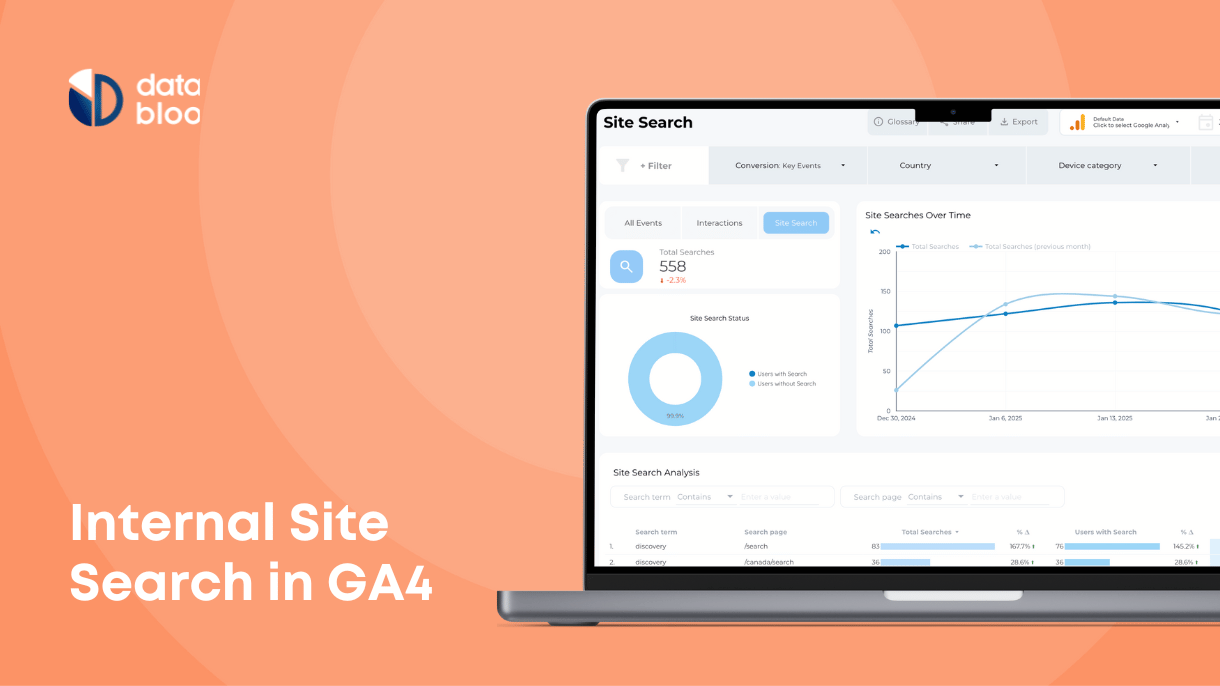
When businesses think about search analytics, they often focus on external search engines like Google or Bing. While tracking how
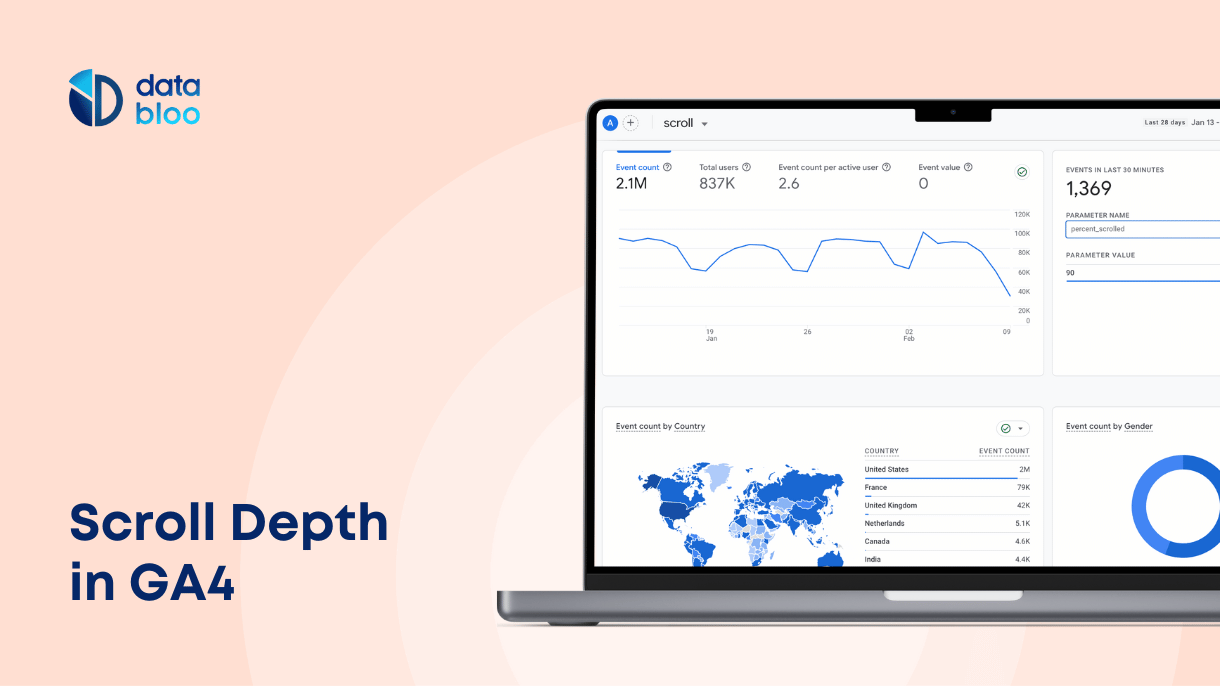
Understanding user engagement on your website is essential for optimizing content and improving user experience. Scroll depth tracking in Google
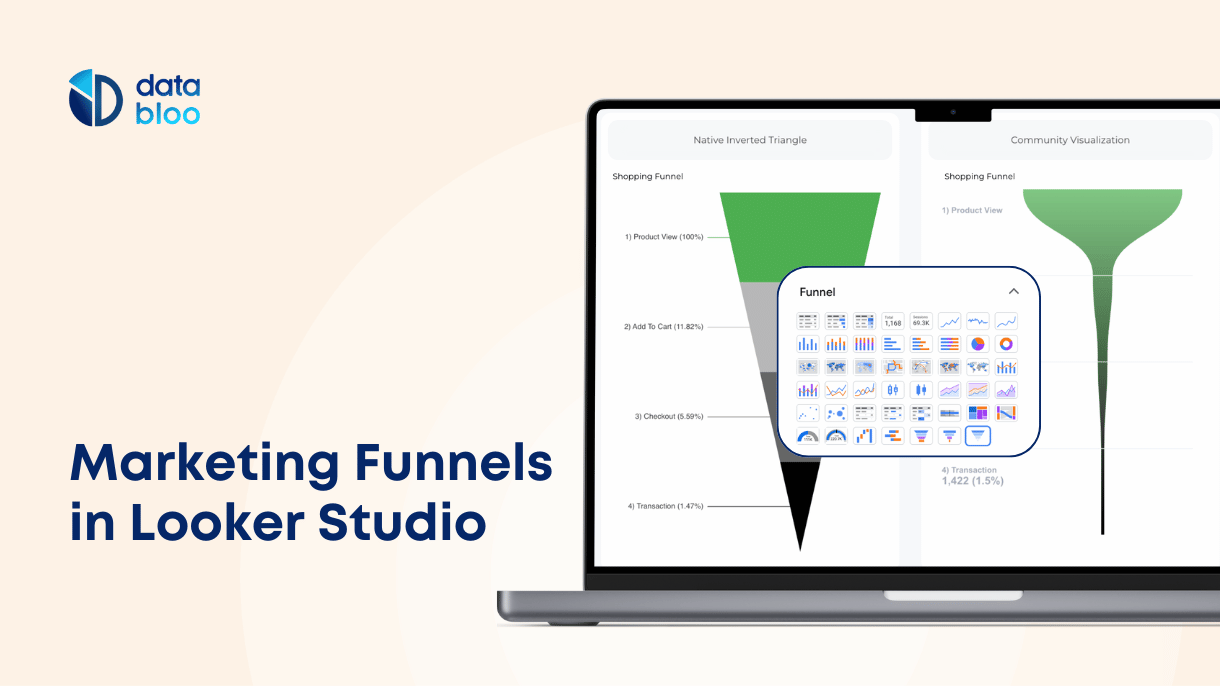
Building marketing funnels in Google Looker Studio simplify the process of tracking leads and customer behavior. They offer critical insights

Excel remains a popular data analysis tool, with over 1 billion users globally. To streamline data workflows, Looker Studio has
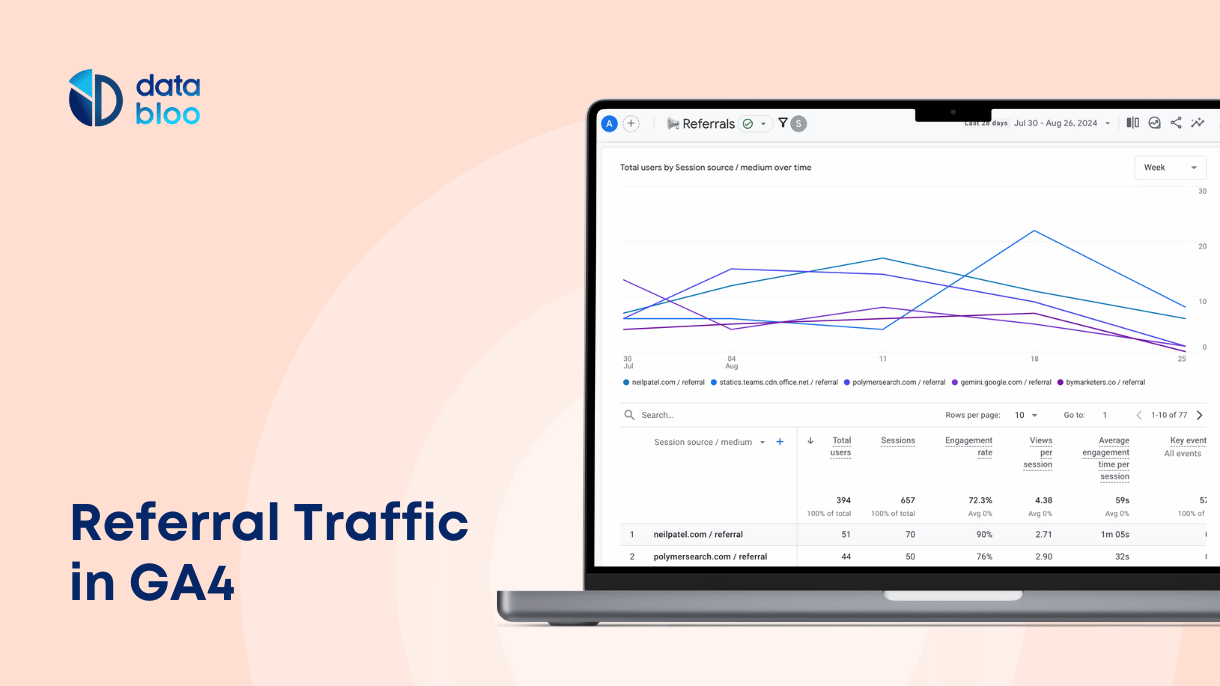
Tracking referral traffic in Google Analytics 4 (GA4) is crucial for understanding which external sources are driving visitors to your
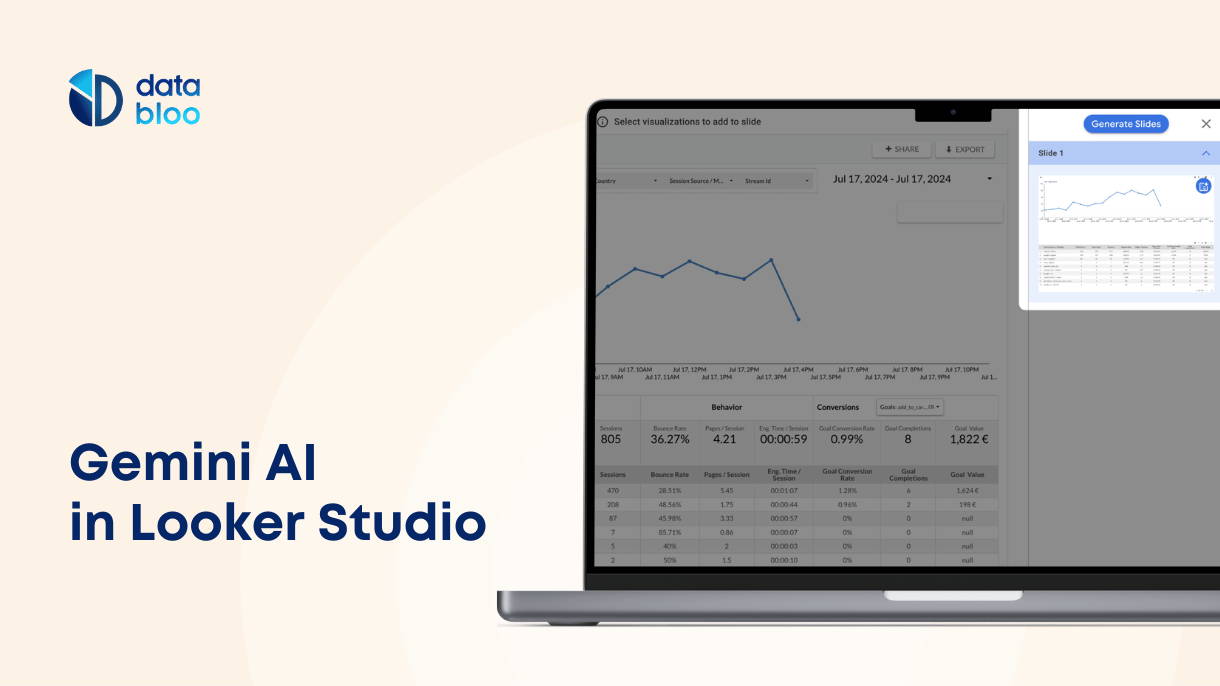
In July 2024, Google announced the introduction of Gemini AI in Looker Studio, a powerful tool designed to revolutionize data
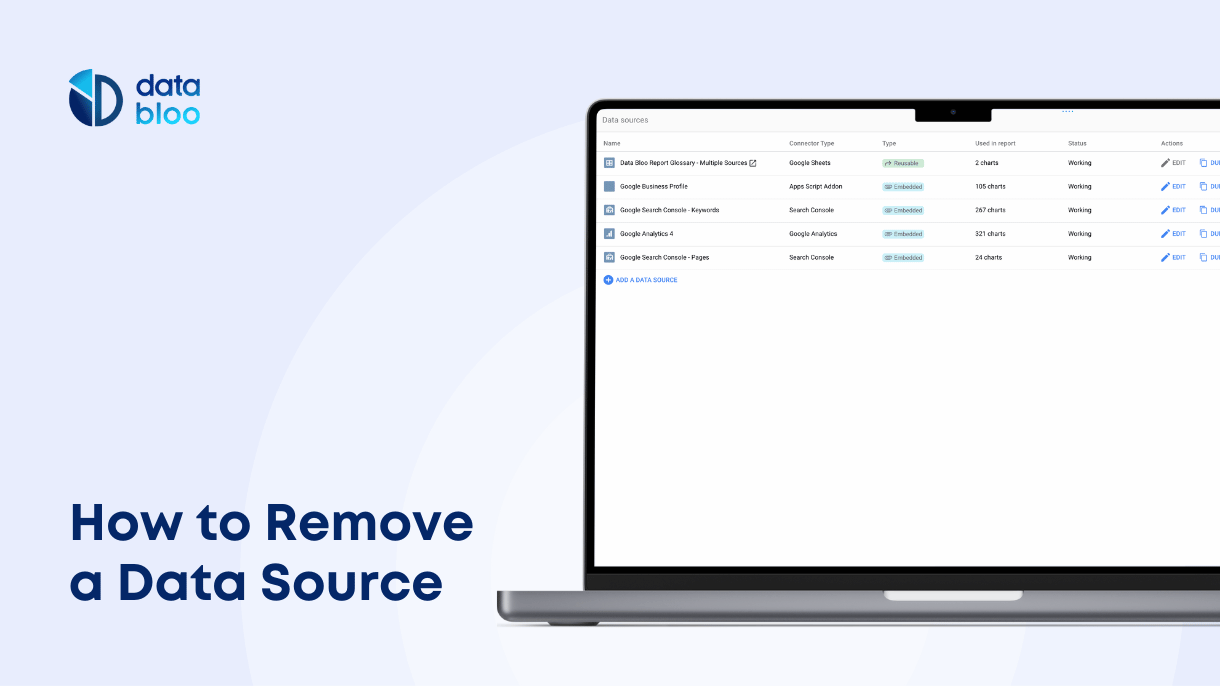
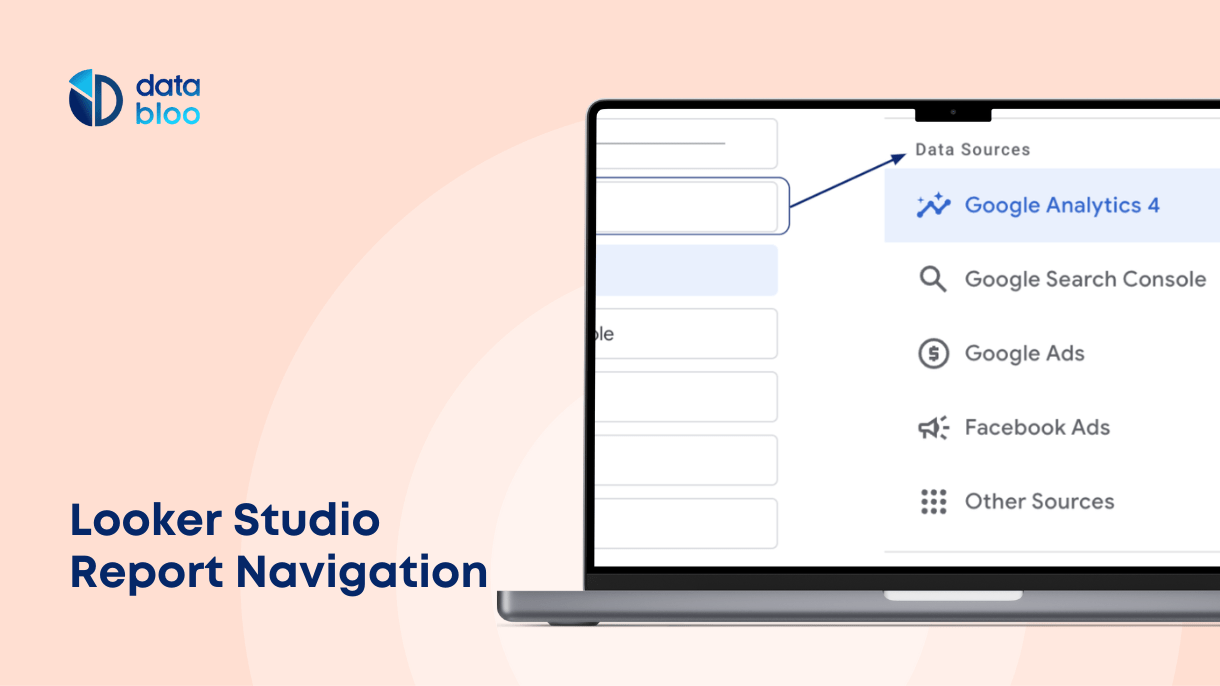
Managing your data sources effectively is crucial for maintaining the accuracy and relevance of your reports in Looker Studio. There
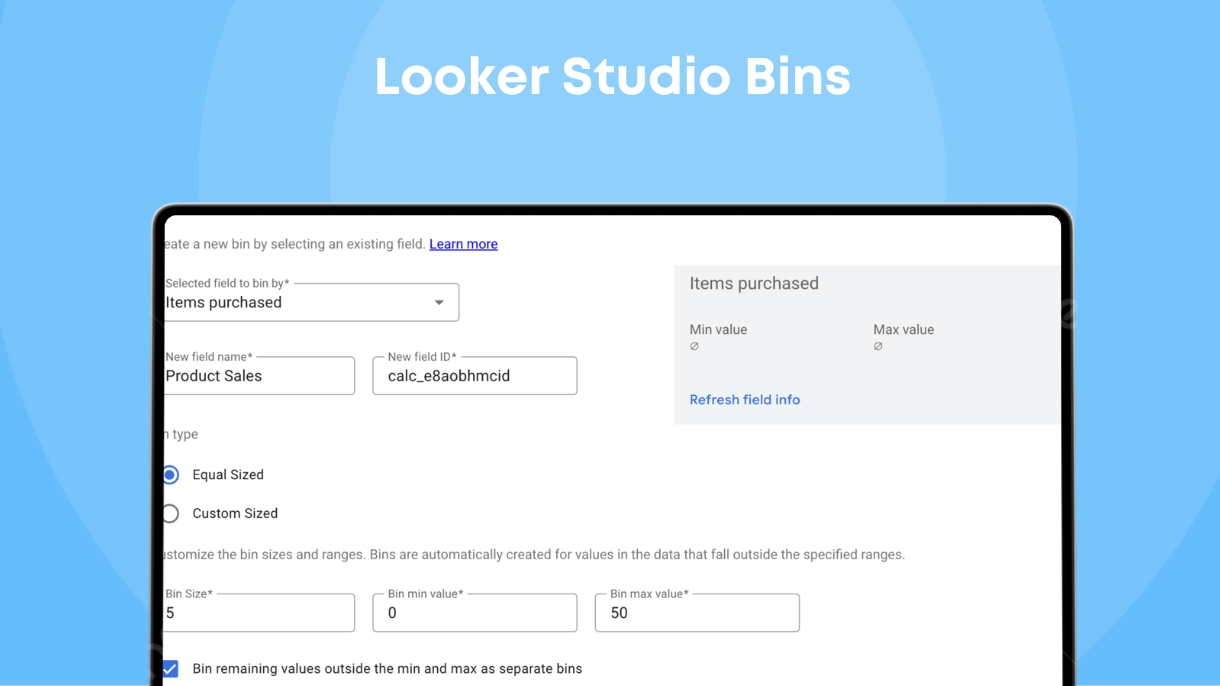
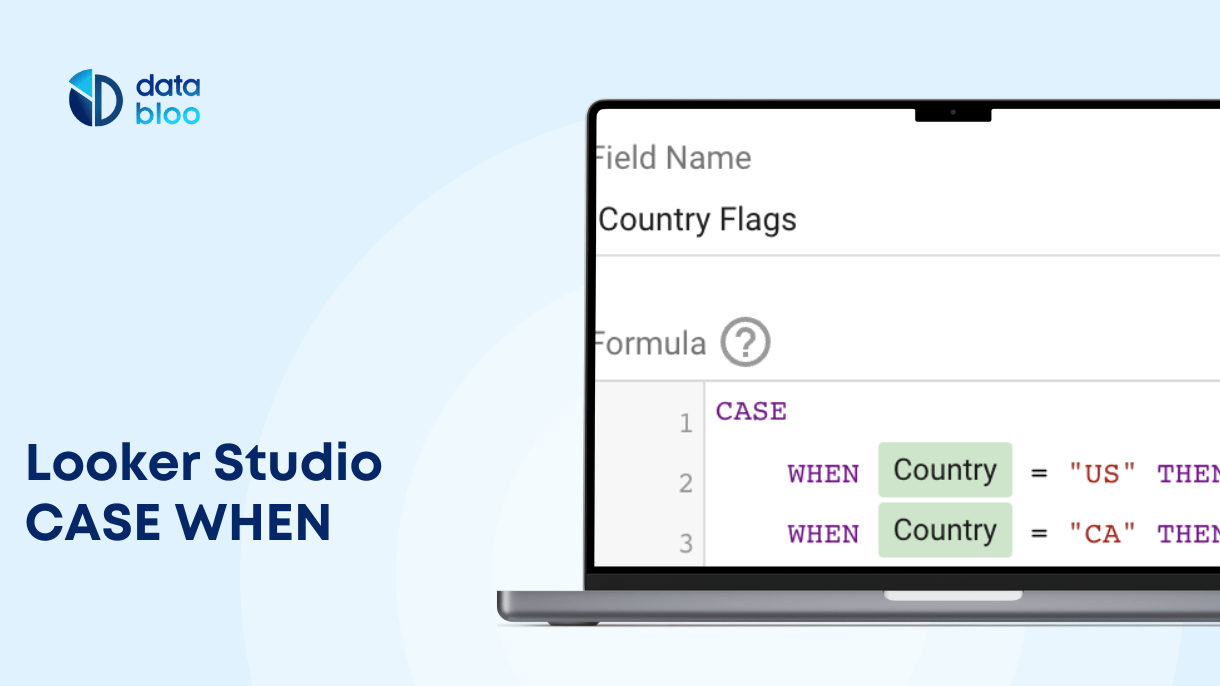
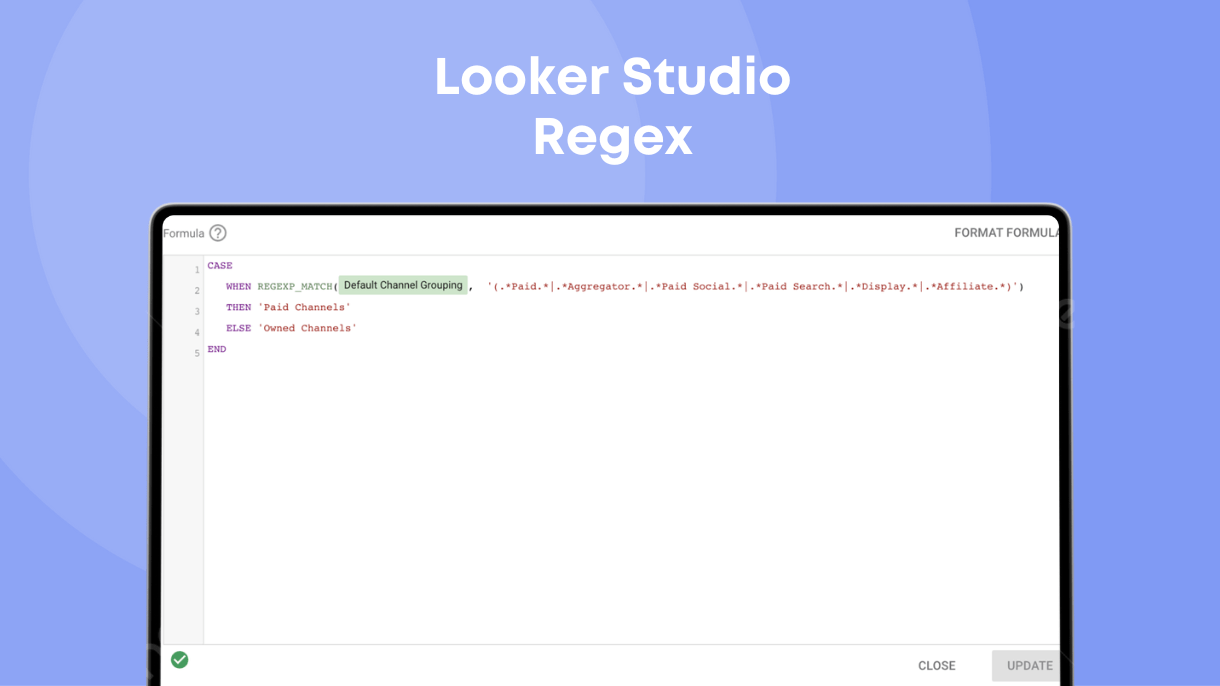
Efficient data categorization and analysis are crucial for making better decisions for your business. Google Looker Studio has introduced a
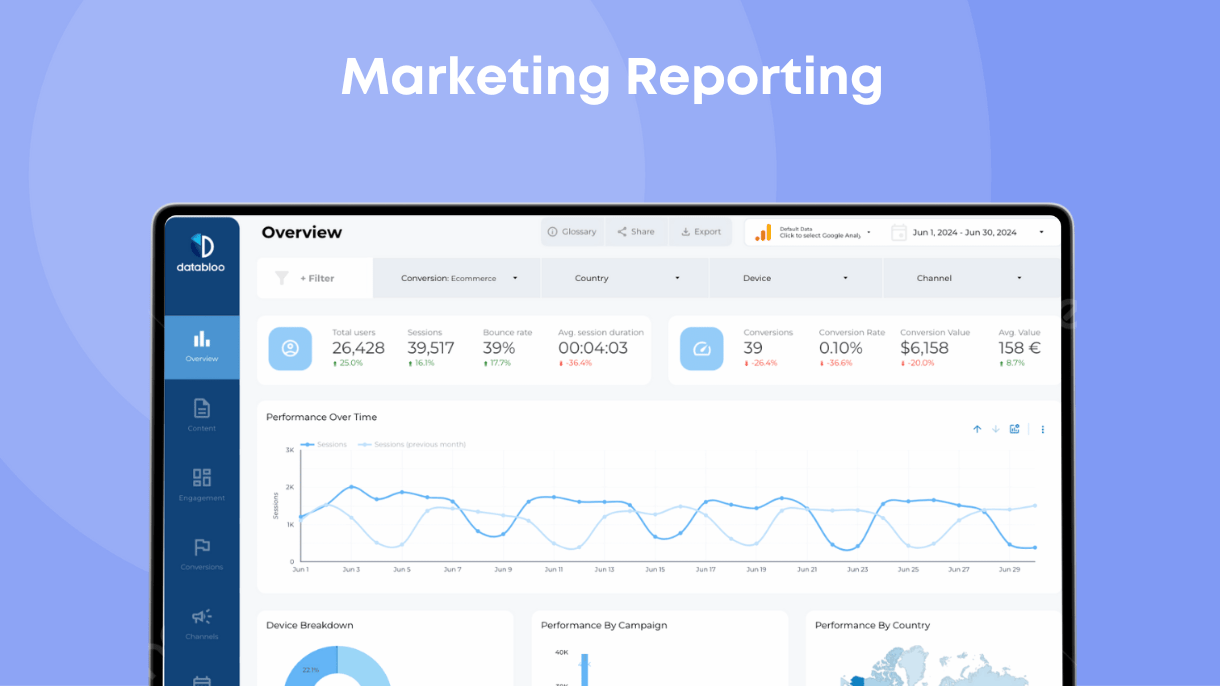
Marketing reports are not just data; they tell a story. Since people are story-driven, a well-crafted marketing report can captivate,
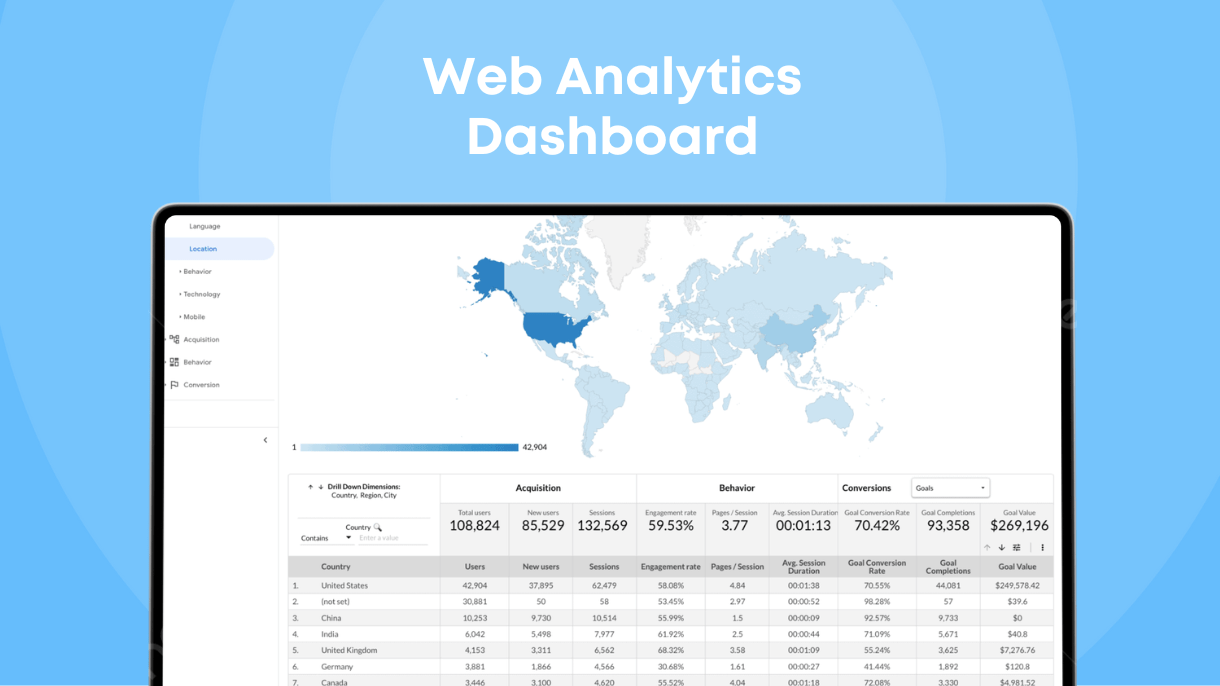
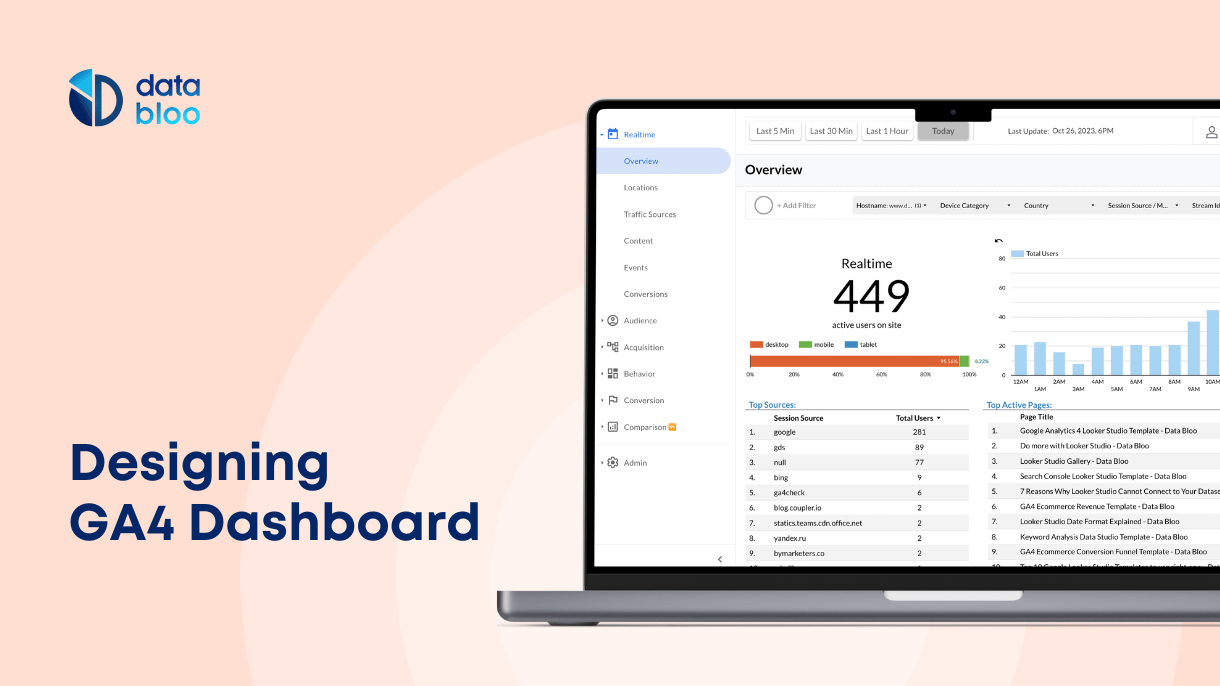
A web analytics dashboard will help you understand user behavior, report on website performance, and optimize digital strategies. It provides
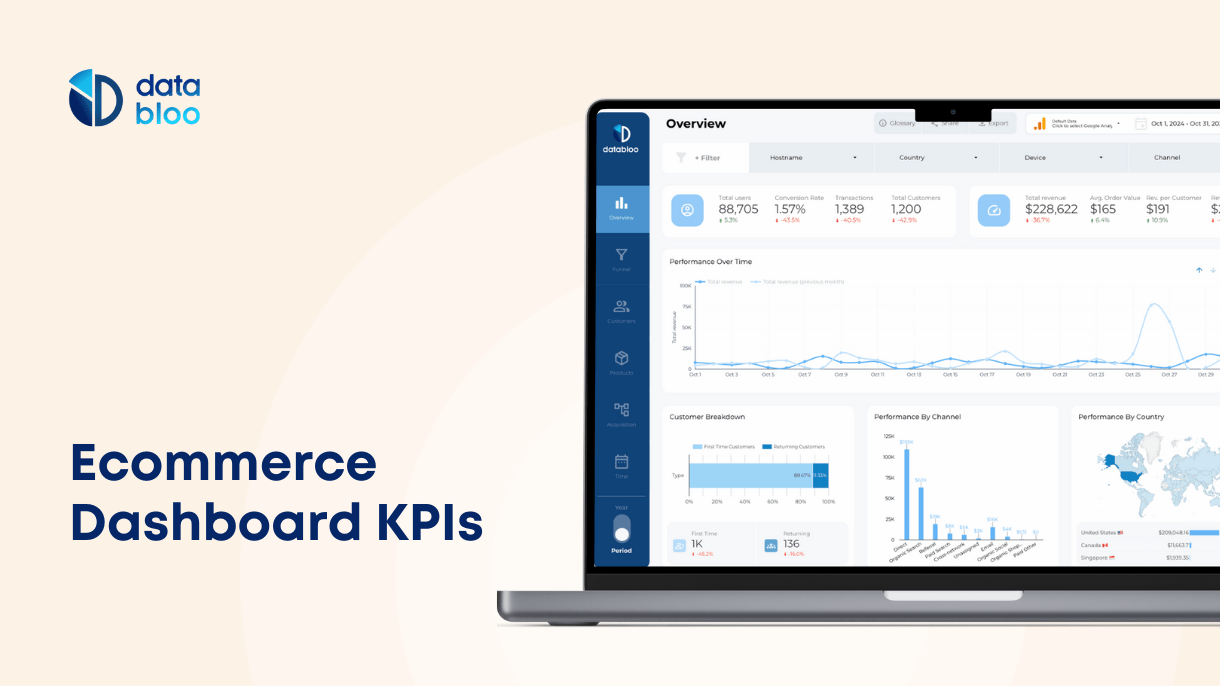
There’s no such thing as a perfect ecommerce dashboard, but you might come really close if you know what ecommerce
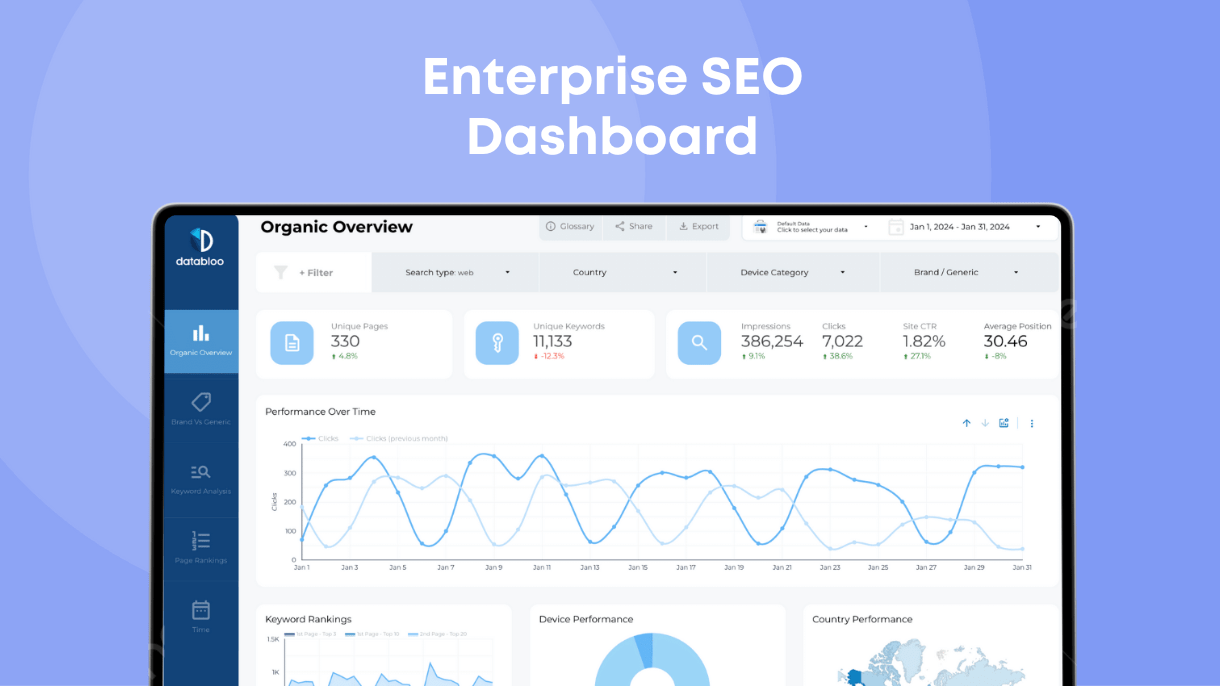
Imagine you’re an enterprise marketing manager overseeing a complex organization with multiple departments and diverse operational facets. Your challenge lies
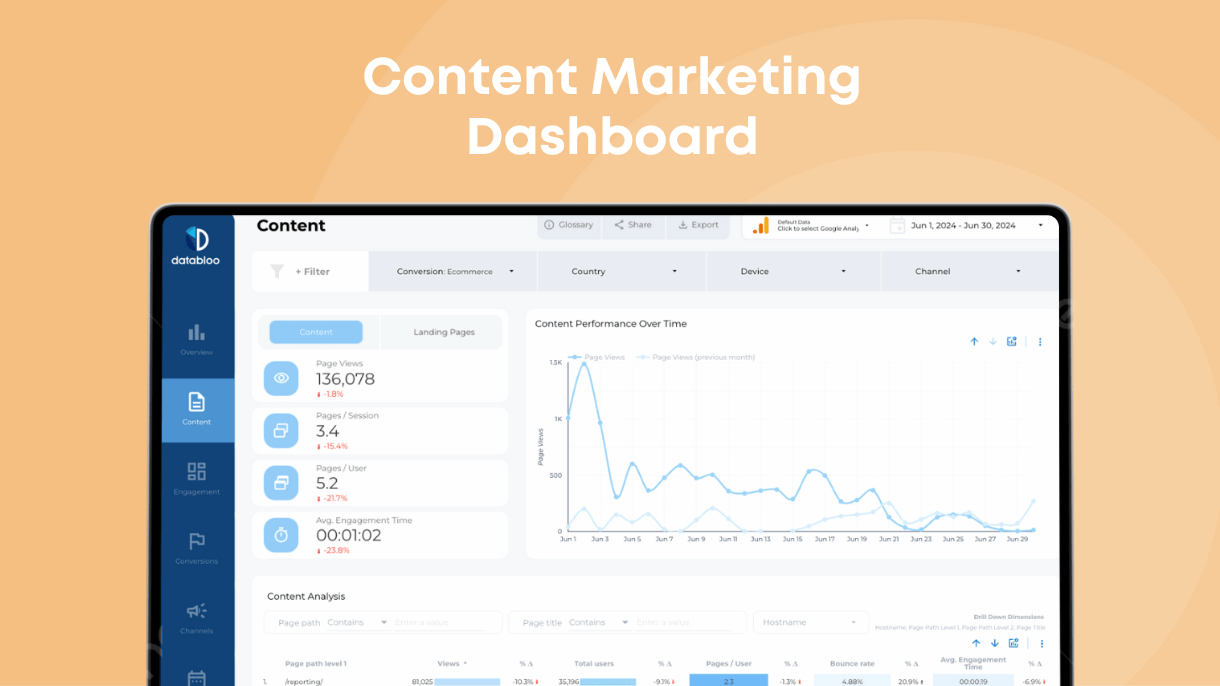
Is there a perfect content marketing dashboard? You want to track the most valuable content metrics, from page views and
One of the most important responsibilities you have as a marketer is keeping track of your analytics. This will allow

Looker Studio is an exceptional online tool that empowers you to transform data into insightful reports. If you’re facing the
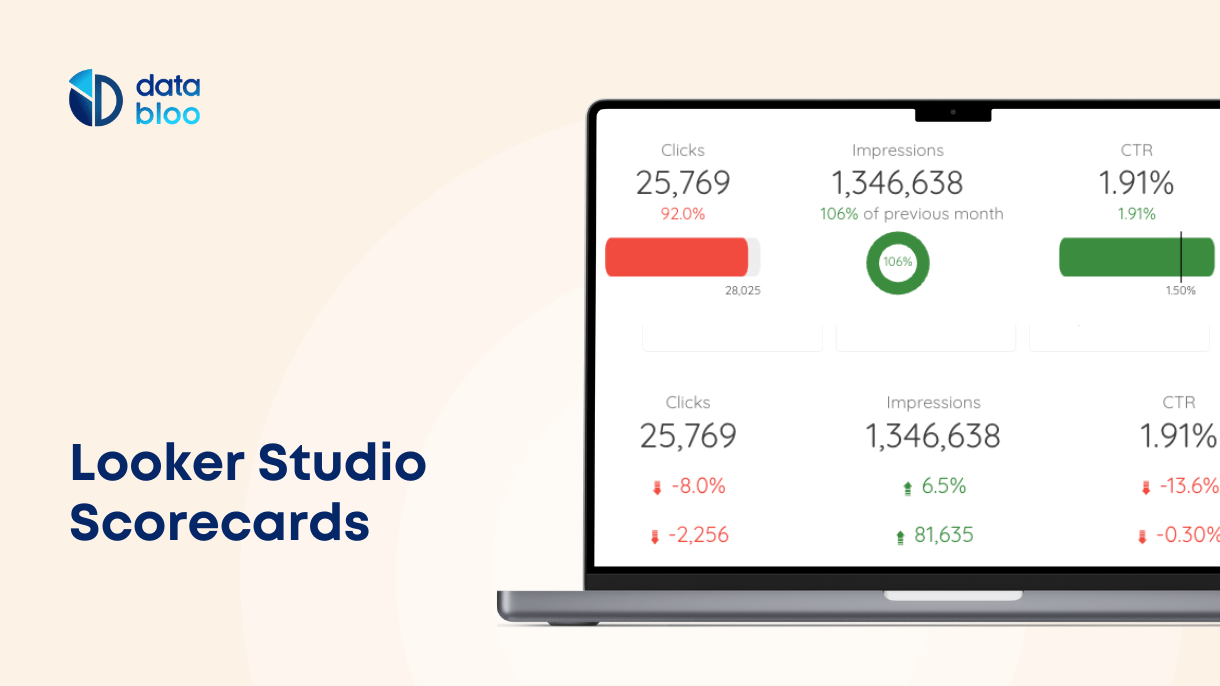
Discover the power of Looker Studio scorecards, the modern equivalent of the simple scorecards we used in school. These scorecards
Users in the modern digital world generate about 3.5 quintillion bytes of data every day. But data itself isn’t useful unless we
Analytics has become a crucial component for 60% of businesses worldwide. With its ability to streamline operations and drive better
Are you looking for a way to make data processing easier and faster for your online business? Are you still
Did you know that 94% of first impressions relate to your business website design? This is why every business needs to create
Did you know that the amount of data created daily is estimated to be 1.1 trillion MB? Data analysis is a
Did you know that there are almost 10 billion searches on Google every day? As a business, it would be great to
It’s the data and analytics age and by all indications, Google is leading the charge. Google Data Studio was released in
Currently, around 68% of businesses utilize some sort of digital marketing, and this number is growing year after year. A solid client
Did you know that over 55% of all websites use Google Analytics for site content optimization? Google Analytics is a powerful tool
A picture might be worth a thousand words, but a Looker Studio (previously known as Data Studio) report can be
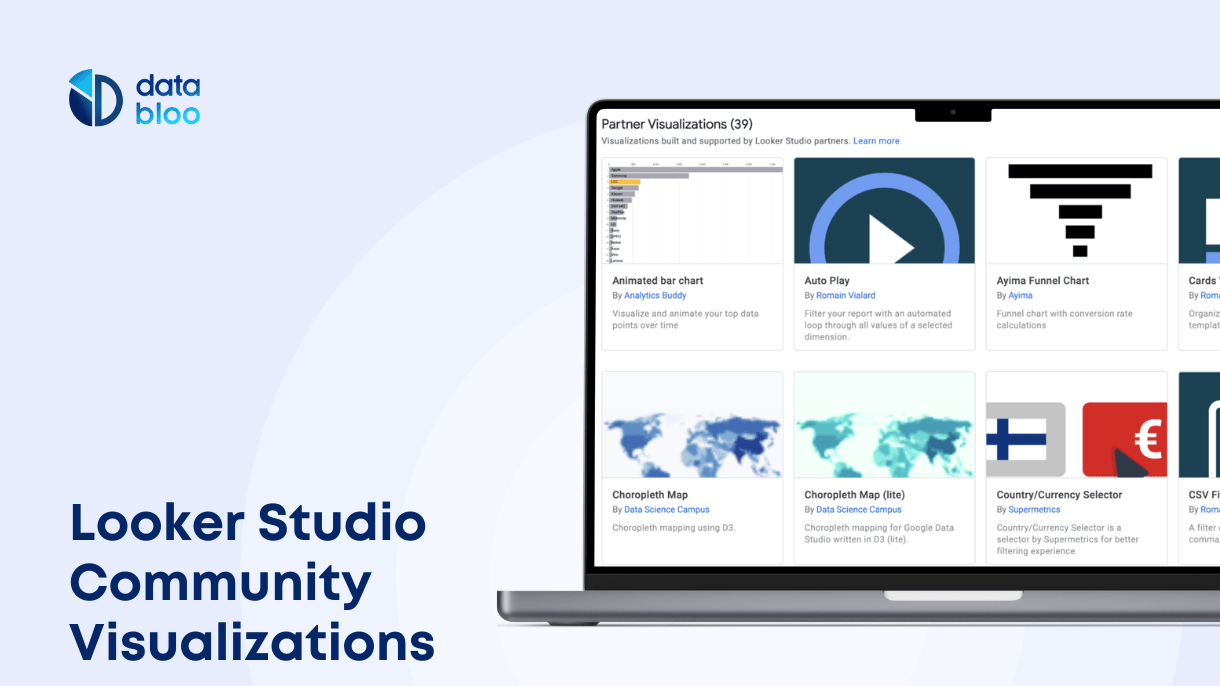
Looker Studio (formerly known as Data Studio) offers more than just drag-and-drop options for designing effective data visualizations and generating
Data visualizations use elements of design to do what our brain does naturally: create order. Instinctively, we seek to find
Spreadsheets seem very one-dimensional if you don’t know how to use them. They offer a valuable tool that functions as
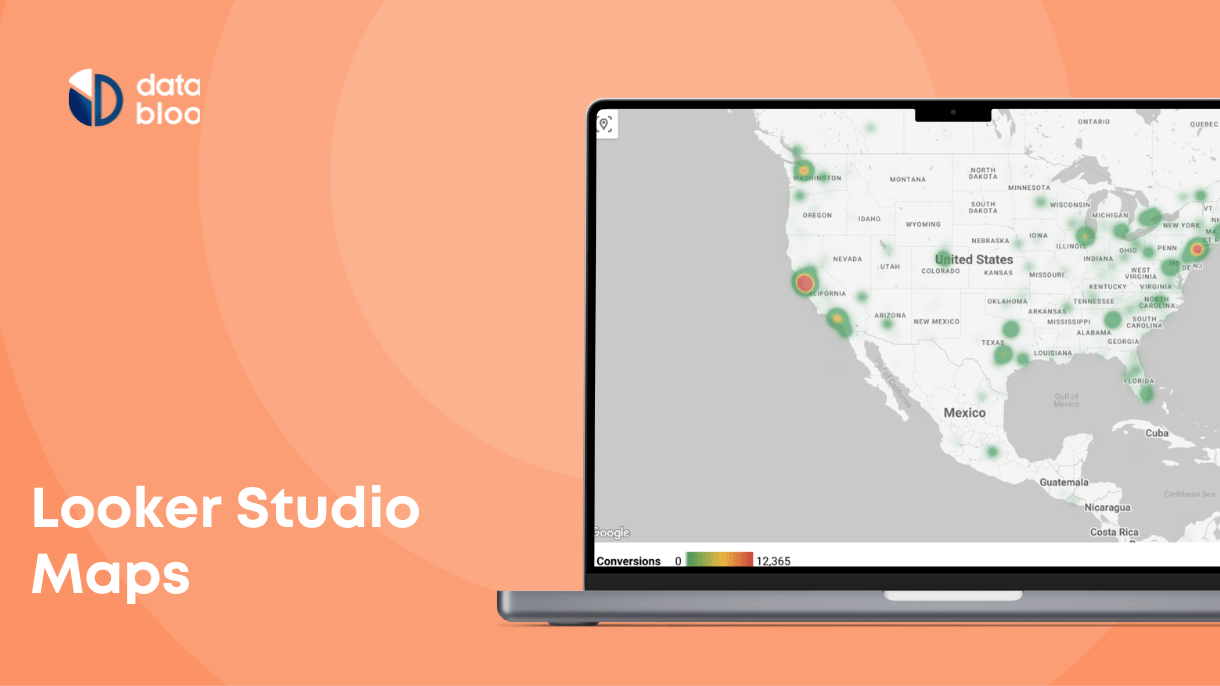
When you read the news or study most educational content, you have likely encountered a wide variety of map charts.
Do you design presentations for your business or team projects? If so, you should check out Google Looker Studio (previously
Data analysis involves a good eye and a knack for storytelling. You want graphs, charts, tables, and all other visualizations
Did you know that between 30 and 50 million websites across the web use Google Analytics? Analytics tools are a great way
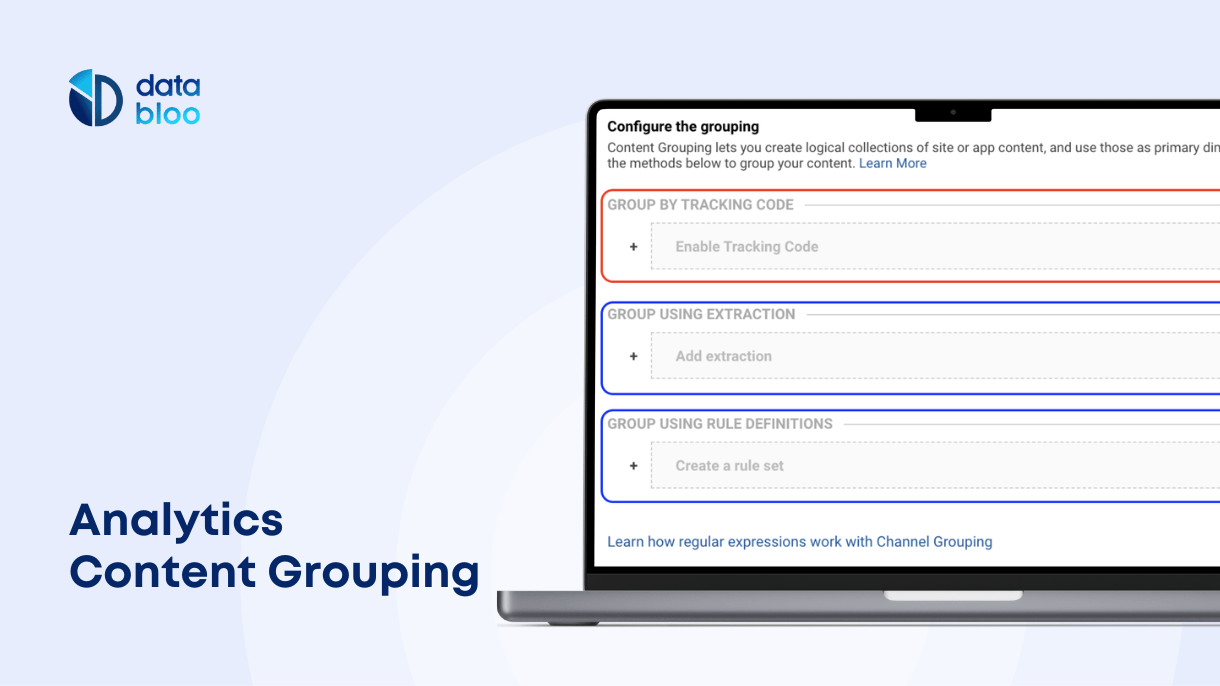
Understanding which type of content can effectively grab a visitor’s attention is crucial to growing your visitors and increasing conversions.
46% of product searches begin on Google. That initial search is what leads to traffic to your website. But once the
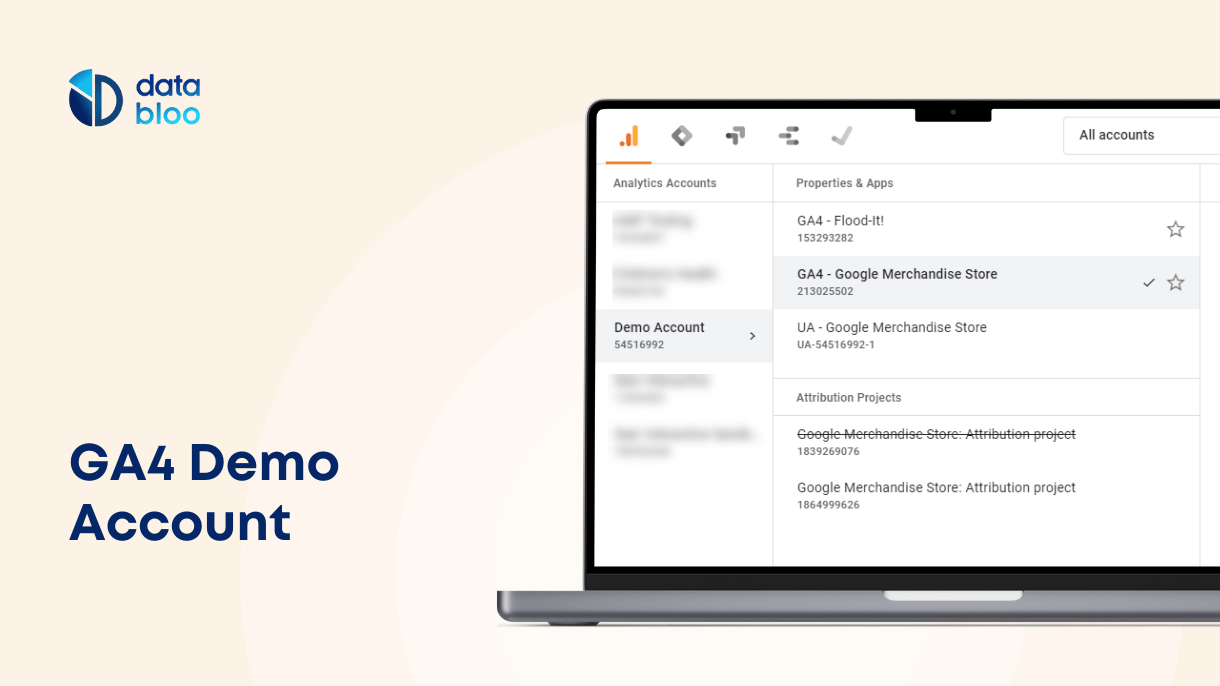
Google Analytics 4 demo account is the best way to learn GA4 easily and practice without stress. If you are
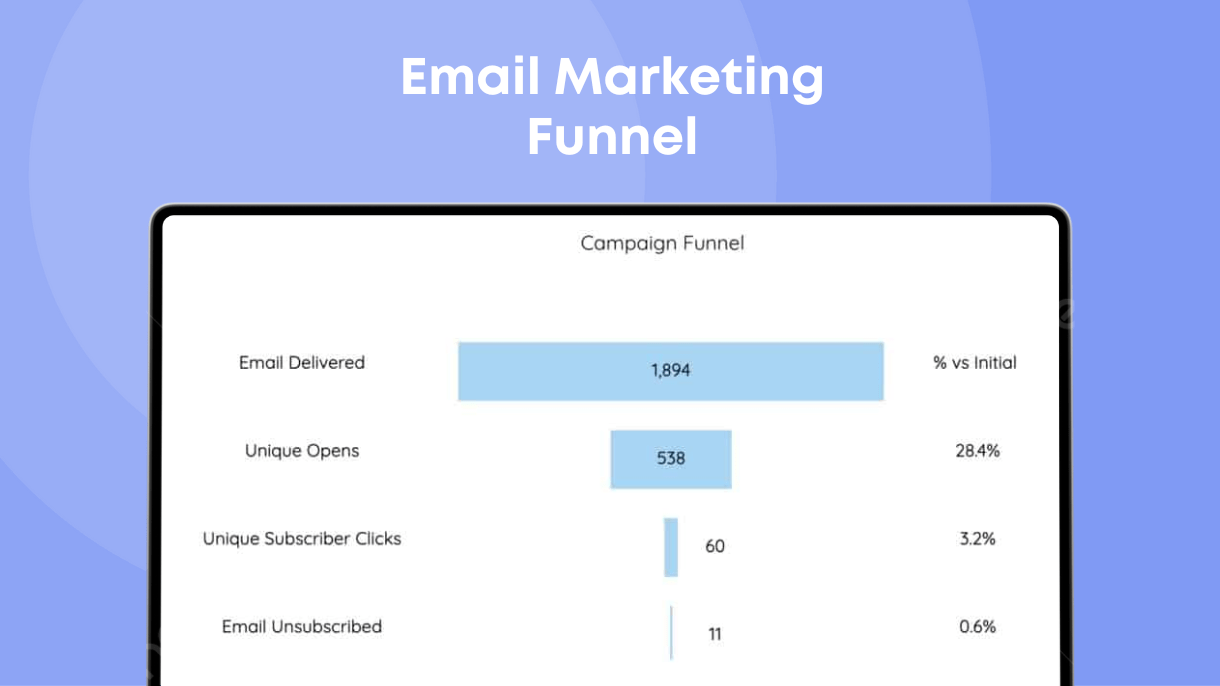
It’s often helpful to think of your online business in terms of funnels. Funnels are a great visualization that makes
Google Analytics, the #1 web analytics platform on the web, has become the most valuable tool for digital marketers who
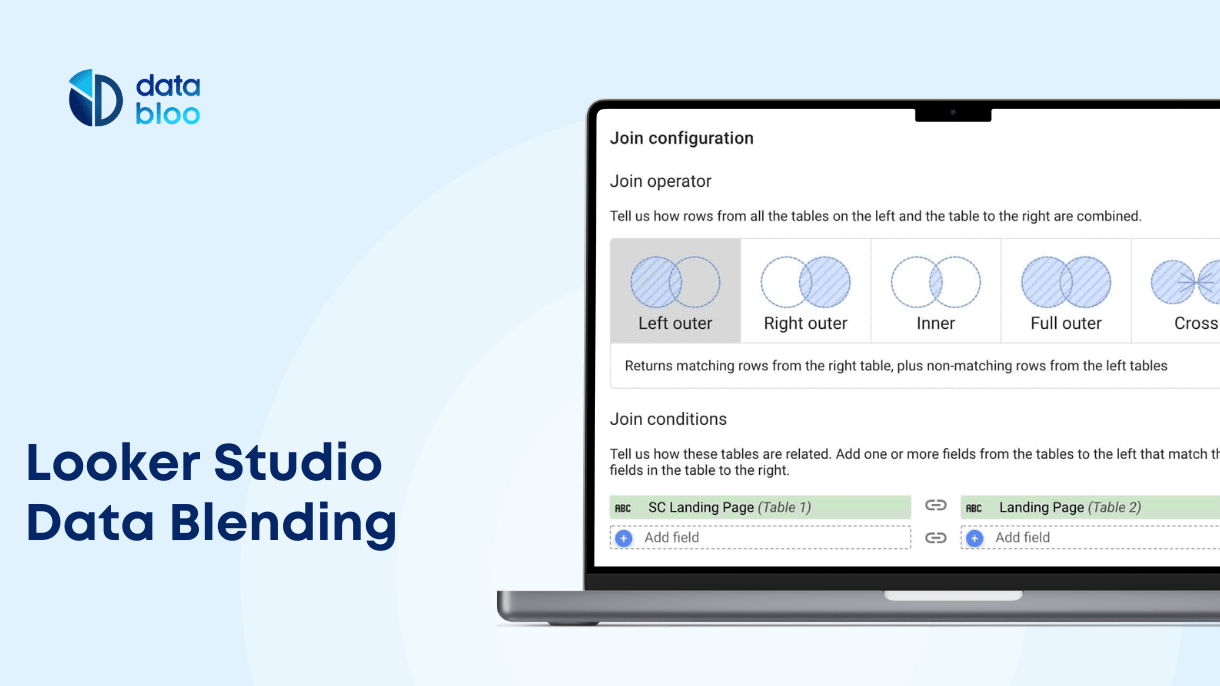
Data Blending in Google Data Studio (previously Looker Studio) is the perfect way to upgrade your digital reports. This unique
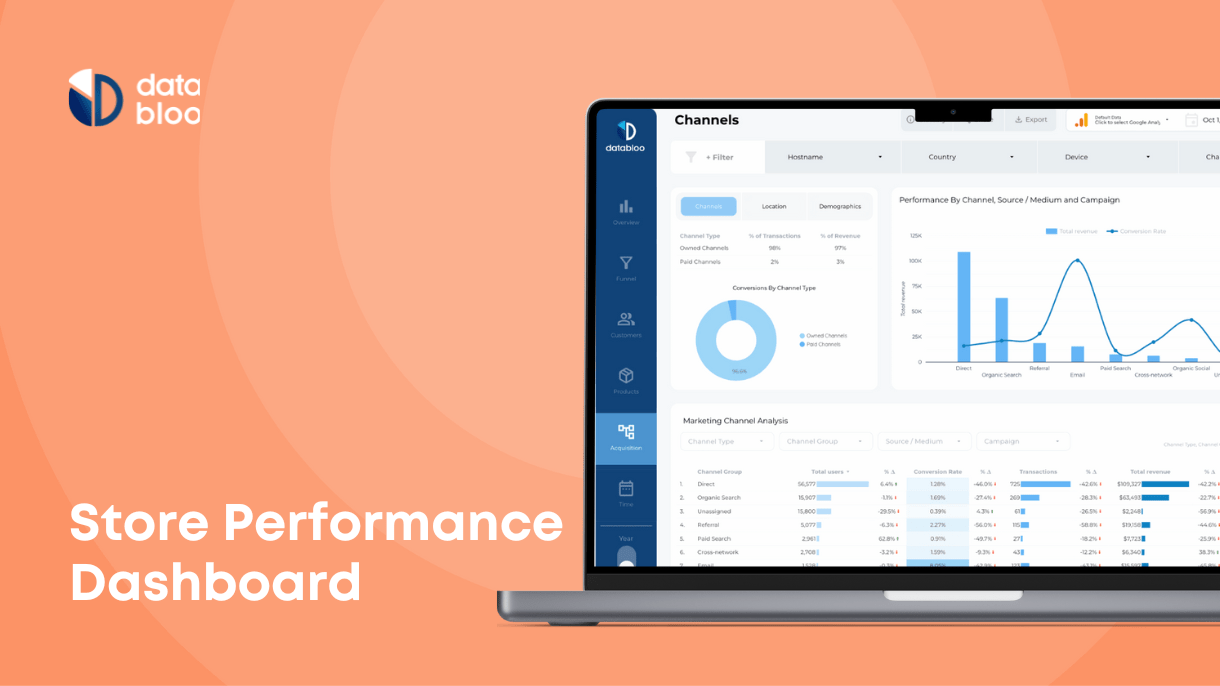
A store performance dashboard has become a necessity for all retail stores. If you own an online retail store, it
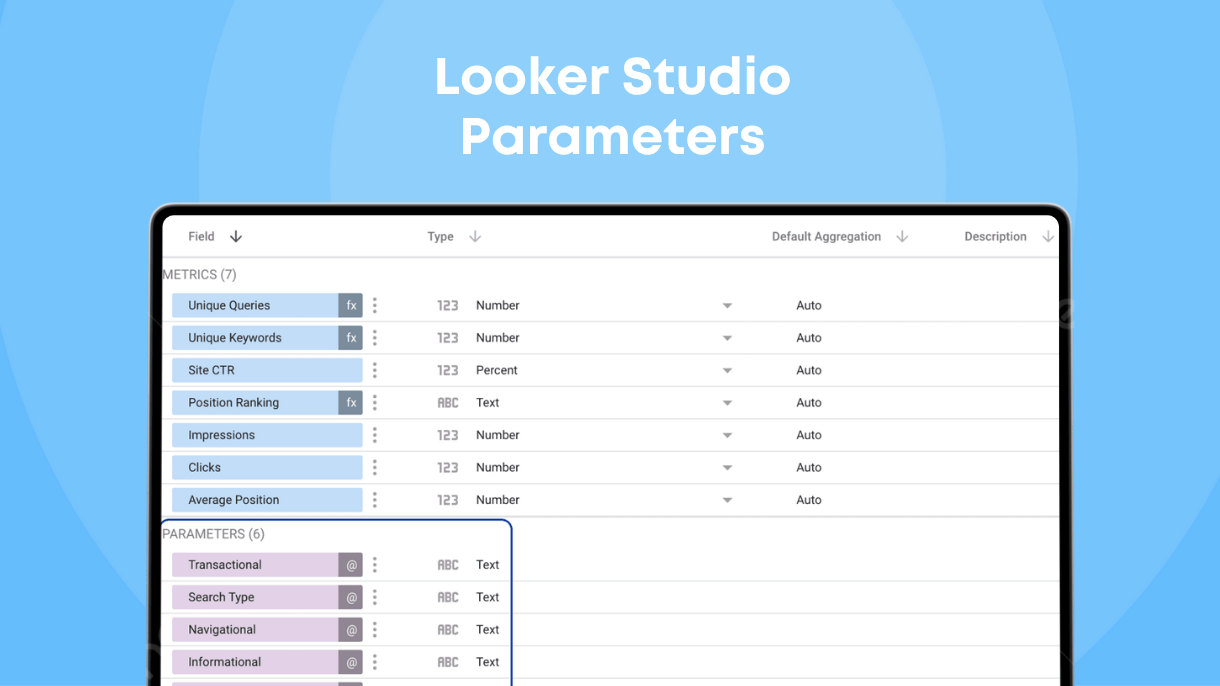
Google Looker Studio parameters are one of the many interesting features that can help you customize your reports. The Looker
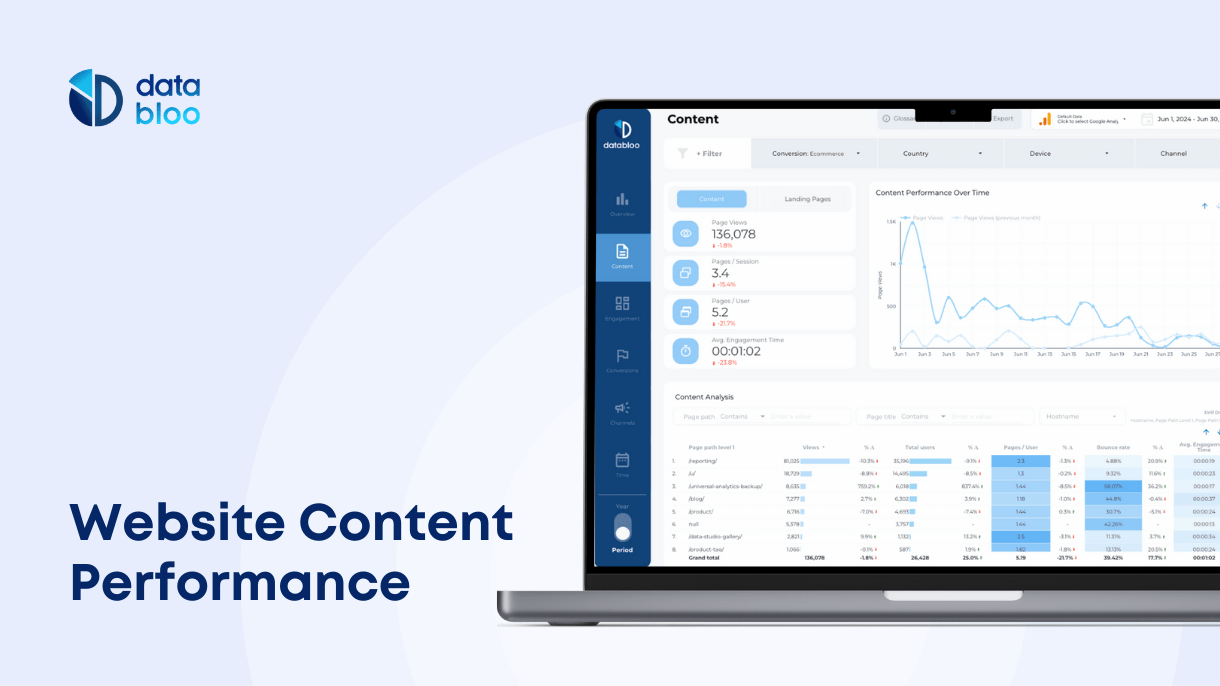
Intro to content Performance Content is the king – We all know that. But if you can’t evaluate its effectiveness,
Google recently announced that Universal Analytics (UA) will eventually be replaced by the newest version of Google Analytics (Google Analytics
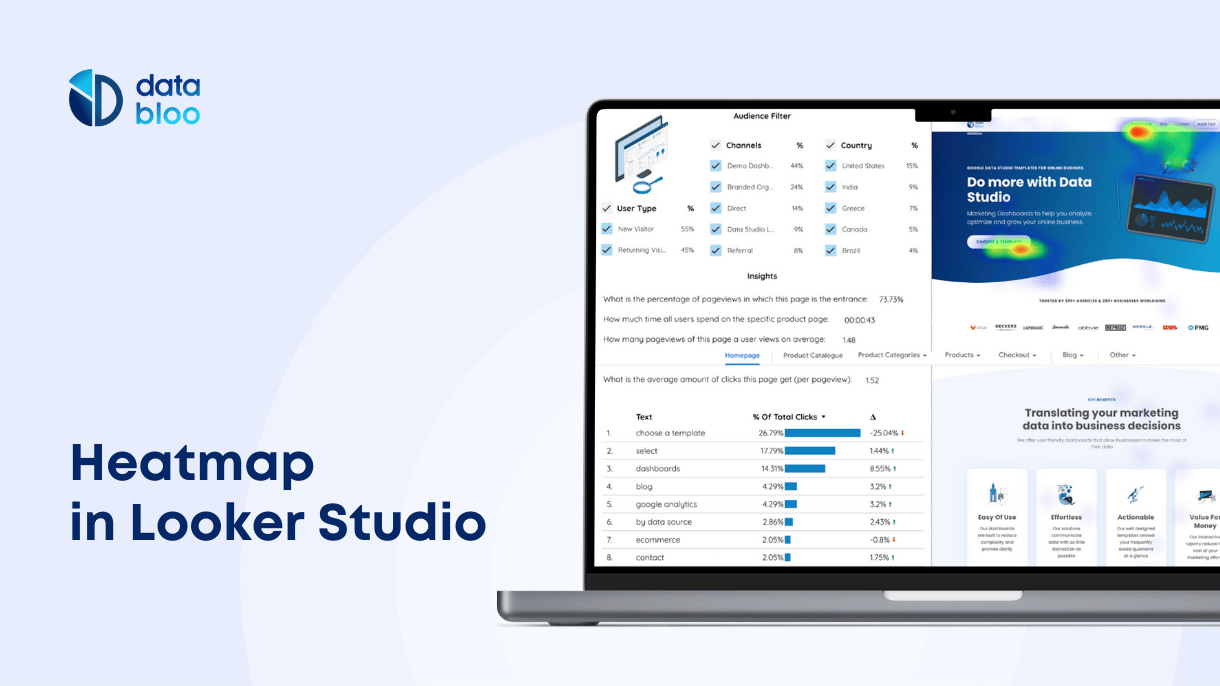
What is a Heatmap Heatmap or Heat Map is an amazing way to discover what your users are clicking and
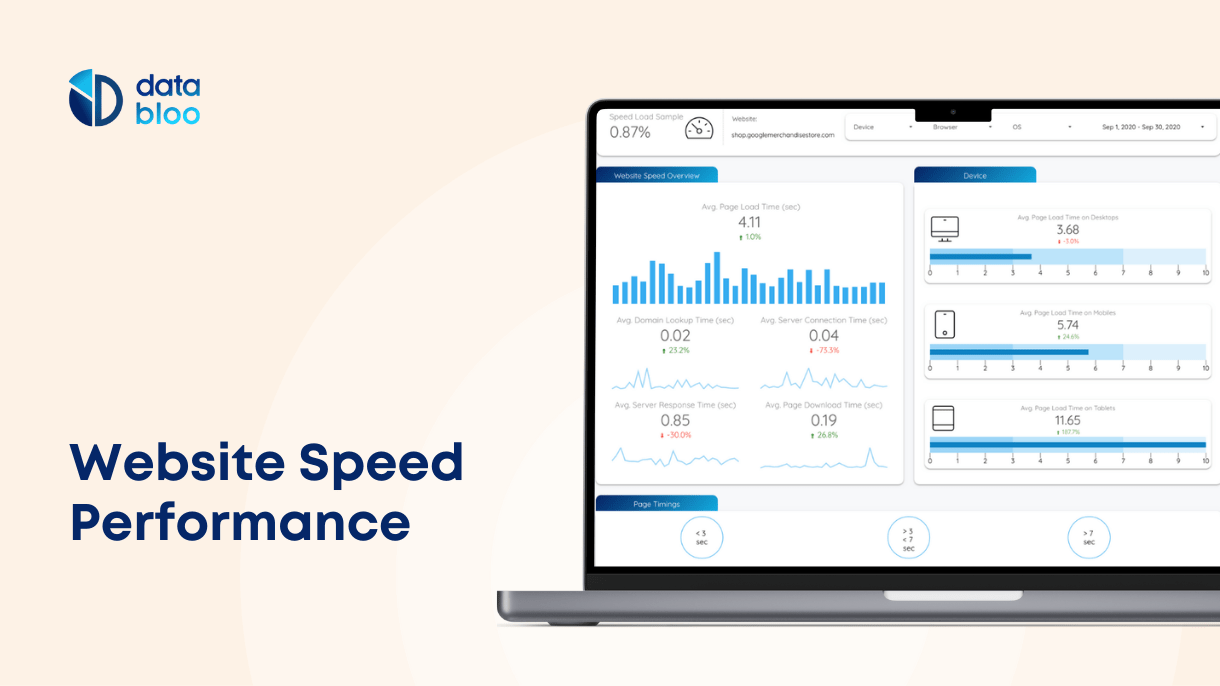
The website speed performance is one of the most important success factors for the ecommerce businesses today. Every marketeer should