Table of Contents
In this article we’ll show you how a designated Google My Business can help you grow your local business by providing quick and in-depth insights and ensuring your reporting is regular and hassle-free.
Let’s dive in!
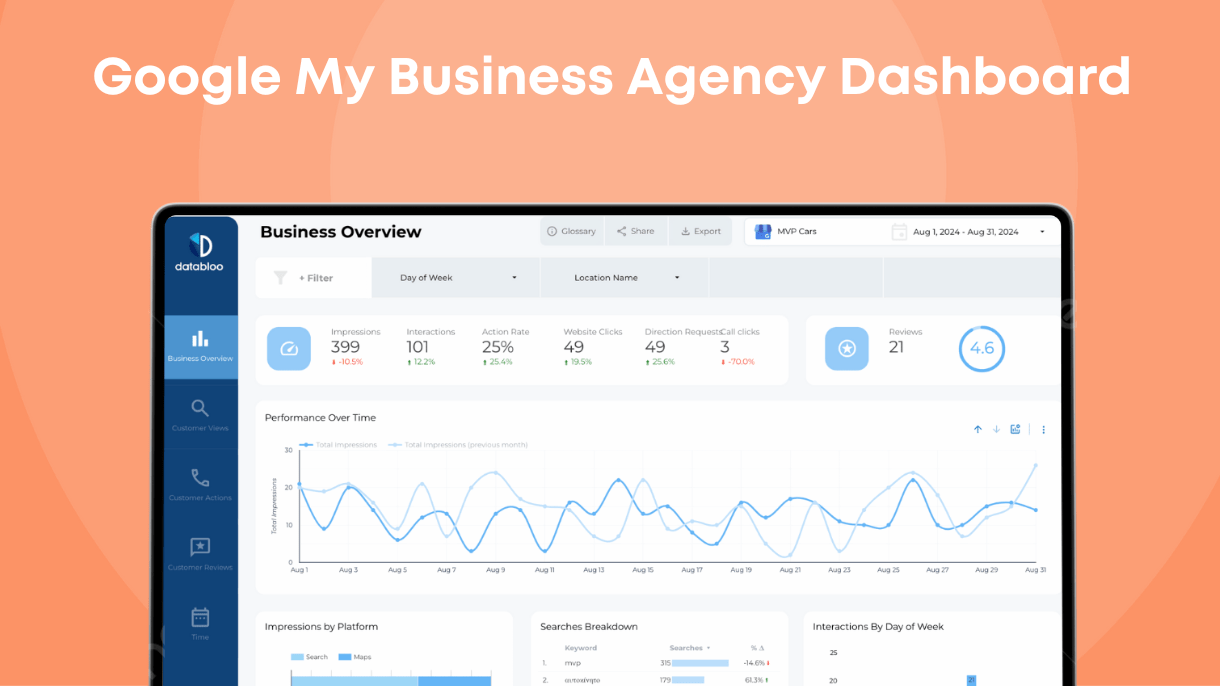
What is a Google My Business agency dashboard?
Google My Business dashboard is designed for reporting and analysing the performance of Google My Business Profile by presenting key performance metrics and performance data via intuitive charts, dashboards and tables.
The dashboard can be adjusted and customized to your various needs, including white labeling, custom client layouts, and adding alternative data sources.
Using Google My Business Report dashboard you can track your company’s local listing and analyze customer\s interaction based on various metrics grouped as specific views (tabs).
What Questions Will This Dashboard Answer?
Visibility & Reach
- How many people are seeing my business in search results?
- Are my impressions increasing or decreasing over time?
- Which days of the week do I get the most impressions?
- Are people finding my business more on mobile or desktop?
Customer Behavior
- How often are people clicking through to my website from my Google Business Profile?
- How many customers are requesting directions to my location?
- How many queries am I getting from Google search?
- What days of the week do customers interact with my profile the most?
- What are the most common customer actions after seeing my profile?
Reviews & Reputation
- What’s the average star rating of my customer reviews?
- How many new reviews am I receiving each month?
- Are reviews improving or declining over time?
- What do customers mention most often in their review comments
As well as advanced analysis:
- Does my business get more engagement during certain seasons or holidays?
- Are review trends affecting customer behavior?
- Which device should I prioritize for optimizing my website experience?
- Are my offline marketing efforts (flyers, radio, local events) driving online searches?
How to Make The Most Of This Google My Business Dashboard
Business Overview
The Business Overview tab helps you obtain the overview-level information about your Google Business Profile in a condensed and intuitive way.
The timeline graph Performance Over Time shows your profile general performance by the number of impressions over time, aiding you in pinpointing the periods of increased customer activity or periods of stagnation.
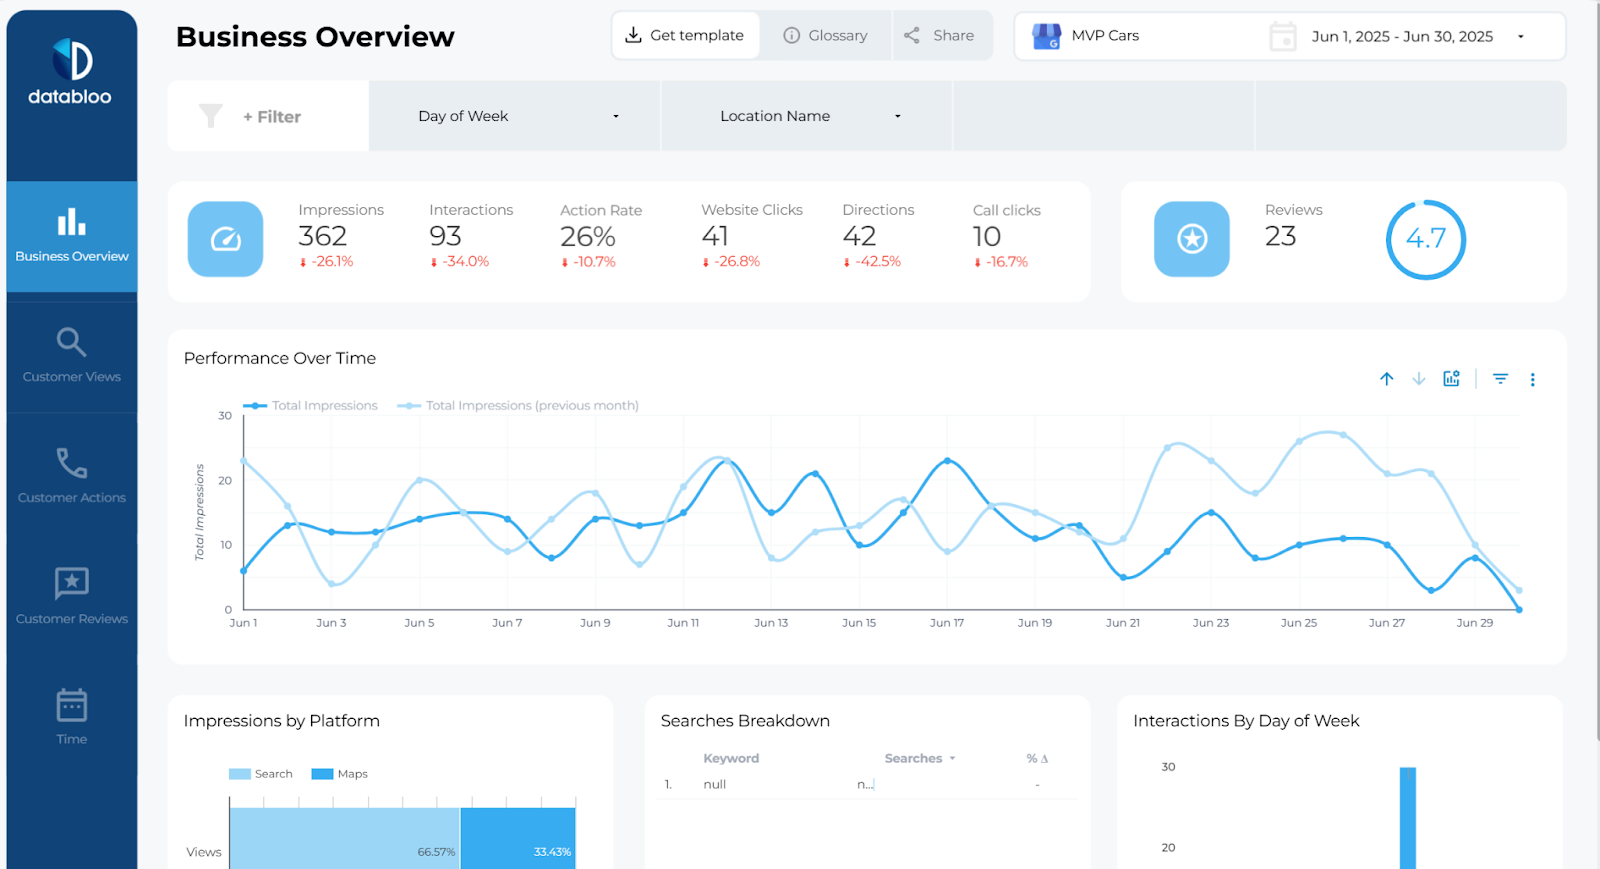
It is combined with three other graphs: Impressions by Platform, Searched Breakdown, and Interactions by Day of Week for more granular analysis.
For example, you can quickly see the source of increased impressions or analyze the last week’s performance day-to-day before transitioning to the more detailed tabs we cover below.
Customer Views
The customer view tab has all things you need to analyze the growth of your Google Business Profile through customer metrics.
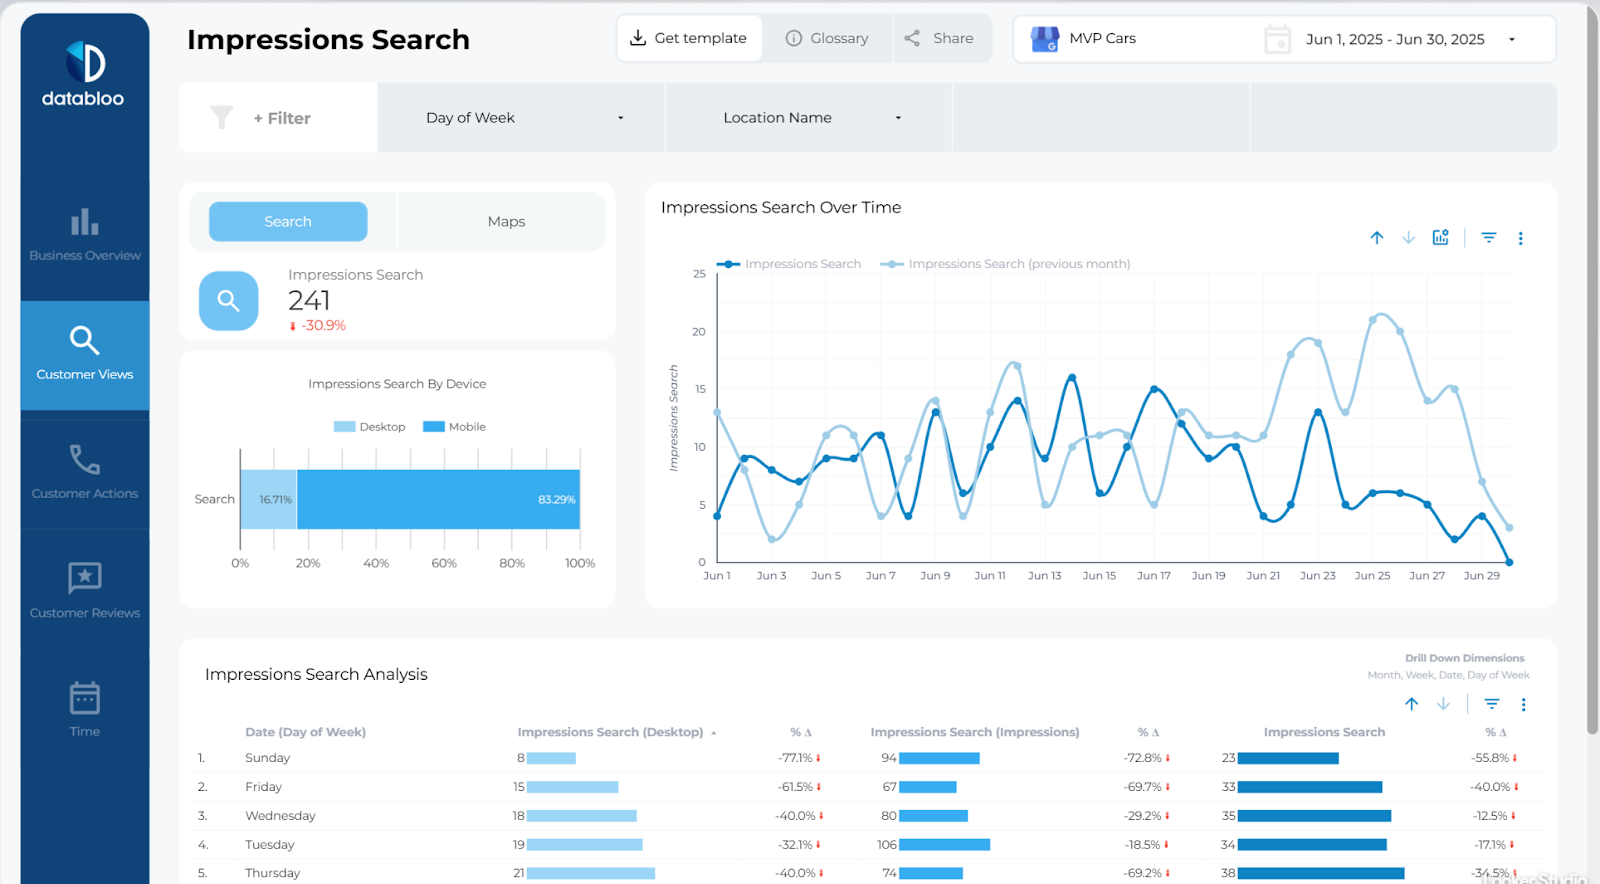
In one click, you can switch between data on Search and Maps Impressions. Impressions Maps Over Time is a perfect graph for analyzing Impressions dynamics with Maps Pack over a custom period of time, be it a month or a week.
In the bottom area there’s a leaderboard chart (Impressions Search Analysis or Impressions Maps Analysis) where you can analyze performance on a specific day of week and compare data against previous periods.
Additionally, in the top left corner you can use filters to build the entire view around a specific day or location.
Customer Actions
Customer Actions view is the next tab that focuses on Customer actions metrics such as Website Clicks, Direction Requests, Call Clicks.
Similar to other tabs, you can use the timeline on the right to spot trends, ups and downs in Customer Actions such as seasonal patterns or influx of specific Customer Behaviors.
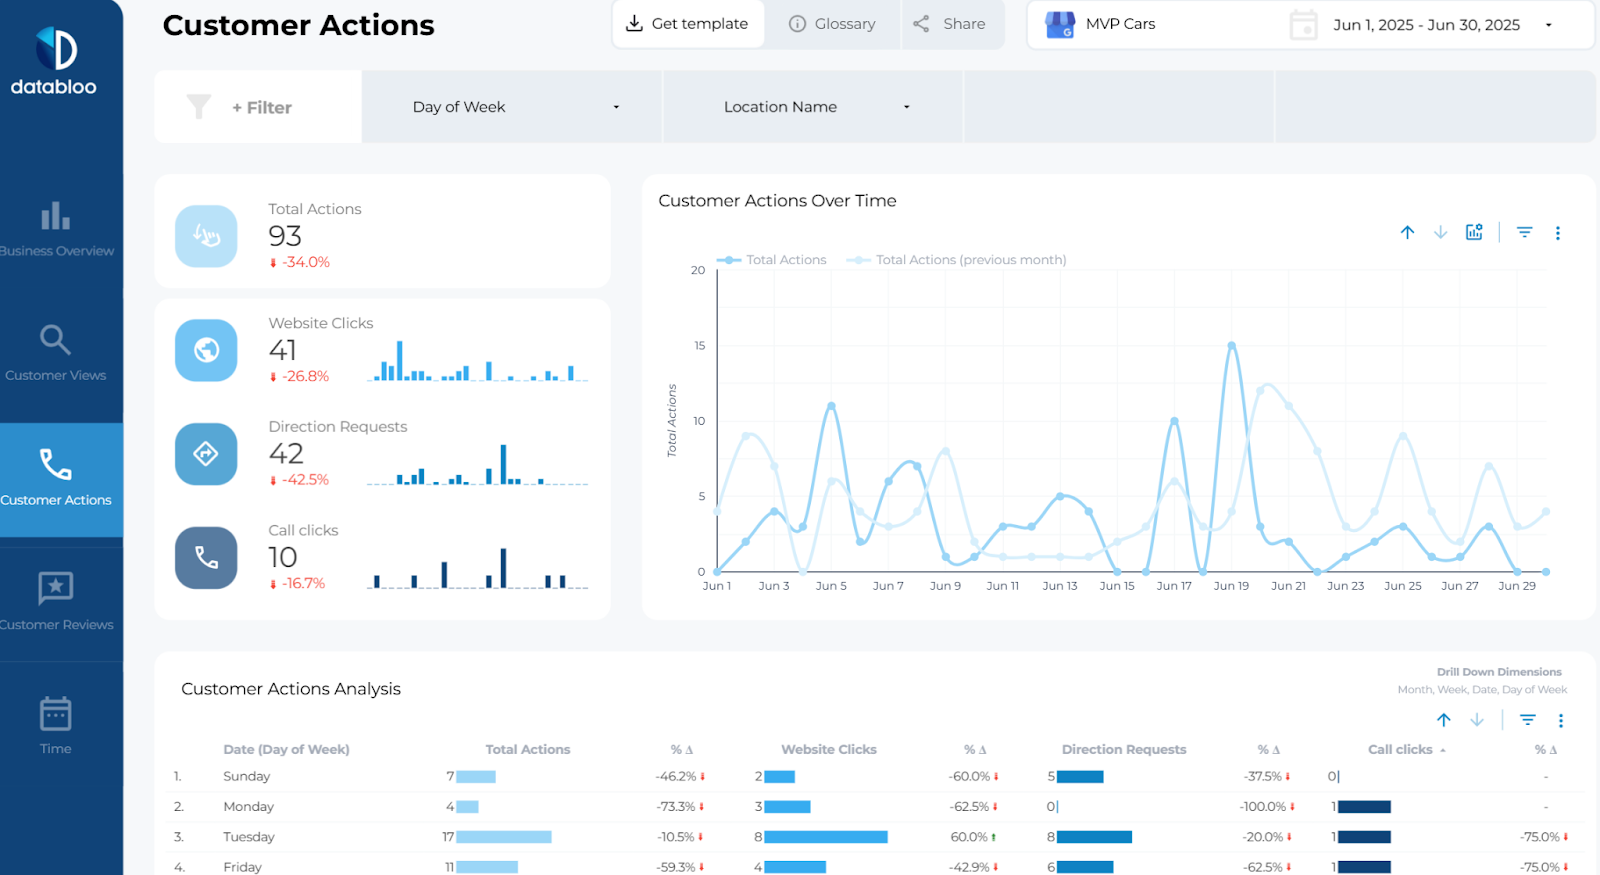
You can use the bottom charts to pinpoint day-to-day performance to the previous period. As with other views, you can filter out unnecessary information in each graph, and focus the entire view around a specific day or location.
Customer Reviews
Customer Reviews dashboard is built to provide you with all the required charts and dashboards to analyze how successful your business is in generating reviews.
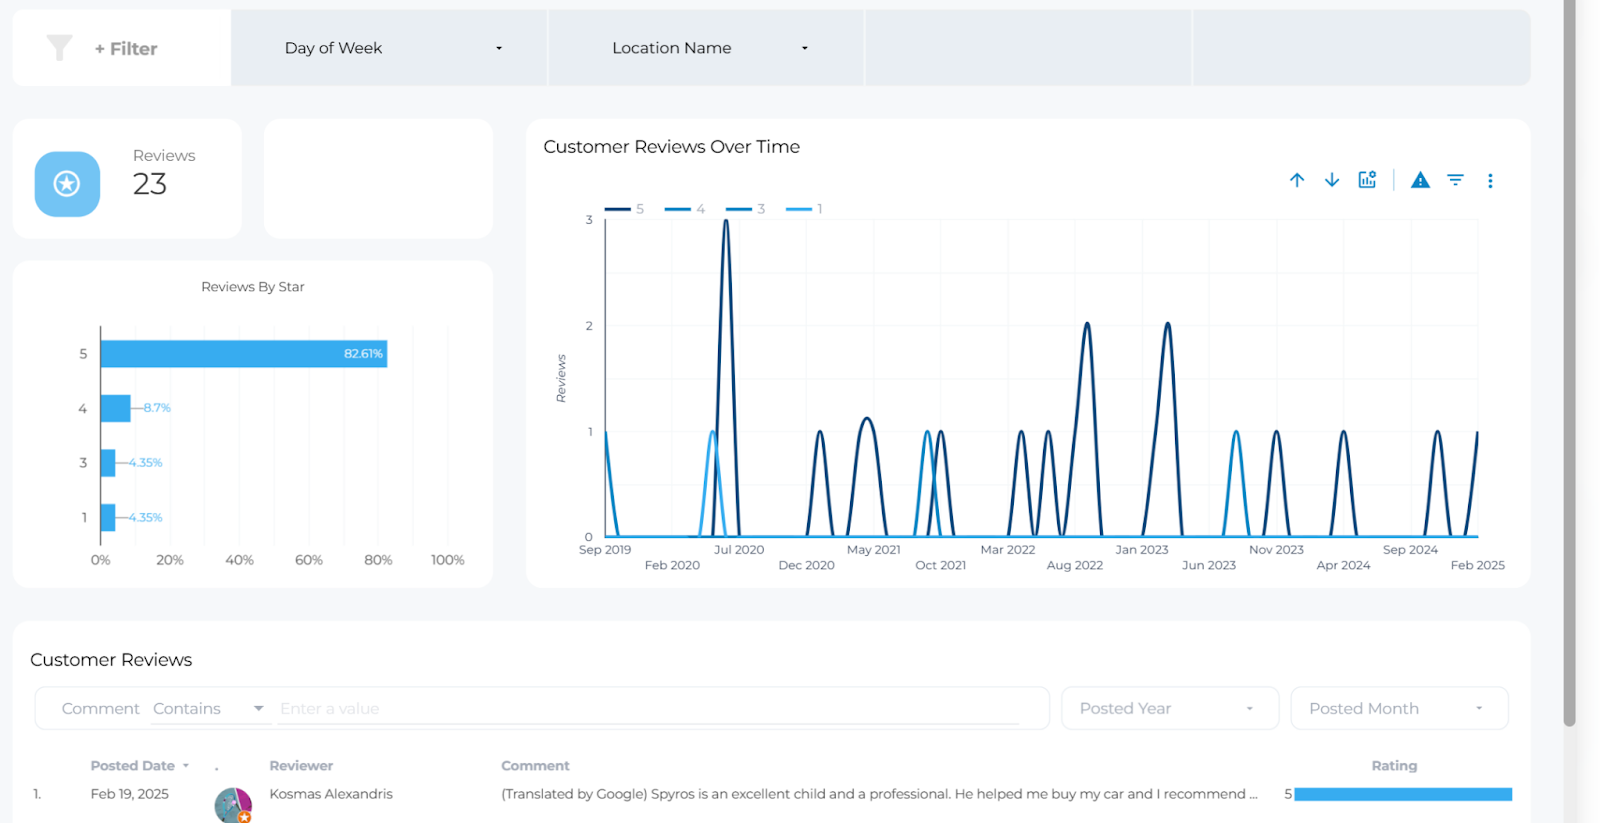
It offers a chart breakdown where you can quickly see how many reviews of each quality (5-star, 4-star, etc.) your business has.
The timeline graph is especially valuable to spot patterns or see how well your business generates reviews over time.
The bottom chart features information about each review, its contents and associated rating.
Use the built-in filters to analyze reviews over specific periods of time or for specific locations.
How to Connect Google My Business Data to Looker Studio
To visualize your GMB insights in Looker Studio using Data Bloo’s free connector, follow these quick steps:
- Sign In to Data Bloo
Go to hub.databloo.com, sign in with Google or email. - Add GMB as a Data Source
In the dashboard, choose Data Sources → Google My Business → click Connect with Google My Business. - Authorize Access
Grant permissions and select the GMB locations you want to connect. Click Connect Selected Locations. - Launch Looker Studio
Click Looker Studio to open your prebuilt GMB report. When prompted, authorize the connector and data access. Wait until the report loads in edit mode. - Customize & Explore
Filter by location, compare listings, or switch accounts using the resource settings in Looker Studio:Resource > Manage added data sources > Edit > Edit connection.
✅ Tip: Manage multiple business listings in one report. All data access is secure, read-only, and free to use — no limits.
Having issues? Disable pop-up blockers and ensure your GMB profile is verified and active.
Benefits of Dedicated Google My Business Dashboard
Advanced Insights
Our dashboard was designed by business analysts with decades of experience in SEO and local business performance to provide in-depth insights into your Google Business performance while keeping the dashboard easy-to-use and focusing on what matters: growing your business and knowing how.
Updated Automatically In Real-time
You don’t need to spend hours every month to compile manual GMB reports in spreadsheets or other tools. Once you connect your Google account to the dashboard, it will be automatically updated every time new data gets in.
White Labeled Reporting
If you plan to share reports with 3rd parties or you’re an agency that presents reports to clients, the dashboard allows you to easily add your logo, fonts, and any other white labeling elements to present reports as your own.
One-Time Purchase
You don’t need to pay any subscription costs to maintain access to the dashboard – once purchased, you will have full access to the dashboard without any strings attached.