


What Questions Should Google Ads Template Answer?
Most google ads templates will help you answer the basic questions such as “what’s our CTR” and so on. But our google ads performance report is designed to help you generate unique insights that your competition will likely miss. Here are some questions our google ads template will help answer:
- What are our best and worst performing ad campaigns?
- How does our ad performance change over time, week-to-week, month-per-month?
- What are the most engaged and least engaged audience segments?
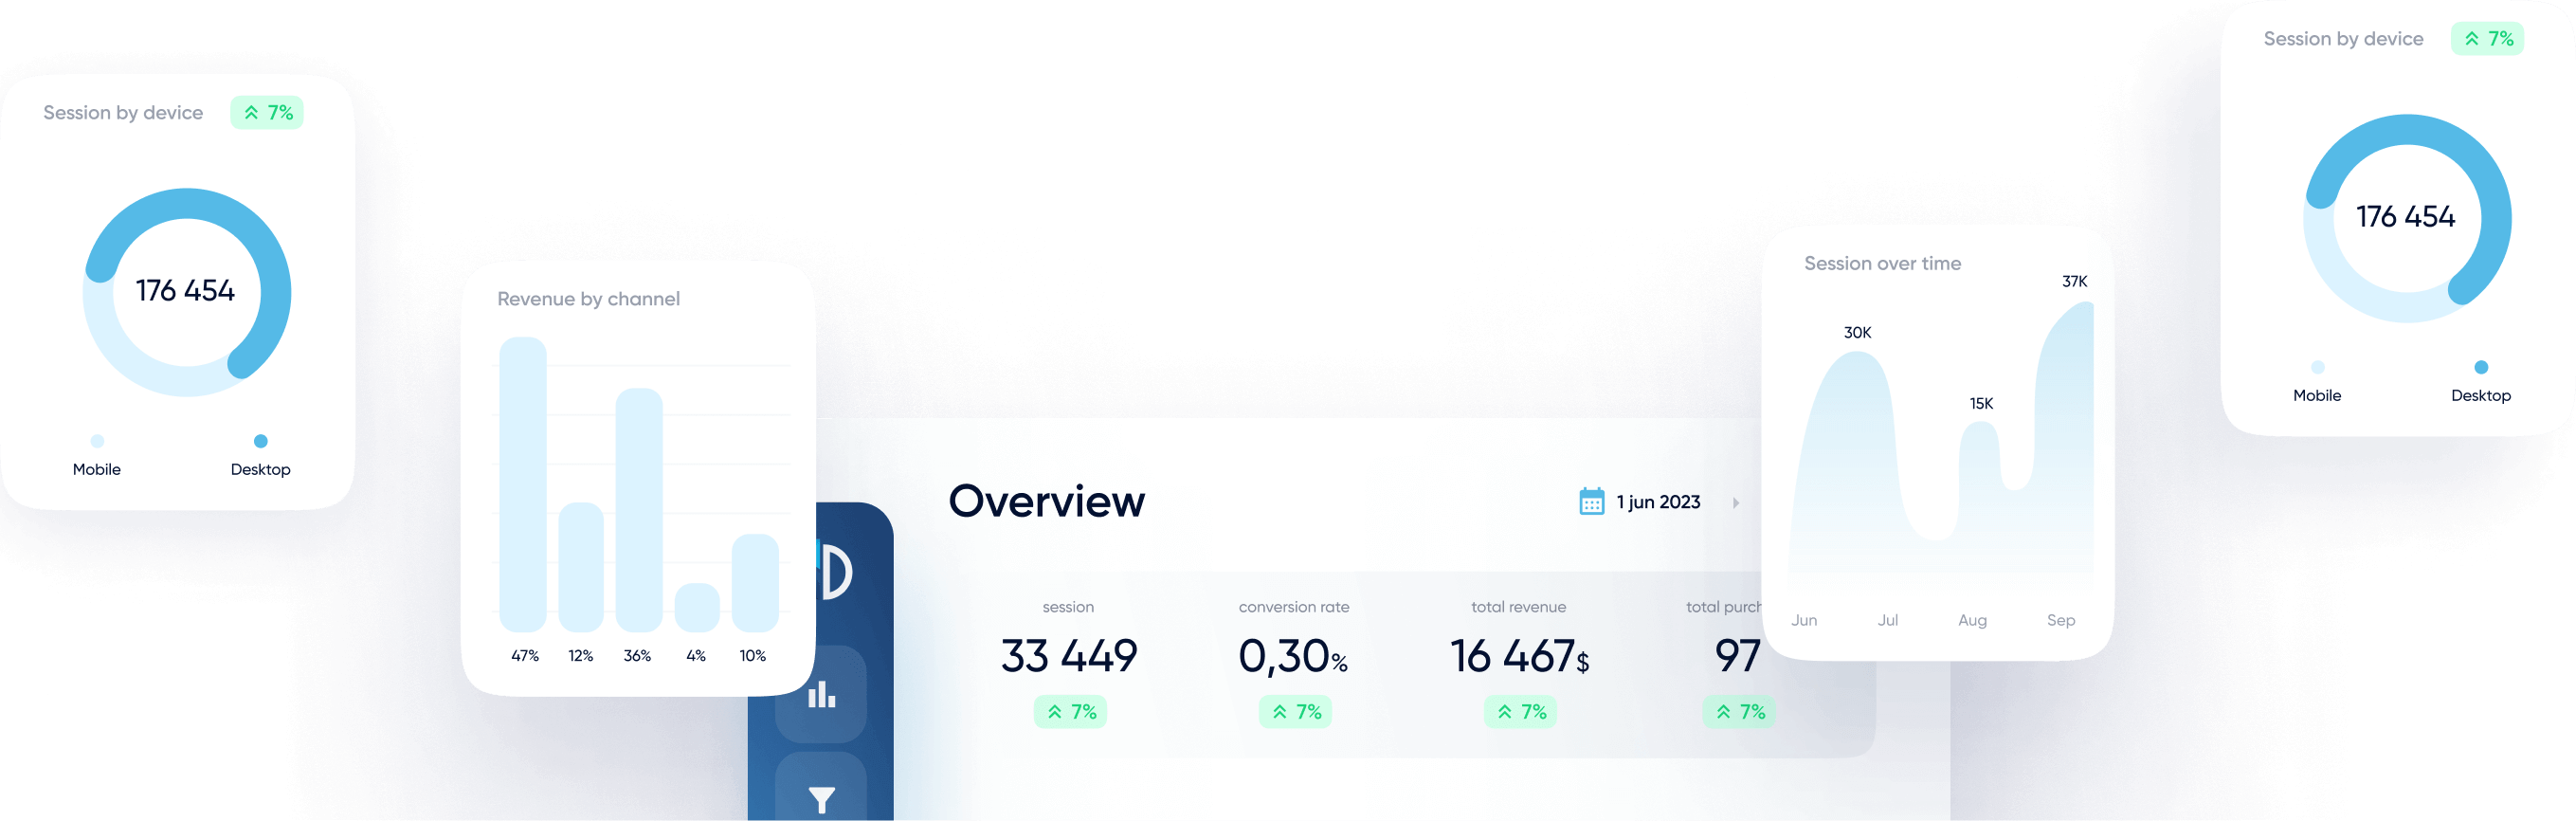
- Do our ads perform well across all types of devices?
- Are we spending more on each conversion?
- What are our most expensive and least expensive ad clusters?
- What are our most successful ad campaigns?
- What’s our ROI for advertisement in general and for individual campaigns?
- Which search keywords are performing the best?
Many other questions can be answered using our template, so feel free to check our free demo.
Main Elements and KPIs
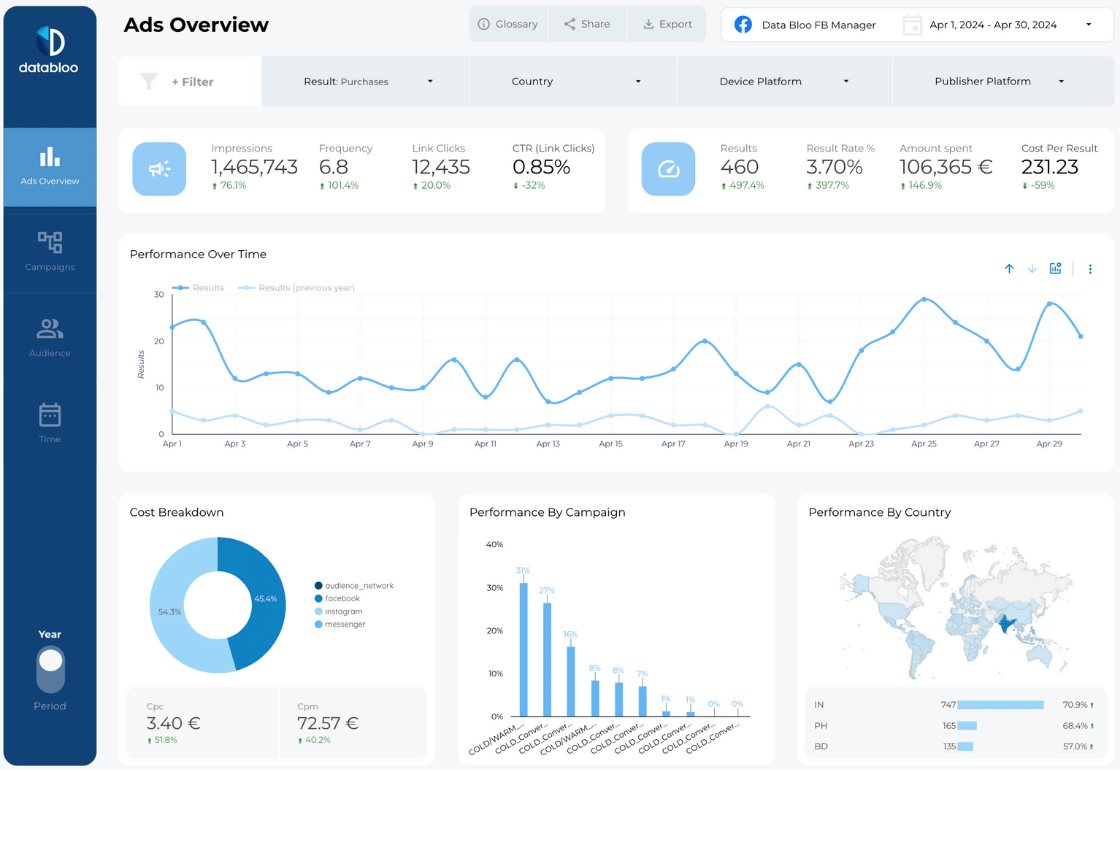
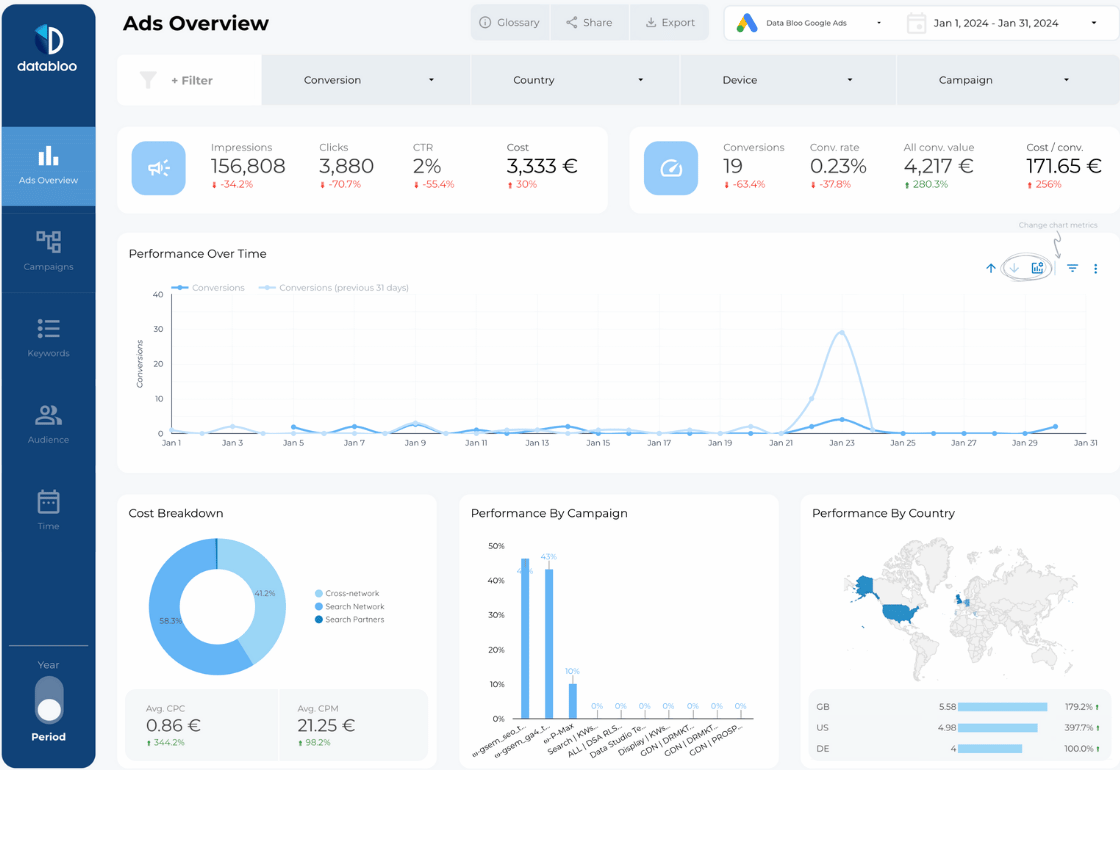
Ads Overview
Ads overview module of our google adwords report is designed to monitor your ad visibility KPIs such as impressions, impression share, and top % impressions. Paired with KPI performance over time, you can quickly evaluate how your ad visibility changed over time. You can analyze performance change over any custom period of time, be it a week, a month, or a year.
There are two additional sections in this module we’ve included for better insight: Campaign/ Keyword insights, and Audience Insights.
Campaign Insights tracks visibility KPIS per campaign and / or keyword. Audience Insights offer granular user data such as impressions per country or device. The remaining last module that you can set up here additionally is Competitor Trends which will help you track impression dynamic over time for your competitors.
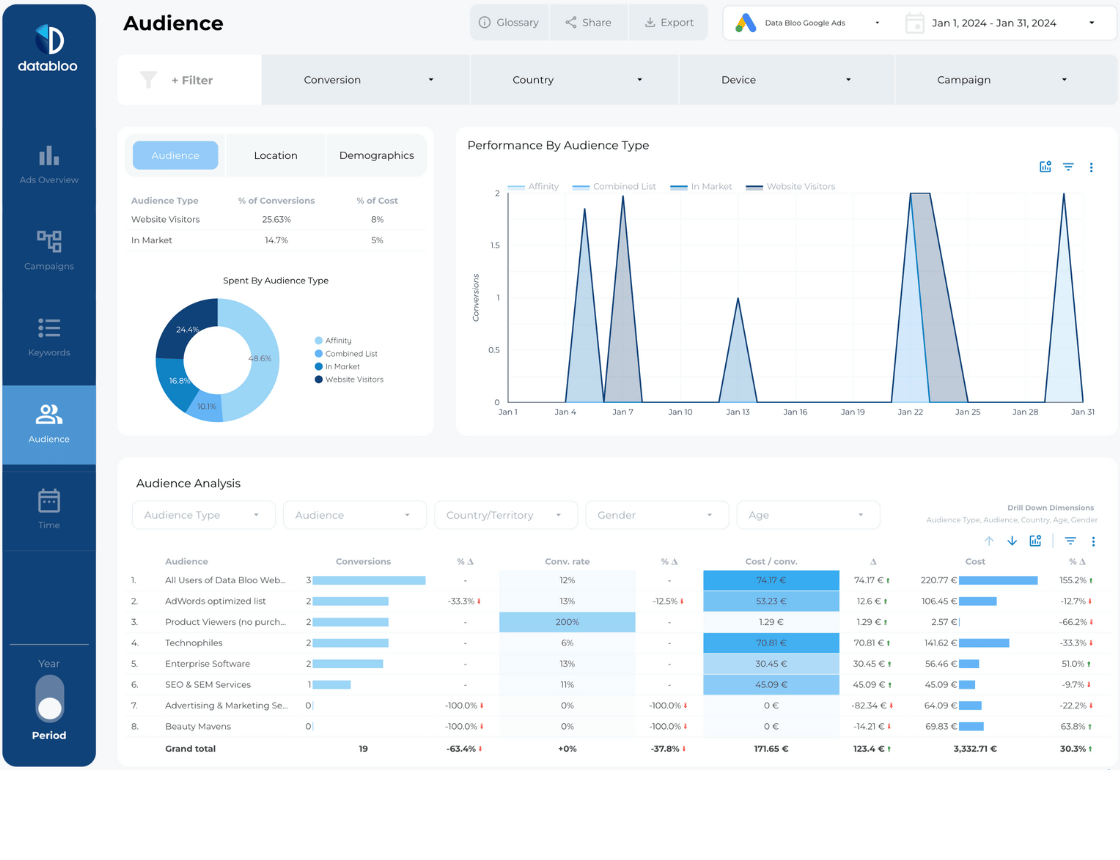
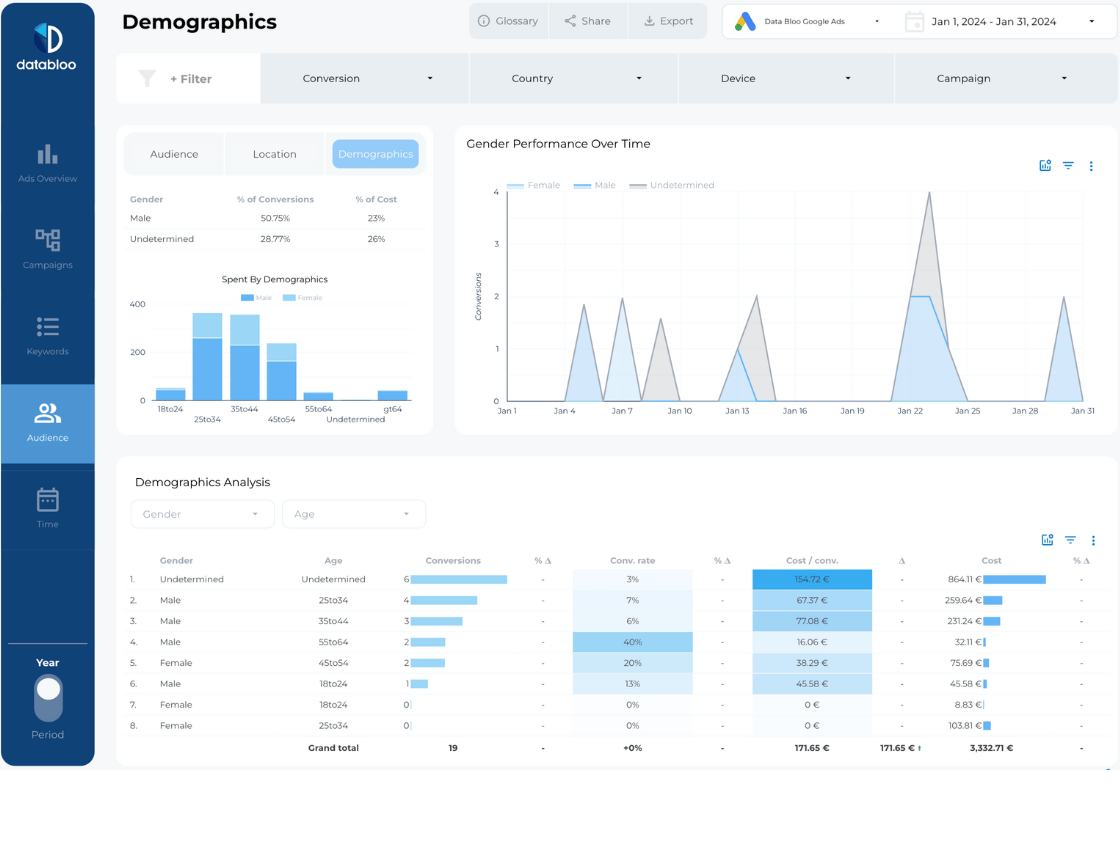
Audience
Audience module of our google ads performance report helps you see how well our ad campaigns perform for different audience segments.
Once again this data is paired with a time-based graph, letting you see conversion performance over various periods of time. This module is especially useful when you’re trying to apply wide-scale ad optimizations with the goal of improving conversion rates.
Here you can track campaign / keyword conversion performance and compare several ad campaigns based on clicks, CTR, and cost over time.
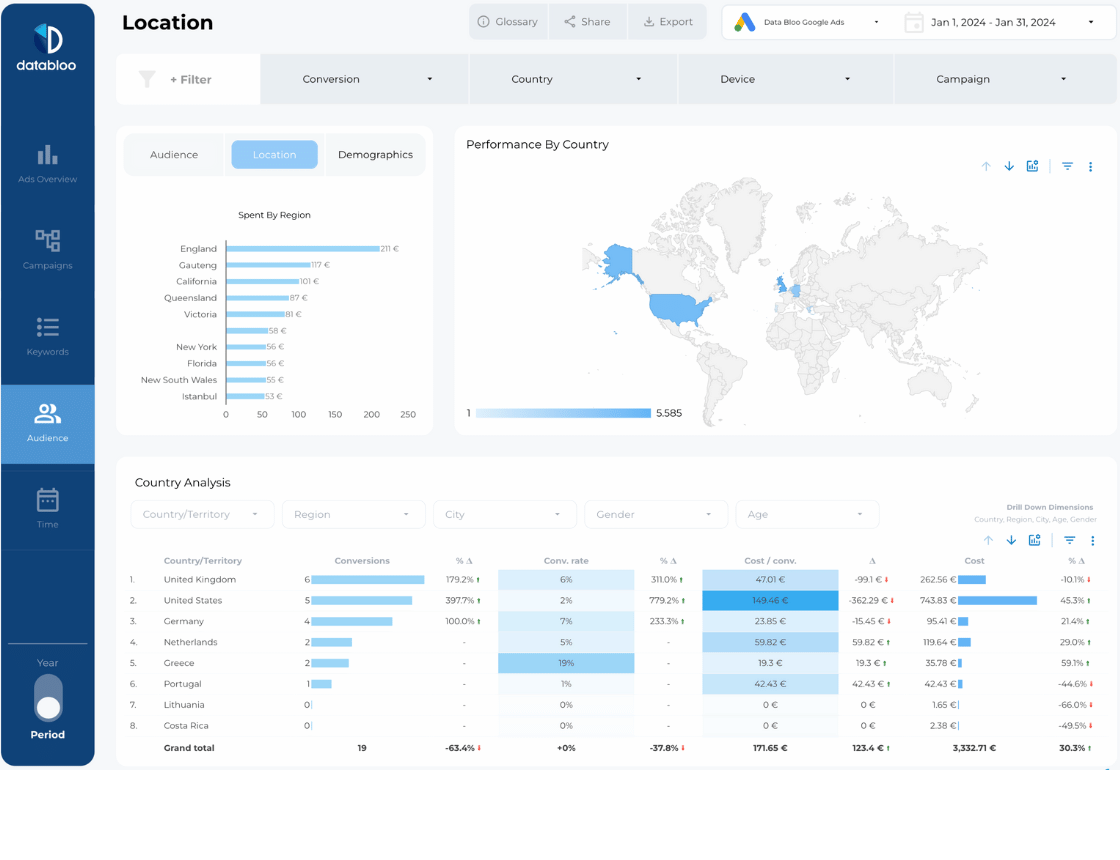
Audience module helps you understand what segments of your audience (age, gender, country) convert better or worse, and if your ads convert better on different types of devices or in different countries.
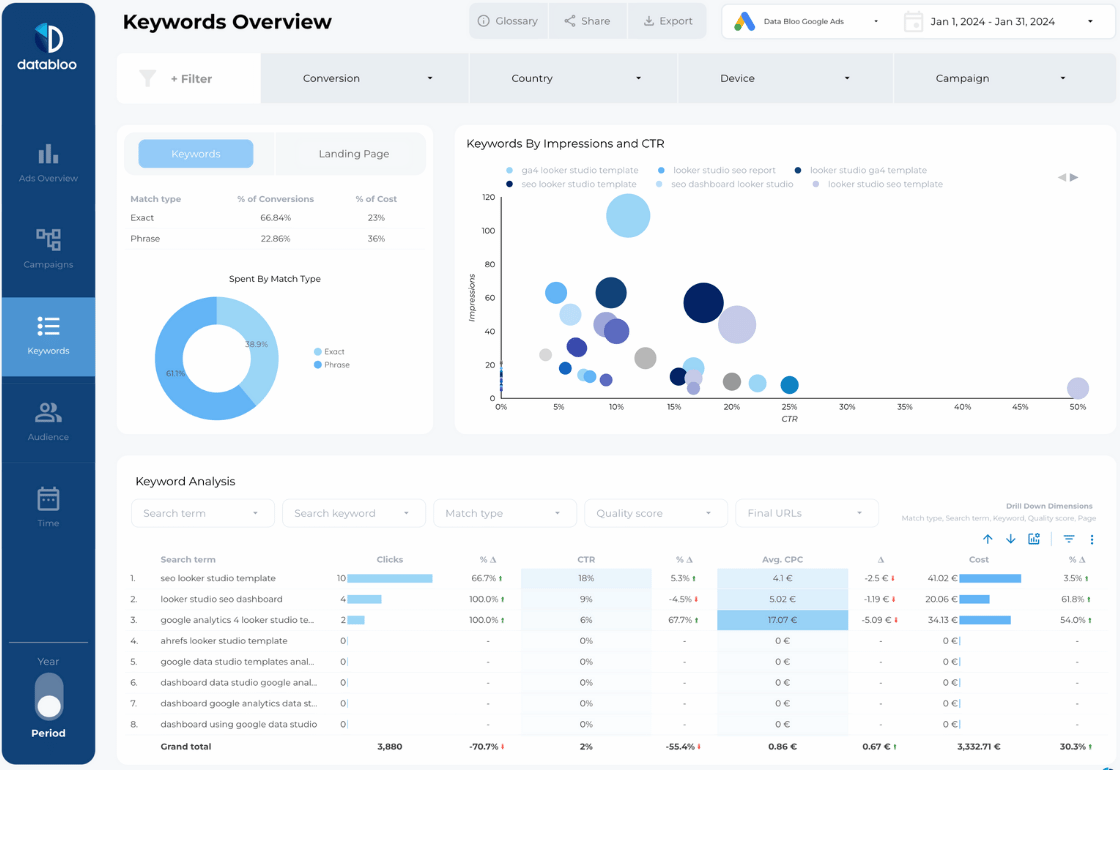
Keywords
Keywords graphs in this section of ad report helps you quickly gauge the conversion performance of keywords, phrases, and keyword groups.
Using a wide array of filters you can pinpoint gaps in performance for specific keyword groups or identify best performing segments and use that information to improve other aspects of your ad campaigns.
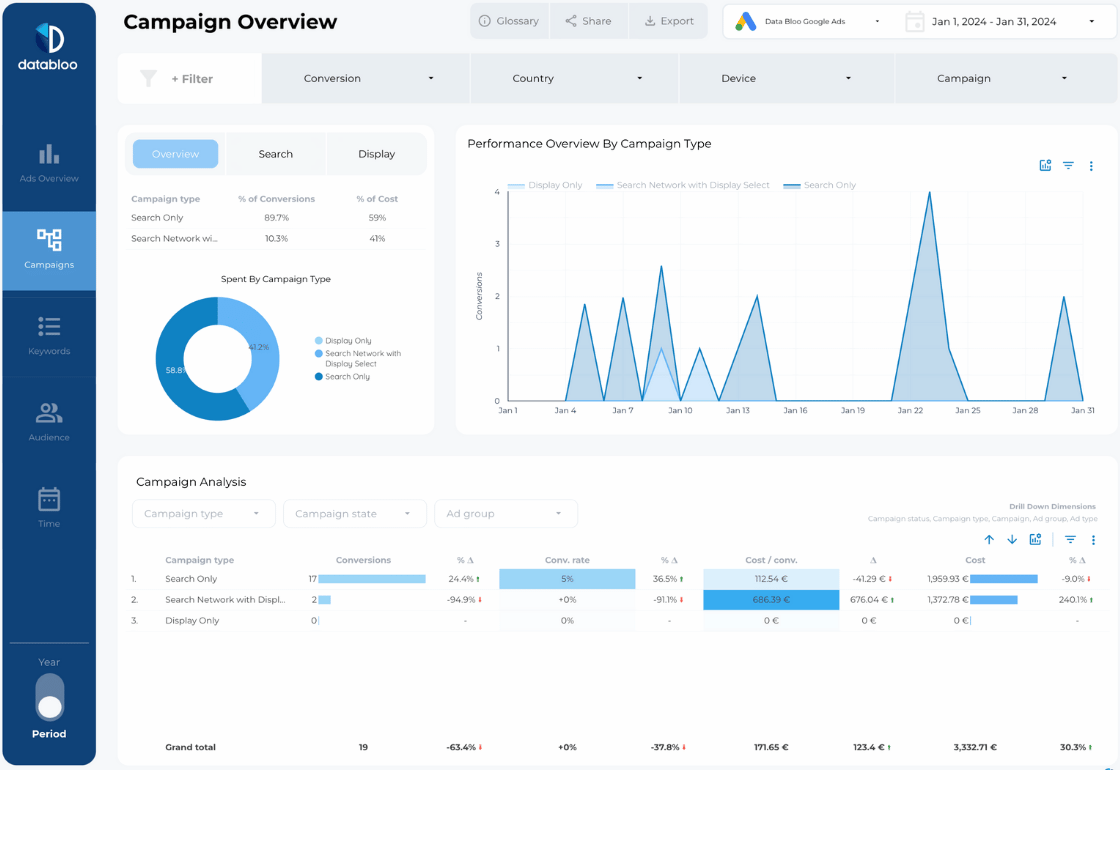
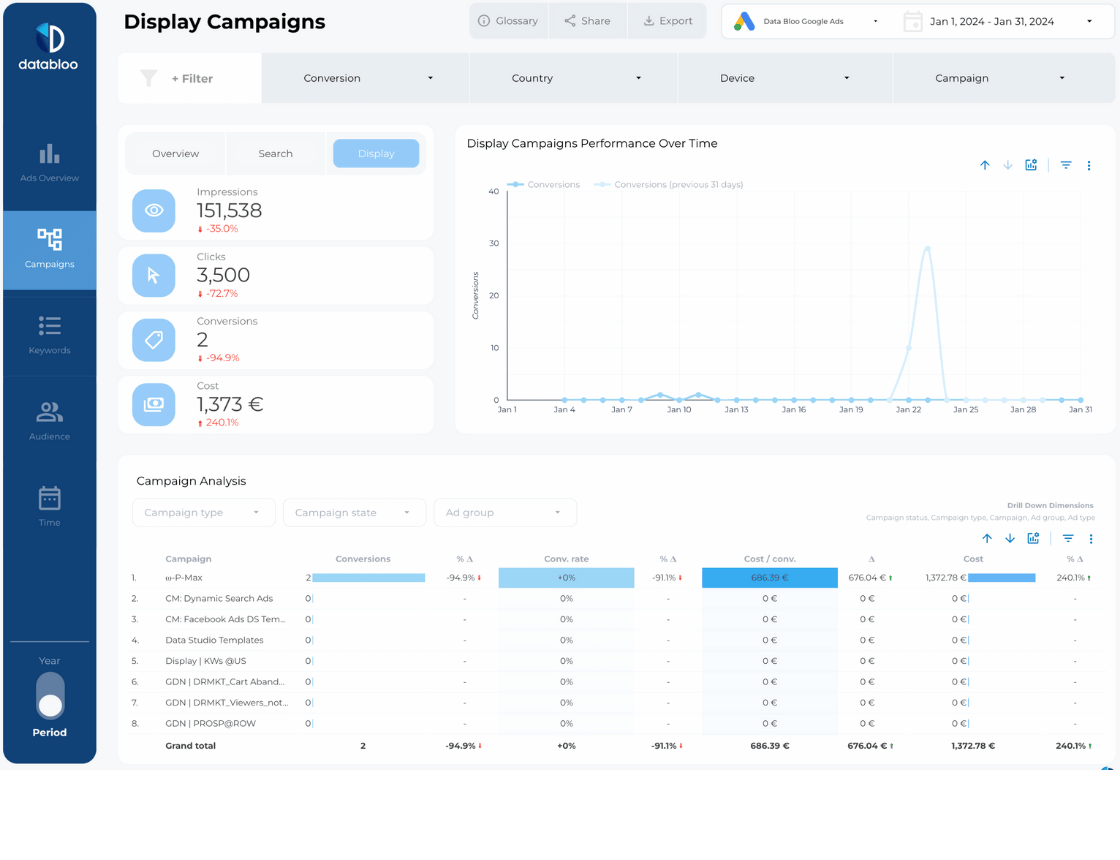
Campaigns
Campaigns tab is all about campaign performance: identifying best and worst performing campaigns, tracking ad campaign performance over time, and conducting in-depth campaign analysis.
As usual, you can use filters to sort out campaigns by country, conversion type, device, and more.
Here you can also compare campaigns of different types (Search, Display) and pinpoint performance for specific ad groups.
Tip: use campaign state filters for analyzing current, paused and past campaigns performance.
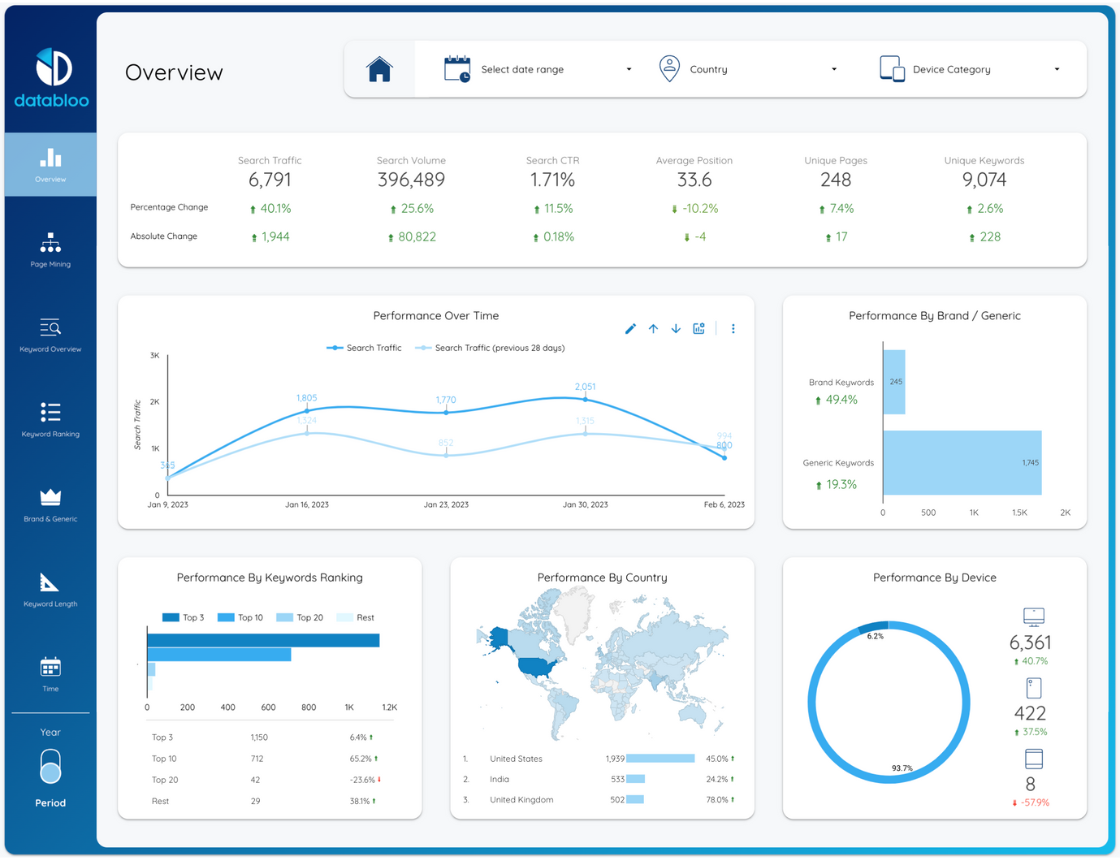
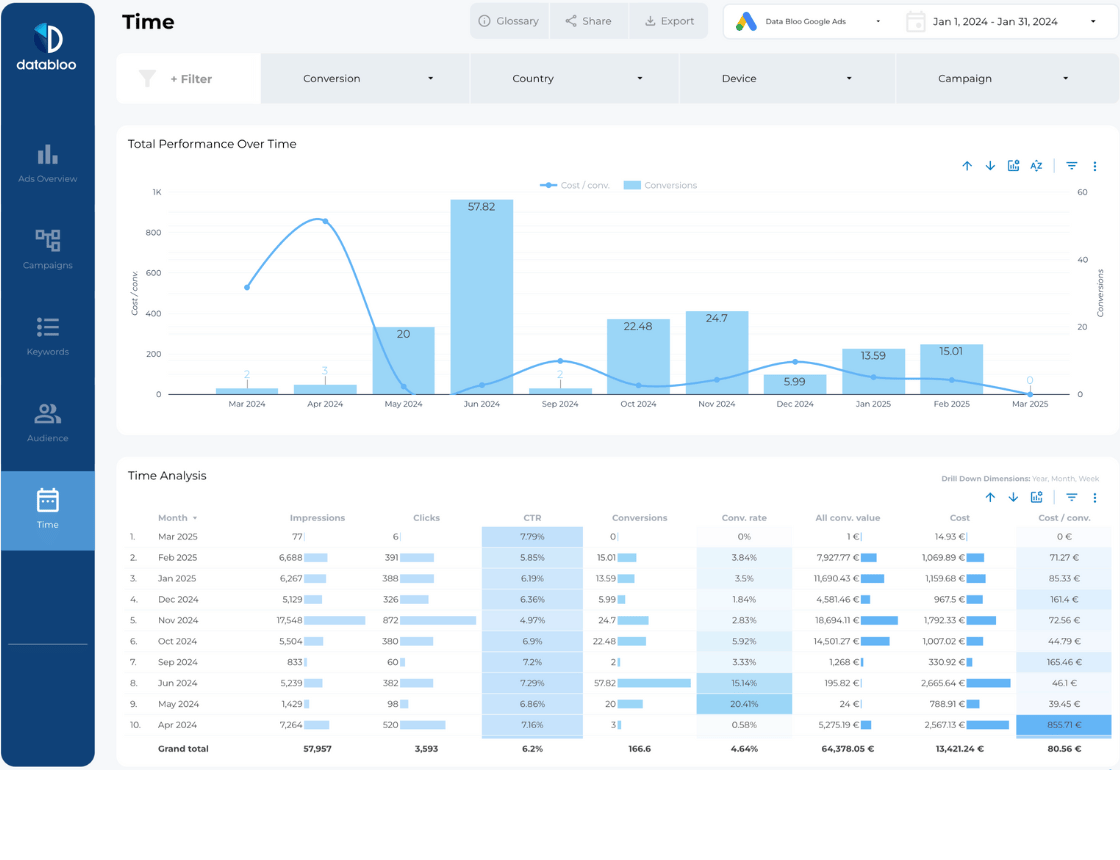
Performance Over Time
This page gives you a wide-lens view into how your Google Ads perform throughout the year. This helps you identify the times your ads performed the best and the times when your ads performed the worst. Through an impressive graph, you can pinpoint exactly how much you spent each month in a flash and drill down on a weekly or daily basis.
Benefits of Google Ads Performance Report
Gain Actionable Insights Quickly
Time is money and the faster you gain insights about your ads and PPC campaigns, the faster you will implement necessary changes to improve ROI and attract more customers.
Our google ads performance report is designed to help you spot low-hanging fruits, track impact of your changes, and obtain all necessary insights quickly. Using our looker studio google ads report you will always see easy ways to improve your ad performance, whether you are trying to tune up individual ad campaigns or want to revamp the entire ad strategy.
Save Hours On Configuring and Updating Multiple Ad Reports
Creating google ads report manually is a chore, especially if you need an ongoing reporting tool to be able to optimize your ad campaigns regularly.
Our report is already set up in the most useful manner – all you need to do is add log in with your ad account and the report will be automatically filled with real-time data. From then on, the report will be automatically updated in real-time, so you can use it as often as possible while always having access to the most up-to-date data.
Gain Unique Insights That Others Will Miss
The unique advantage of custom ad reports is that they can be configured in any way for maximum benefit. Helping other companies for over a decade succeed with hundreds of various ad campaigns, we know how to structure the best performing google ads reports that invoke unique insights that are hard-to-spot or unattainable when using default app interfaces or basic reporting tools.
Using our google ads performance report, you will learn what makes the best performing google ads campaigns, how to adjust your campaigns for maximum profit, and how to quickly spot opportunities that your competitors are unaware of.
Feel free to try our two other google ads reports: Google Ads Single Page Report Template , Google Ads Overview Report Template
One-click Setup Process
Complete the configuration of your template in a few clicks, as the Google Ads Looker Studio Template uses the native connector of Google. Our template includes step-by-step instructions and video tutorials so you can easily make build your own version.