Table of Contents
Find out which of your products have high or low drop off rates (abandonment) in the conversion path and at which step, so that you can optimize your Ecommerce flow accordingly? This post shows how to identify trends in the shopping behavior for your products with Looker Studio.
What is the Ecommerce Drop Off Rate
Thanks to Enhanced Ecommerce, we can pull powerful insights that could lead to better business decisions improving further the online sales. But what about if we miss a part of the picture? Without saying, Shopping Behavior & Check-out funnels provide an in depth analysis regarding where the users did or did not complete a step in the purchase path, but not broken down by product or brand.
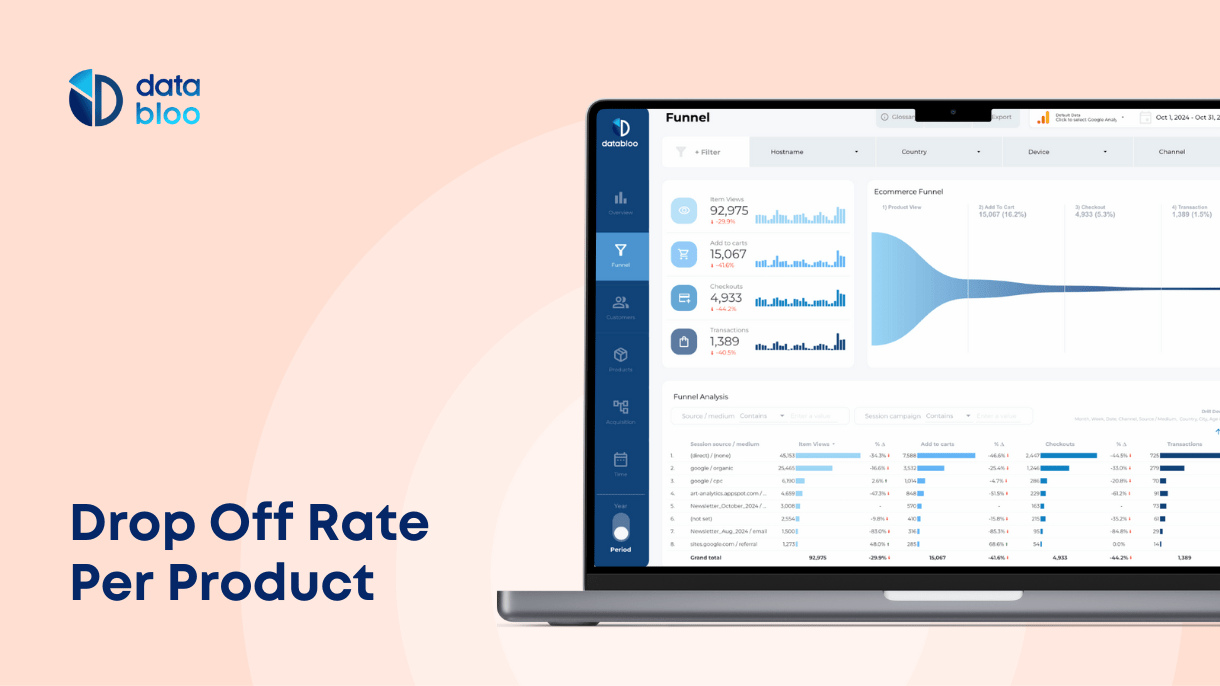
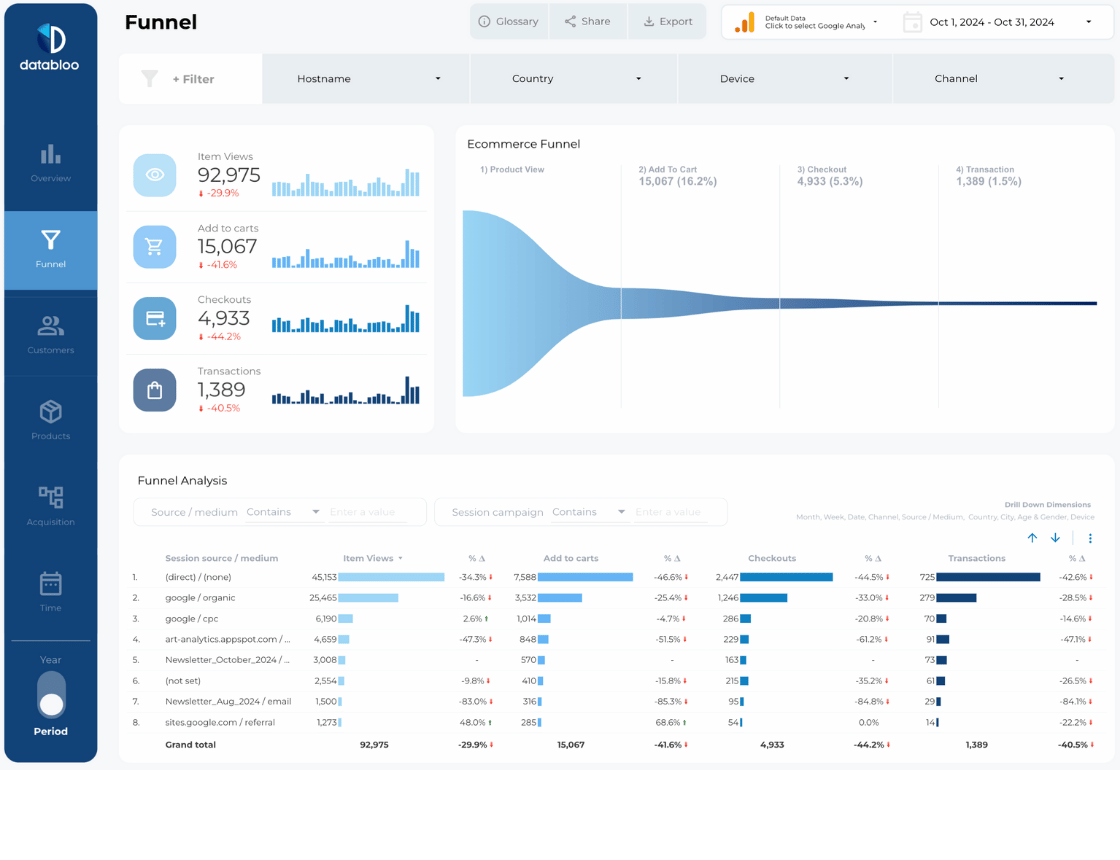
Imagine a dashboard that shows the drop off rates per product – from product view to checkout and from checkout to transaction.
How to Create The Drop Off Rate Per Product:
With the help of Google Looker studio, now you can prepare the drop off rates from product view to transaction. Just follow the below steps:
1) Connect your Google Analytics view to the Looker studio report
2) Edit your data source and create the following custom fields in your data source:
- Product View Drop % = 1 – (Product Checkouts/Product Detail Views)
- Product Check-Out Drop %= 1 – (Unique Purchases/Product Checkouts)
*Don’t forget to change the type of these dimensions, from number to percentage.
3) Create a table and add the above rates as metrics and the enhanced ecommerce info of Google Analytics “Product” or “Brand” as dimension.
Important Insights For Your Products
Let’s start with the definitions. The Product View Drop % provides information about how appealing individual products or brands are, based on description and visuals on the product detail page. The Product Check-Out Drop % shows the purchase intent for each of these products or brands.
Having the above definitions in mind, the new table on Looker Studio allows you to understand and identify pain points on your product offerings (promotions) and proceed to different optimization tactics.
Products / Brands with high Product View Drop Rate
Channels – In paid search proceed to target optimization, knowing that users who have clicked at specific campaign ad and visited a product page with low conversion.
Content – Improve texts and images with regards to the product detail page, providing the most accurate and important info about the product. Always compare the content between your worst and top converting product pages and check for any discrepancies.
Products / Brands with high Product Check-Out Drop Rate
Sales – Offer higher quality promotions and offers, boosting the low converting products / brands.
Content – Provide better placements for these products before, during and after the booking process (cross selling).