Table of Contents
Are you spending more time building Facebook Ad reports than actually optimizing campaigns? You aren’t alone.
For agencies and marketers, the monthly reporting cycle is often a manual nightmare of screenshots and spreadsheets. But clients don’t just want data; they want a story. They want to know where their budget went and what the ROAS is—at a glance.
To help you streamline your workflow, we’ve curated the best Facebook Ads report examples for 2026. Each example below is a ready-to-use Looker Studio template designed to automate your reporting and impress your clients instantly.
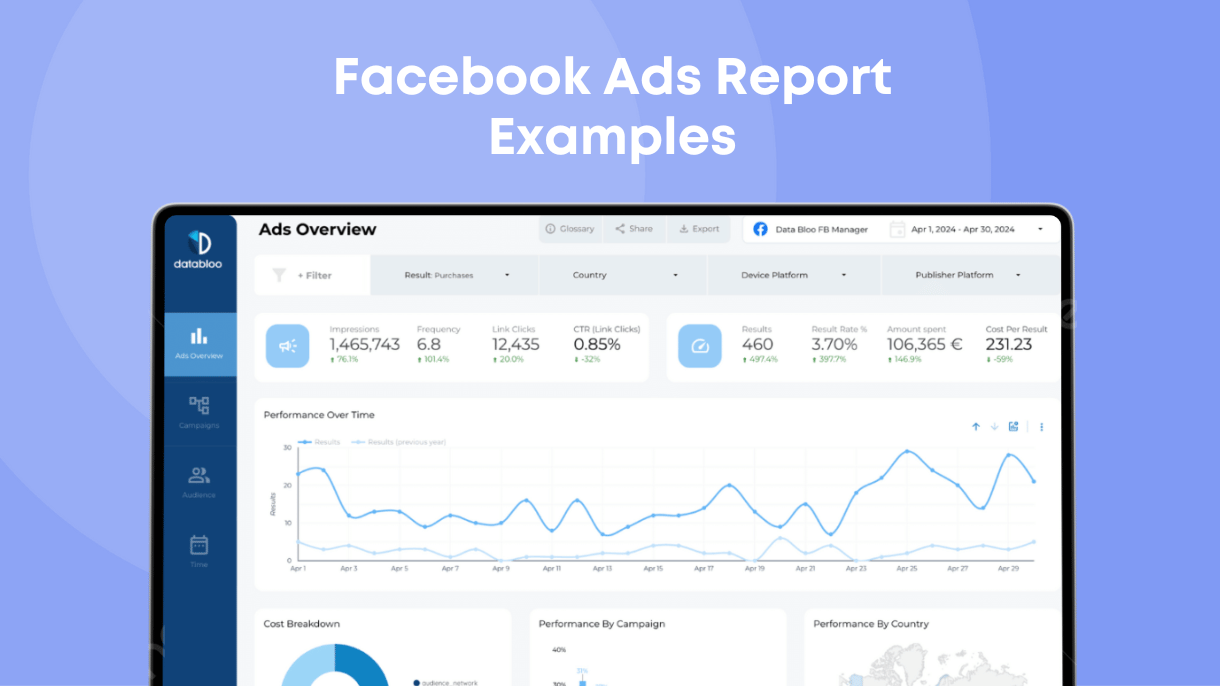
1) The Comprehensive Facebook Ads Report Example
Template: Facebook Ads Looker Studio Template
Source: Meta Ads
Setup: Easy — Data Bloo Facebook Ads Connector
This is the gold standard for single-channel reporting. If your client wants a deep dive specifically into their Meta advertising performance (Facebook & Instagram), this is the layout you need. It moves beyond vanity metrics to show the real health of the account.
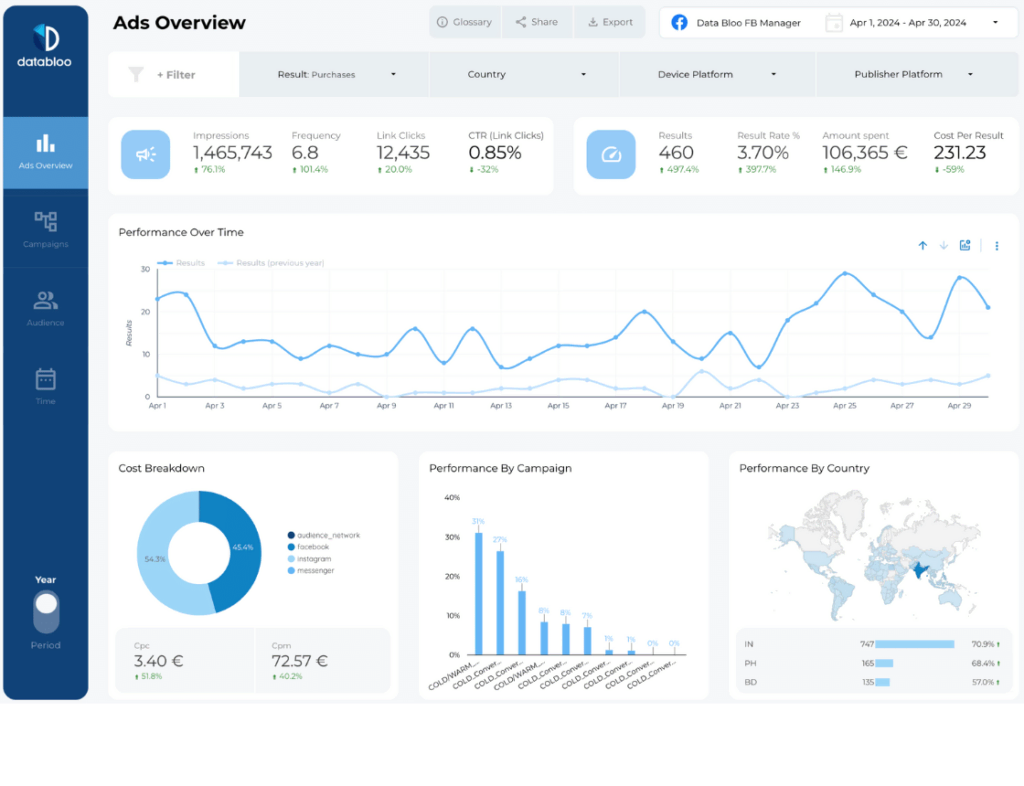
Key Features / Metrics:
- Funnel Visualization: Instantly see the drop-off from Impressions to Clicks to Conversions.
- Platform Breakdown: Compare performance between Facebook vs. Instagram placements.
- Cost Efficiency: Track CPM, CPC, and CTR trends over time.
Who is this for?
Ideal for social media managers and performance marketers who need to prove the specific ROI of their Facebook campaigns to clients or stakeholders.
Why use this template?
It answers the most critical question: “Is my creative working?” By breaking down performance by campaign and demographic, you can spot fatigue early and pivot your strategy without digging through Ads Manager.
2) The Multi-Channel “Big Picture” Report Example
Template: Digital Performance Master Template
Source: Multiple Sources (GA4, GSC, Facebook Ads, Google Ads)
Setup: Easy – Combine Your Own Data Sources
Sometimes, a Facebook Ads report in isolation isn’t enough. Clients often ask, “How does Facebook compare to Google Ads?” This example solves that problem by consolidating Facebook data alongside your other paid channels into one “Master” view.
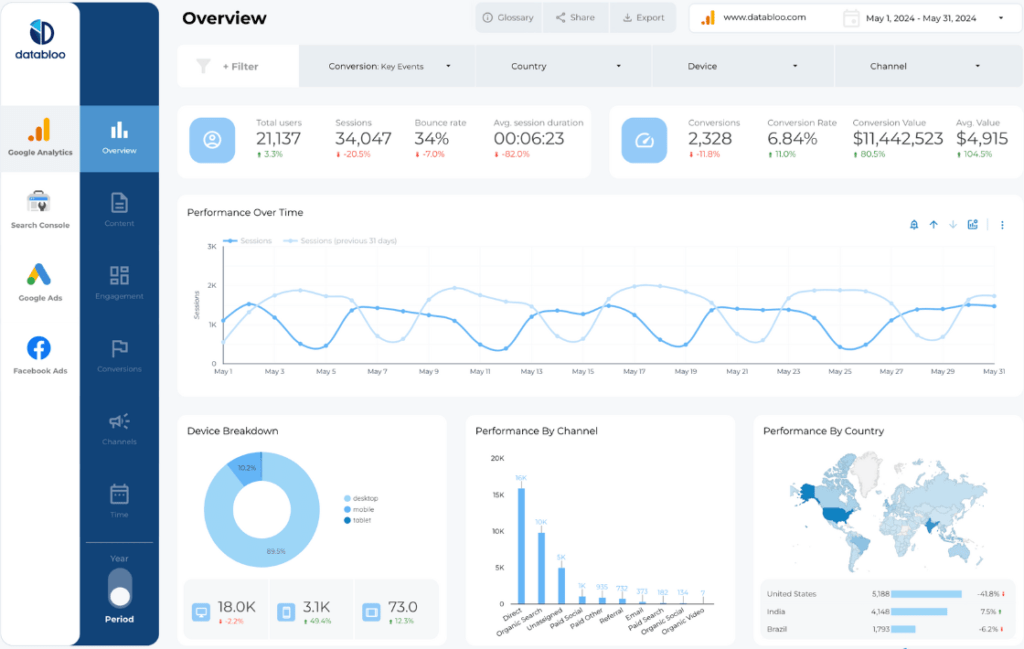
Key Features / Metrics:
- Cross-Channel Comparison: Side-by-side view of Facebook Ads, Google Ads, Google Analytics, and Google Search Console.
- MoM Growth Analysis: Instantly track percentage changes in key metrics (like Users, Sessions, and Goals) compared to the previous month.
- Pacing Tracker: Monitor your total budget spend against your monthly cap.
Who is this for?
Perfect for Marketing Directors and Full-Service Agencies who manage a holistic digital strategy and need to report on the “bottom line” rather than just one channel.
Why use this template?
Context is king. This report shows how Facebook Ads contribute to the larger ecosystem, helping you justify budget allocation decisions (e.g., shifting budget from Display to Facebook) backed by hard data.
3) The Custom “Agency-Scale” Report Example
Template: Custom Master Template
Source: Multiple Sources
Setup: Easy – Combine Your Own Data Sources
Every client is different. Some care about video views; others only care about lead generation. This example isn’t just a static template—it’s a modular framework that allows you to mix and match data sources to build a bespoke Facebook report in minutes.
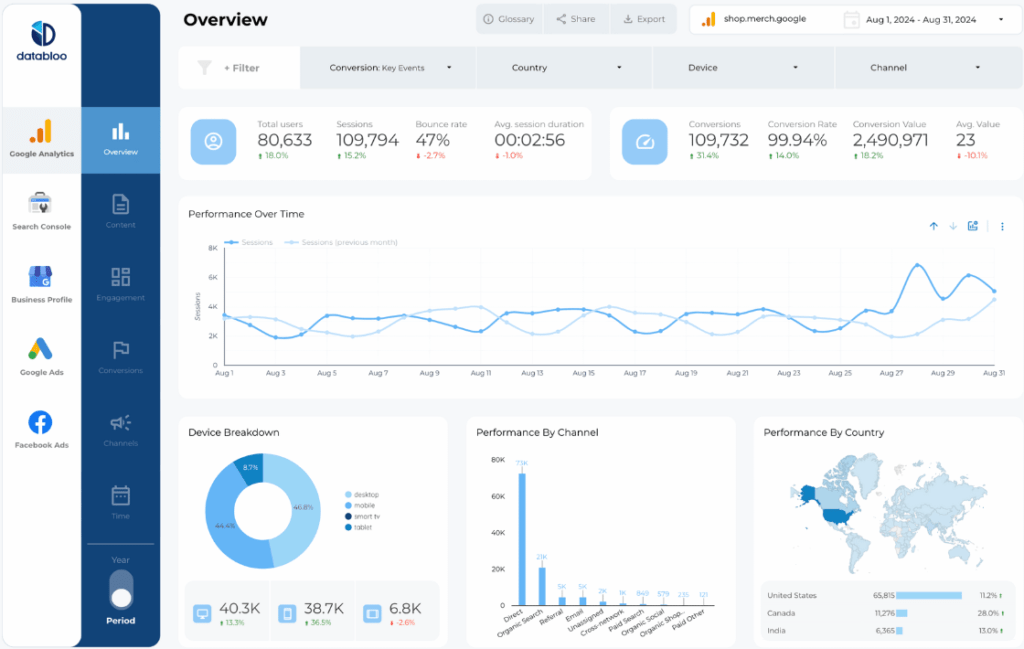
Key Features / Metrics:
- Modular Design: Select only the KPIs that matter to your specific client.
- White-Label Ready: Designed to be easily branded with your agency’s logo and color palette.
- Native Data Integration: Seamlessly combine Facebook Ads with other supported platforms like Google Analytics 4, Google Ads, TikTok, and more.
Who is this for?
Agencies with diverse client rosters (e.g., E-commerce, Local Gen, B2B) who need a flexible reporting base that can adapt to different goals.
Why use this template?
It prevents “report bloat.” Instead of overwhelming clients with 20 pages of data they don’t understand, you deliver a concise, custom report that highlights exactly what you promised to deliver.
Automate Your Reports With the Data Bloo Facebook Ads Connector
A great template is only half the battle. To make these reports truly “set it and forget it,” you need a way to pull live data from Facebook into Looker Studio automatically.
That’s why we built the Data Bloo Facebook Ads Connector—the only native integration that lets you connect unlimited ad accounts to Looker Studio.
Why this changes the game:
- Aggregate Unlimited Accounts: Managing 10 different clients? Pull all their data into a single “Master Report” automatically.
- Official API Security: It connects securely via the official Facebook Marketing API in under 3 minutes.
How it works:
It powers all the templates listed above. Instead of manually exporting CSVs from Facebook Ads Manager every Friday, you simply connect your account once. The connector then keeps your reports live and up-to-date 24/7, so your clients can check their performance anytime.
Build Your Own Social Media Report in Looker Studio
Stop wasting hours on manual reporting. Whether you need a granular deep dive into Facebook Ads, a Multi-Channel overview, or a fully Custom solution, there is a template here to fit your needs.
Ready to upgrade your reporting? Check out our full bundle of Looker Studio Templates and start automating your client reports today.
FAQs
1. Can I report on multiple Facebook Ad accounts in one dashboard?
Yes. This is a key feature for agencies. The connector allows you to select and aggregate data from multiple ad accounts (e.g., for different franchise locations or client accounts) into a single “Master View” without needing complex data blending.
2. Are these templates customizable?
Absolutely. Once you copy the template, it is yours to own. You can add your agency’s logo, change the color scheme to match your client’s branding, or drag-and-drop new metrics to fit your specific reporting needs.