Table of Contents
Google Looker Studio (formerly known as Data Studio) is a tool that allows you to make graphical representations and reports of changing data trends. It is one of the latest additions to the Google library (since 2016), and it can be very useful for someone who needs to analyze data and create presentations from several different sources.
Marketing professionals, developers, and other small and medium businesses have to maintain a regular check on the changing data and create reports from this data. And Google Looker Studio is the perfect tool to do so. But what are the sources from which you can add data to Google Looker Studio?
Let’s take a look at how you can add data to Google Looker Studio to visualize and assess it.
Data Sources in Google Looker Studio
It can be a nightmare to manually create reports from the data that needs to be updated regularly. But thankfully, Google Looker Studio takes care of the issue for you. This cloud-based tool is dynamic in nature and can quickly update the data as it changes in the sources.
The first step in making a successful report is to connect it with the data sources. You can connect multiple data sources in Google Looker Studio. These sources can range from social media platforms to software tools. This tool maintains a live data connection with the sources and will automatically add the updated data from these sources to your report.
Most people find it confusing to add data sources in Google Looker Studio. But all you need to do is something that is called a ‘data connector’.
Google Looker Studio Connectors
To connect Looker Studio data sources with your report, you need data connectors. These connectors can fetch data from different platforms, marketing software, and other tools.
Initially, Google Looker Studio could only add data from a limited number of sources but now you can connect Google Looker Studio with +1,000 different connectors. This is all thanks to the different data connectors available in the market.
There are two major types of data connectors that you can use in the Google Looker Studio:
Organic Data Looker Connectors
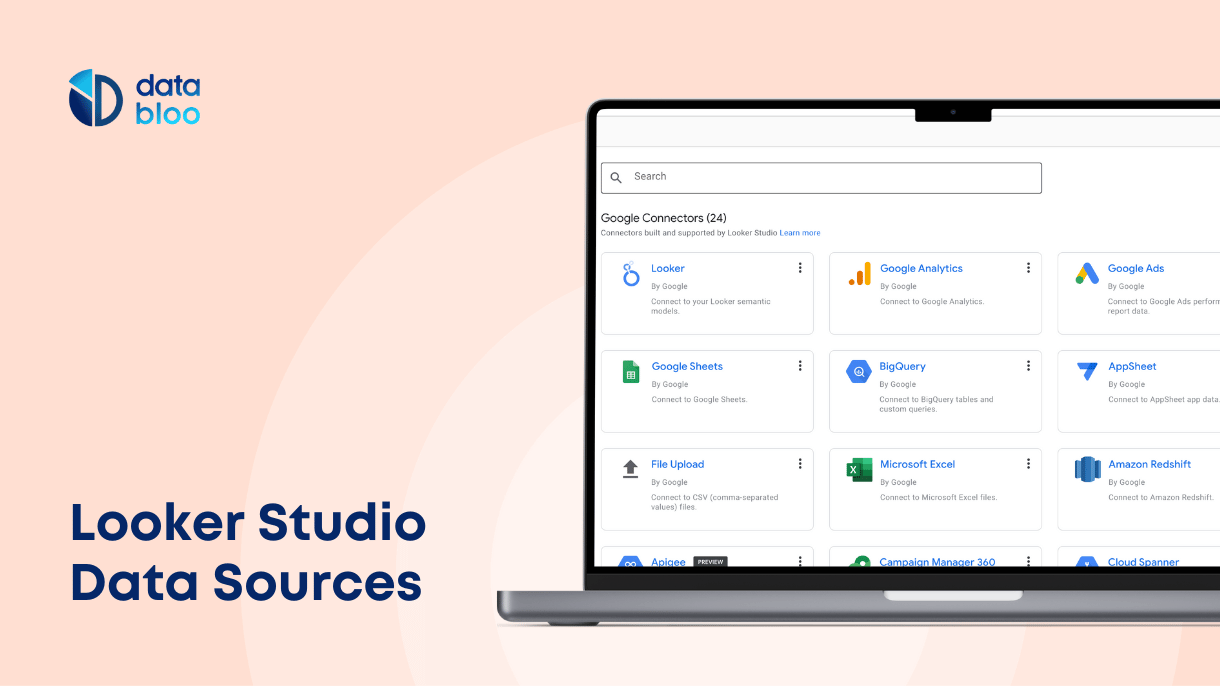
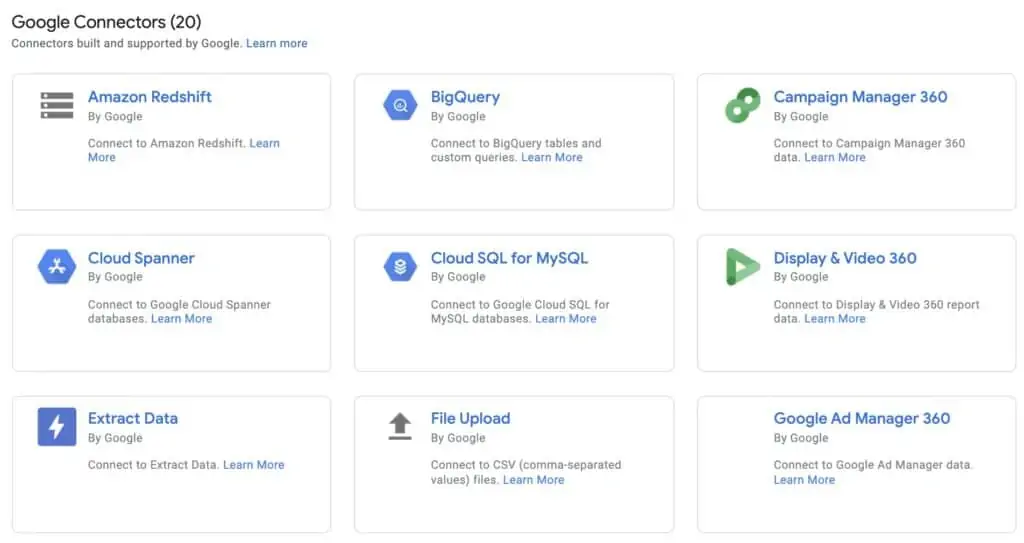
Google itself has made some different data connectors. They can link the Google Looker Studio with different data sources such as Google Analytics, Google Ads, Google Search Console, Google Sheets, and Youtube among others. You can simply add data from other Google tools to make a thorough report or presentation. The best part is – these connectors are free and easy to use, as they have been developed by Google.
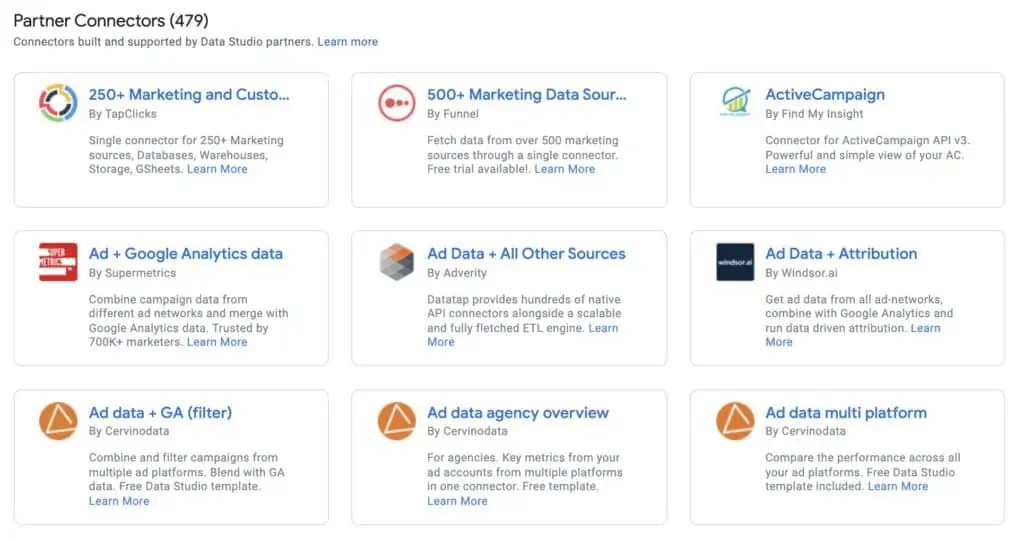
Paid Looker Studio Connectors
If you are trying to use other sources, you might need to buy a data connector to use with Google Looker Studio. There are several connectors available that are built by third-party partners such as Power My Analytics, Supermetrics, and Windsor. Some of them are available for free (Gladior) and some need to be purchased before they can be used to connect with a particular data source.
Popular data sources:
- Social & Advertising Platforms: Facebook, Instagram, LinkedIn, Google My Business, Tik Tok, Pinterest, Twitter, Bing, Amazon [Paid]
- Softwares: Mailchimp, Hubspot, Salesforce, Constant Contact [Paid]
- Other third-party data sources: SEMrush, SE Ranking [Free]
Data sources can have different requirements, so you might need to read the instructions carefully before you can use the data connector to create an instance of the data source in Google Looker Studio. Once you get the hang of it, you can add any available data source and make amazing reports and presentations.
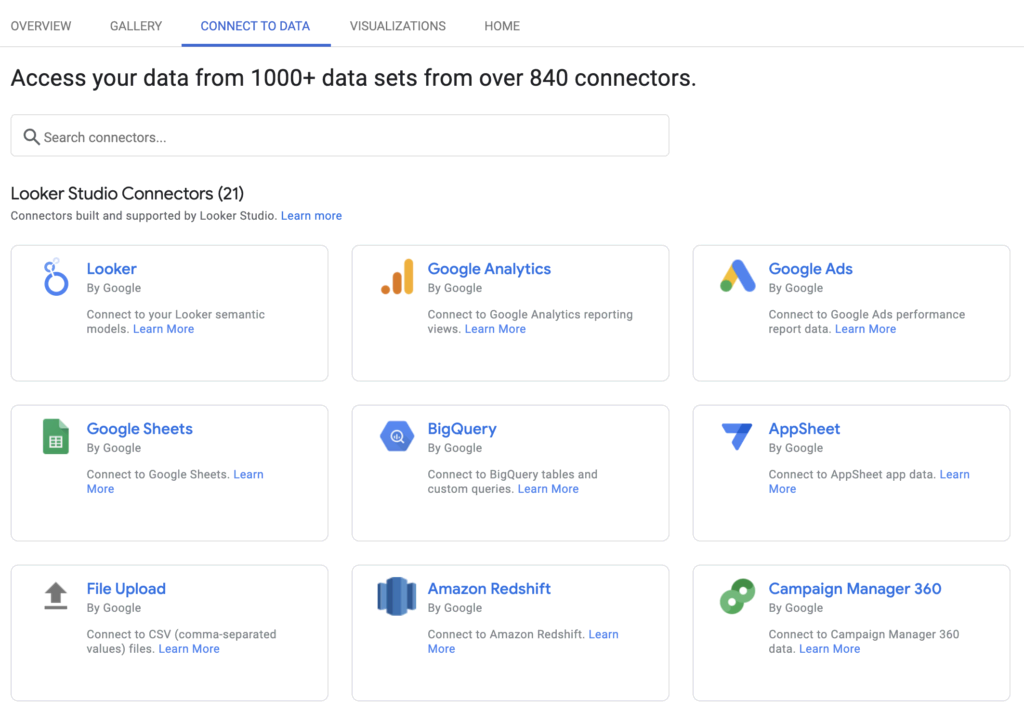
Here is the complete list of the available Looker Studio data sources:
5 steps to add a data source in Looker Studio
In Looker Studio, you can create a data source in two different ways, either through the homepage, a reusable data source, or within a report, an embedded data source. A reusable data source is available across different reports and can be shared and used across the organization. On the other hand, an embedded data source, which is created while building a specific report, is used only within that report. This provides higher flexibility for collaboration among the report editors, as their changes do not affect other reports. Also, an embedded data source can be easily converted into reusable. Below you will find the steps to create a reusable data source.
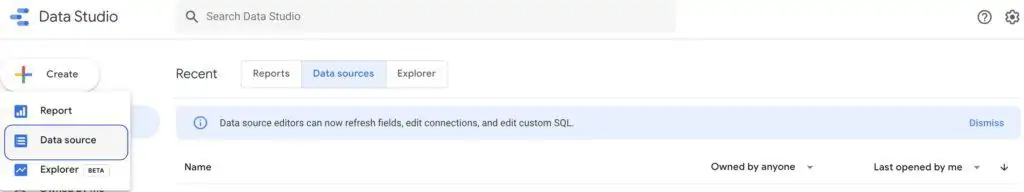
1) Go to your data sources
2) Click on plus button “Create” and then “Data Source”
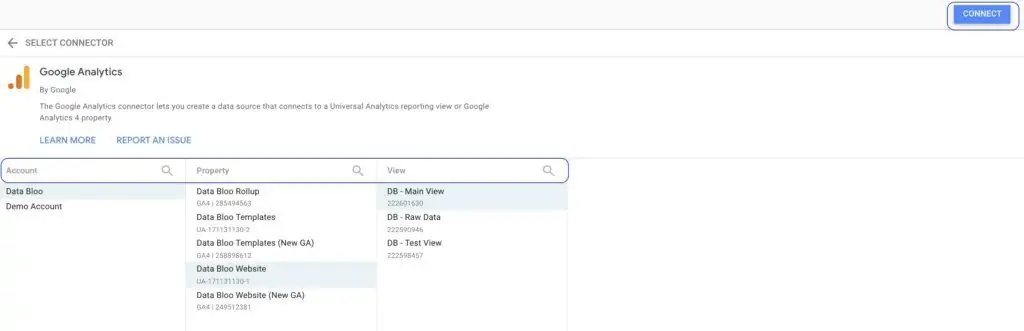
3) Select your data source (i.e. Google Analytics) from the list
4) Connect your account / property / view
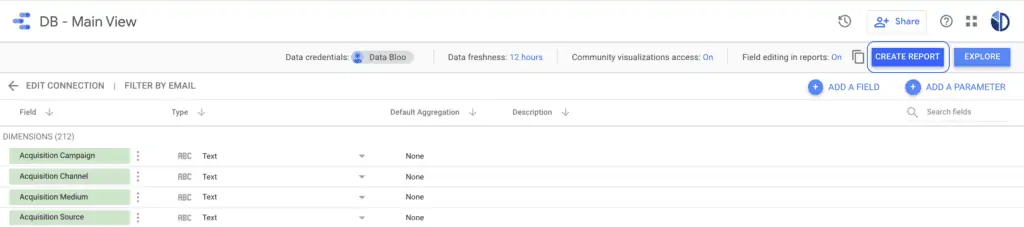
5) Create a report using this data source
Tip: In case you have already started a report, you can add this new data source by opening this report and adding a new data source to it. More specifically go to the Menu > Resource > Manage added data sources > Add a data source > My data sources > Select the most recent data source.
In order to create an embedded data source, you simply open your report and add a brand-new data source to it (Menu > Add data > Connect a data source).
Data Source Schema
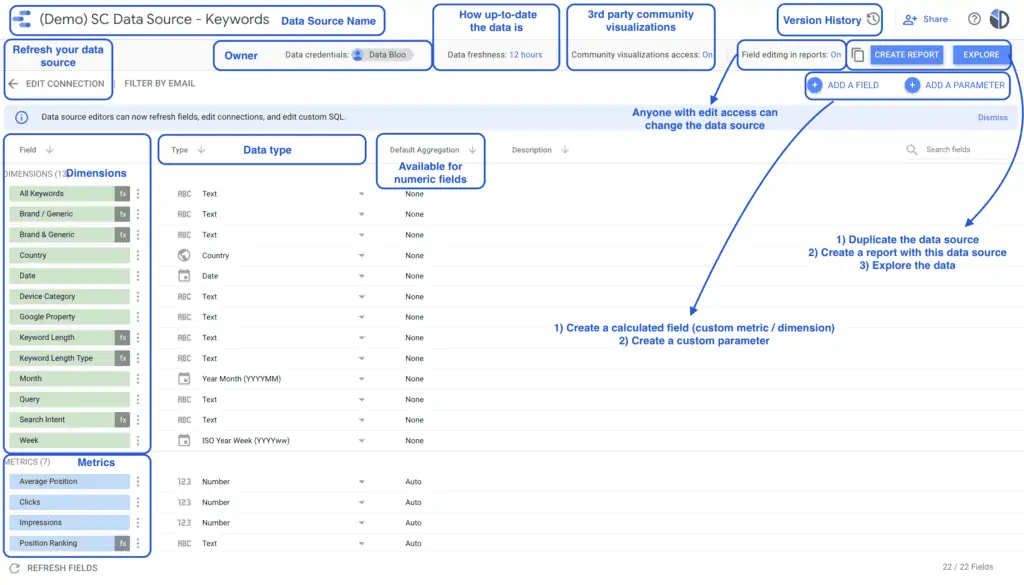
Now that you learn how to connect a data source to Google Looker Studio, let’s see what is the data source schema. The data source schema is the structure of the metrics and dimensions that your data set has. You (or any other people who have edit access to your data source) can use this schema in order to clean, edit your data and get the most out of your data source. For instance, you can create new calculated fields and functions, add new custom parameters and change the type of your data.
Below you will find a screenshot showing the parts of a data source schema.
How to refresh a data source in Looker Studio?
Sometimes you have to refresh a data source that is connected with your report, as there might be some changes in the fields. For instance, if you want to 1) add new fields or remove existing ones and 2) rename or reorder these fields, then you should refresh your data source. In order to do this, you simply follow the below steps:
- Go to your data sources
- Select the specific data source
- Click “Refresh Fields” at the bottom of the page
- Continue / apply
And your data source is up to date with the latest changes.
Now that you know the available Looker Studio data sources and connectors and how to add and/or refresh a data source with your reports, let’s see what type of graphs you can use with Looker Studio.