Table of Contents
As Looker Studio reports grow more complex, managing what users see becomes just as important as the data itself. In January 2026, Looker Studio introduced a powerful update that lets you show or hide individual charts, components, and even entire pages, depending on who is viewing the report.
This feature goes far beyond simple “hide page” options. You can now control visibility using variables, duplicate and organize report pages more efficiently, and build dynamic reports that adapt to different audiences — all within a single report.
In this guide, we’ll walk through how to manage charts and pages in Looker Studio, focusing on control visibility, page actions like duplicate and reorder, and practical ways to use these features in real-world reporting.
What’s New in Chart and Page Management
Until recently, managing report visibility in Looker Studio often meant creating multiple versions of the same report — one for internal teams, one for clients, one for executives.
With the new Control visibility feature, this changes completely.
You can now:
- Hide individual charts or components from specific viewers
- Control page visibility using parameters
- Keep one “master report” that adapts based on the viewer
- Reduce report duplication and maintenance effort
This update is especially useful for agencies, internal analytics teams, and anyone building multi-role dashboards.
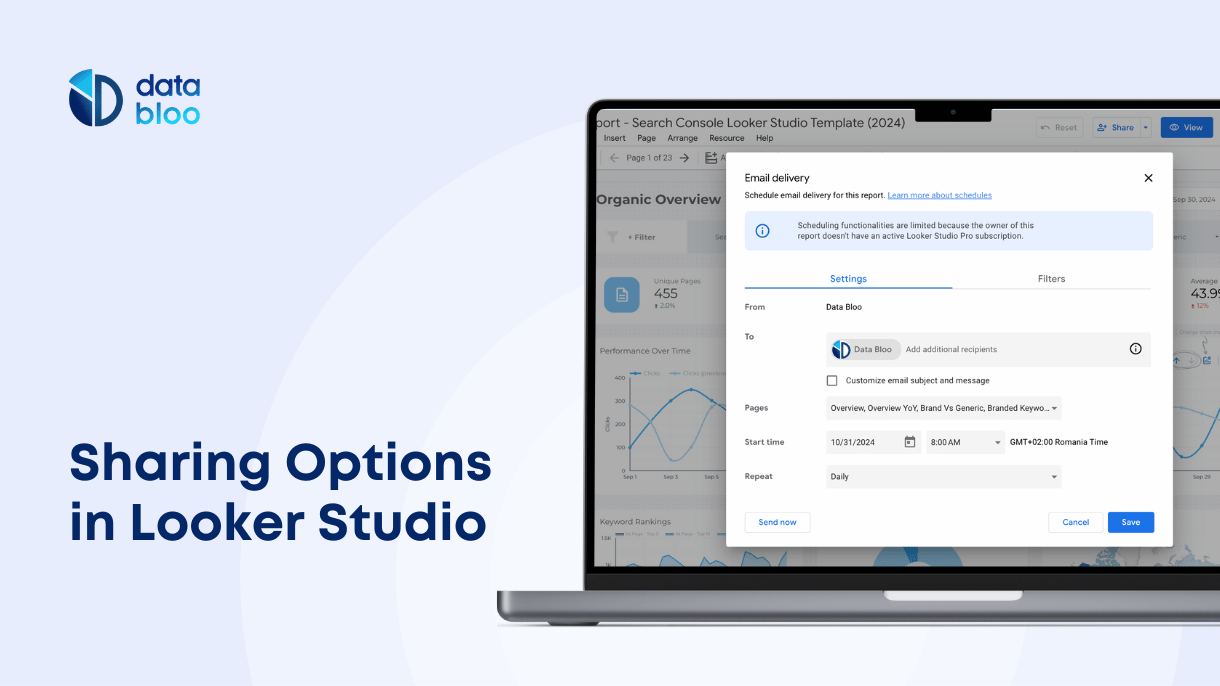
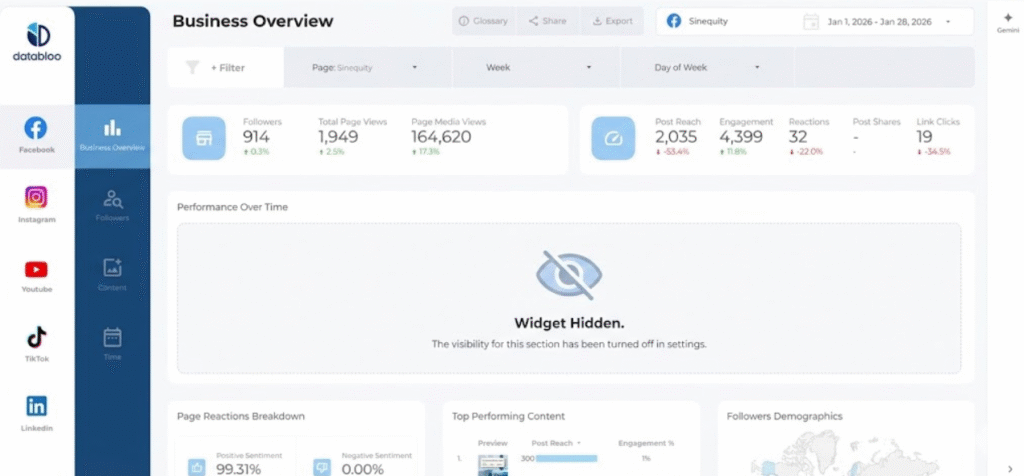
How to Control Visibility for Charts and Components
Looker Studio now allows you to hide individual charts and components either from all viewers or from a specific subset of viewers.
To configure control visibility for a chart or component:
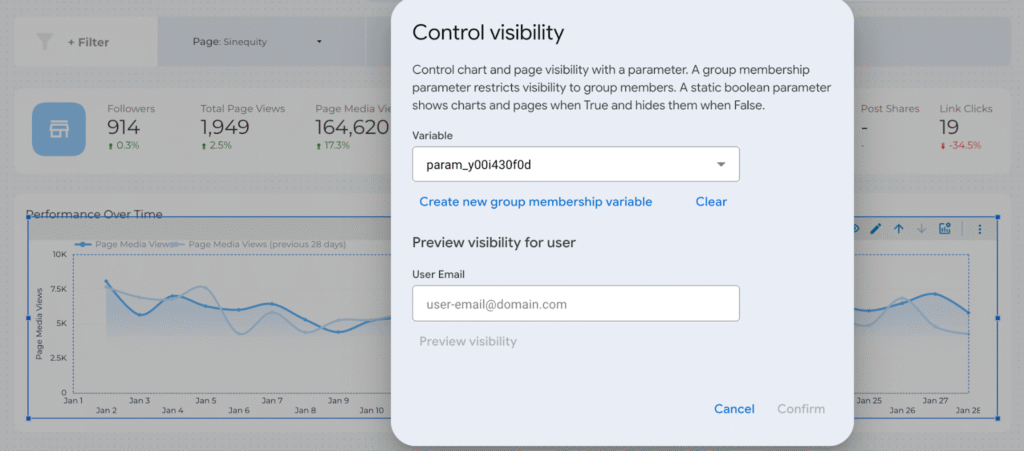
- Open your report in Edit mode
- Hover over a chart, text box, image, or other component
- Click the three-dot menu
- Select Control visibility
From here, you can decide whether the component should:
- Always be visible
- Always be hidden
- Be visible only when a specific variable evaluates to true
This allows you to hide sensitive charts, internal calculations, or advanced analysis without removing them from the report.
Using Group Membership Variables (Pro Feature)
For Looker Studio Pro users, visibility can be controlled using group membership variables.
These variables check whether the viewer’s email belongs to a specific Google Group or matches an allowed email address. If the condition is met, the chart or page is shown; otherwise, it’s hidden.
To create and use a group membership variable:
- Open Control visibility
- Click Create new group membership variable
- Add one or more:
- User email addresses
- Google Groups (recommended for scalability)
- Confirm and apply the variable
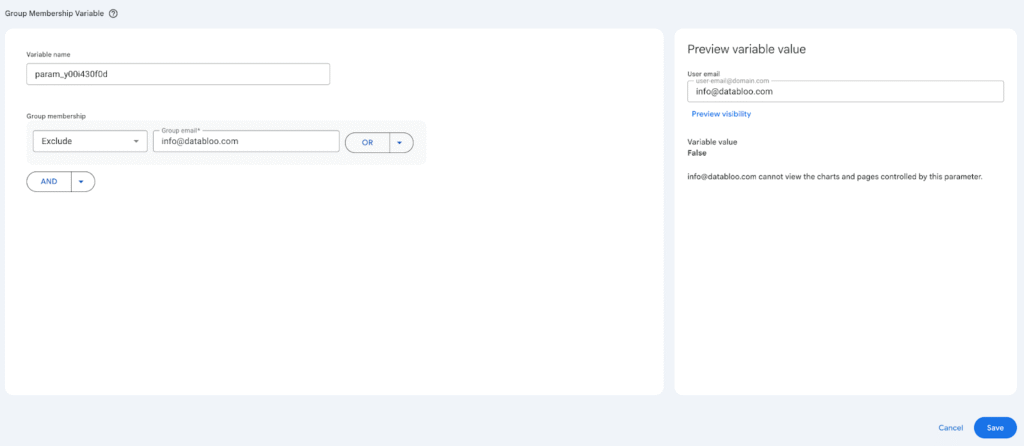
Once applied, the component becomes identity-aware and adapts automatically based on who is viewing the report.
This approach is ideal for maintaining a single report that serves different audiences without manual filtering or duplication.
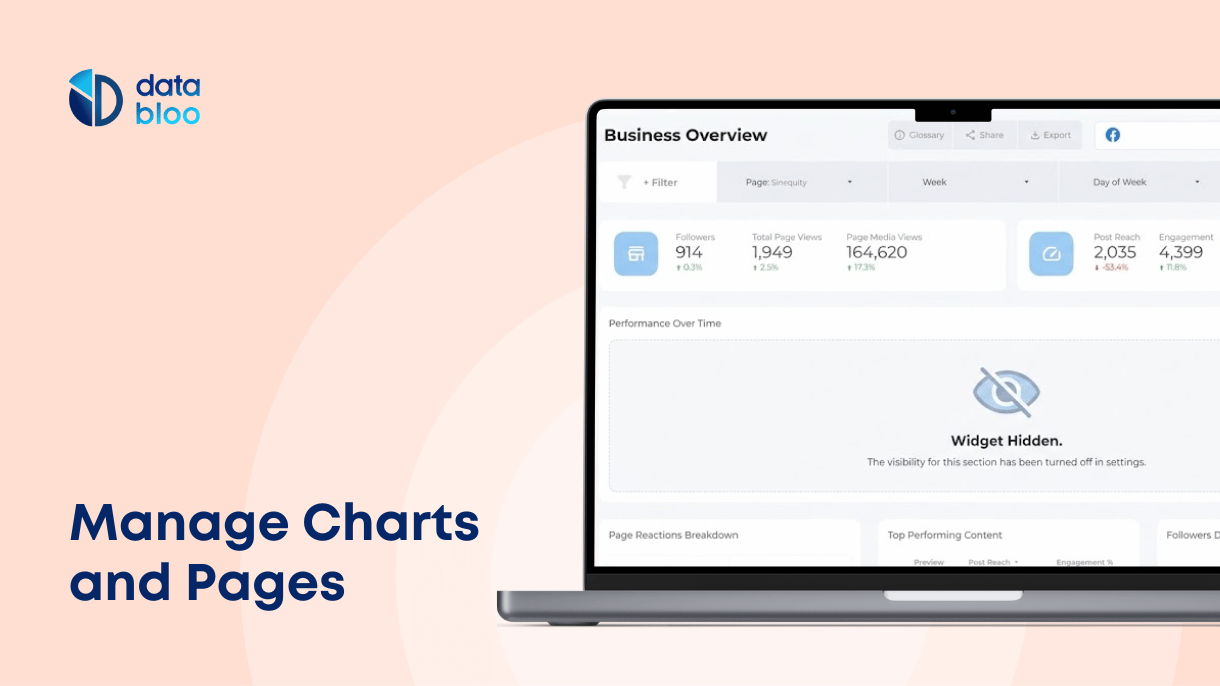
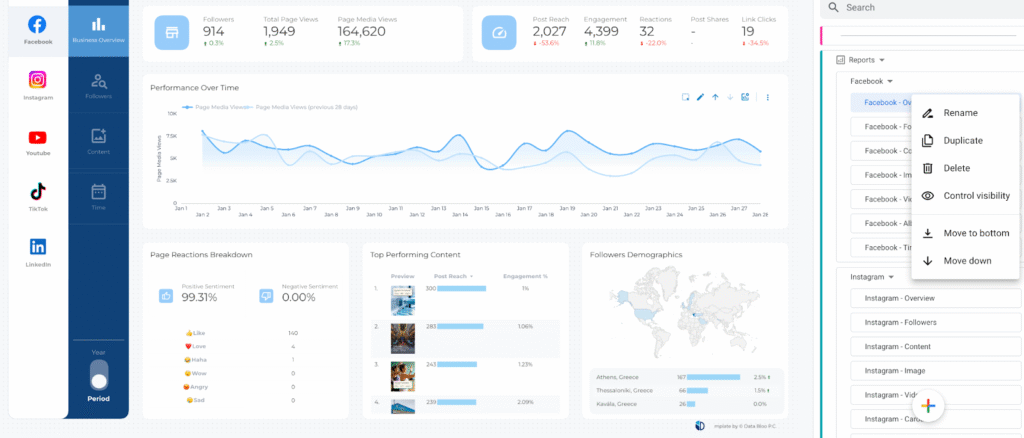
Managing Pages: Duplicate, Hide, Rename, and Reorder
Beyond chart-level controls, Looker Studio also makes it easier to manage entire pages.
When working with report pages, you can:
- Duplicate pages to reuse layouts quickly
- Rename pages for clearer navigation
- Move pages up or down to control report flow
- Hide pages from viewers while keeping them available in edit mode
You can access these options by opening the page menu and selecting the relevant action.
Page-level visibility is especially useful for:
- Work-in-progress pages
- Internal reference pages
- Advanced analysis meant only for analysts or admins
Managing Visibility, Limitations, and Troubleshooting
After setup, visibility settings and access can be managed directly inside Looker Studio.
To manage visibility and access:
- Open Settings → Share settings
- Review configured variables and access rules
- Update or remove group membership variables as needed
- Pro admins can manage variables centrally from Resource → Manage variables
There are also a few important limitations to keep in mind:
- Group membership variables can only be created by Pro users
- Editors without Pro access can remove visibility restrictions but cannot re-add them
- Visibility controls should not be treated as a replacement for data-level security
- Viewer credentials should still be used for sensitive or regulated data
If visibility isn’t working as expected:
- Confirm the viewer’s email matches the variable configuration
- Check that Google Groups are correctly synced
- Verify the report is viewed in View mode, not Edit mode
These controls are designed to simplify report UX, not replace proper data governance.
Practical Use Cases for Control Visibility
1. Executive vs. Team Reporting
Show high-level KPIs to executives while hiding detailed breakdowns and diagnostic charts that are only relevant to analysts or performance teams.
2. Multi-Client or Multi-Department Reports
Use group membership variables to display only the relevant sections of a report to each client or department, all from a single master dashboard.
3. Cleaner Reports for Non-Technical Users
Hide complex calculations, blended data tables, or experimental charts from general viewers while keeping them available for internal analysis.
Final Thoughts
The ability to manage charts and pages using control visibility marks a major step forward for Looker Studio reporting. Instead of maintaining multiple versions of the same dashboard, you can now build flexible, role-aware reports that adapt automatically to the viewer.
When combined with page duplication, ordering, and hiding options, these features make Looker Studio feel less like a static dashboard tool and more like a dynamic reporting platform.
If you’re building advanced reports for teams, clients, or stakeholders with different needs, mastering visibility controls will quickly become essential.