Table of Contents
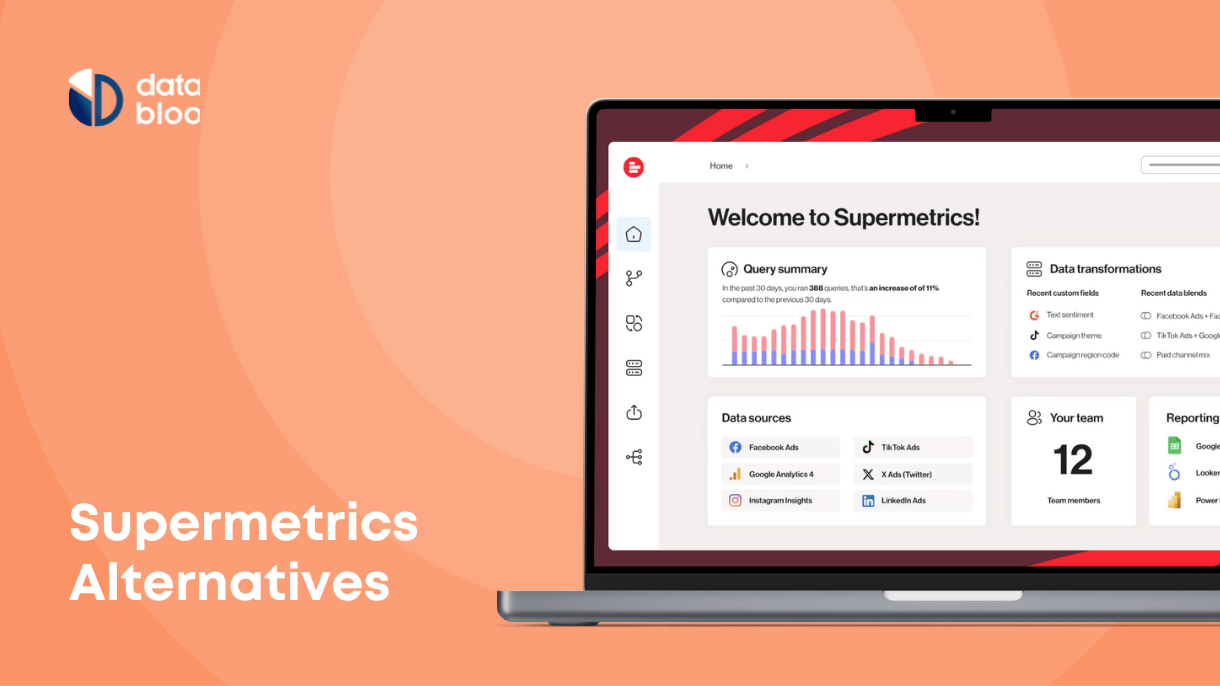
Although Supermetrics is a great product that helps hundreds of teams to solve their data problems, fortunately it’s not the only one.
And if you are looking for opportunities to save money, or find a more intuitive alternative for your data needs, or simply looking for features that Supermetrics does not offer or hides behind premium pricing plans, you’re in the right place.
In this article, we cover 9 Supermetrics alternatives, cover their strengths and considerations to save you time and maybe help you find a more suitable tool for your specific project or company.
Let’s dive in!
Key Qualities To Focus on When Comparing Supermetrics Alternatives
Supermetrics alternatives vary in scope and functionality, making some a more suitable solution for a small business, while other Supermetrics alternatives are better tailored for enterprise-scale projects.
Below are the foundational metrics that the different tools will implement differently. The more nuanced differences we’ll cover further in the article when covering each alternative.
Data Connectors
Each tool on this list offers various data connectors (native integrations) out-of-box. The difference between the alternatives will come in the number of data integrations available and whether the additional connectors are locked behind a paywall.
Additionally, some tools will offer custom API and export options, while others limit or don’t support 3rd party data import at all.
Data Visualization
Supermetircs does not offer data visualization out-of-box, and instead you will have to rely on 3rd party destination platforms (e.g. Looker Studio) to visualize your data.
Most Supermetrics alternatives cna help visualize your data either through offering pre-built templates or interface for creating dashboards and reports from scratch.
Data Transformation
Supermetrics offers some data transformation features out-of-box, although most advanced options are unlocked for higher tier pricing plans.
Some alternatives on this list have more versatile data transformation options even in the same price segment as the cheapest Supermetrics plans.
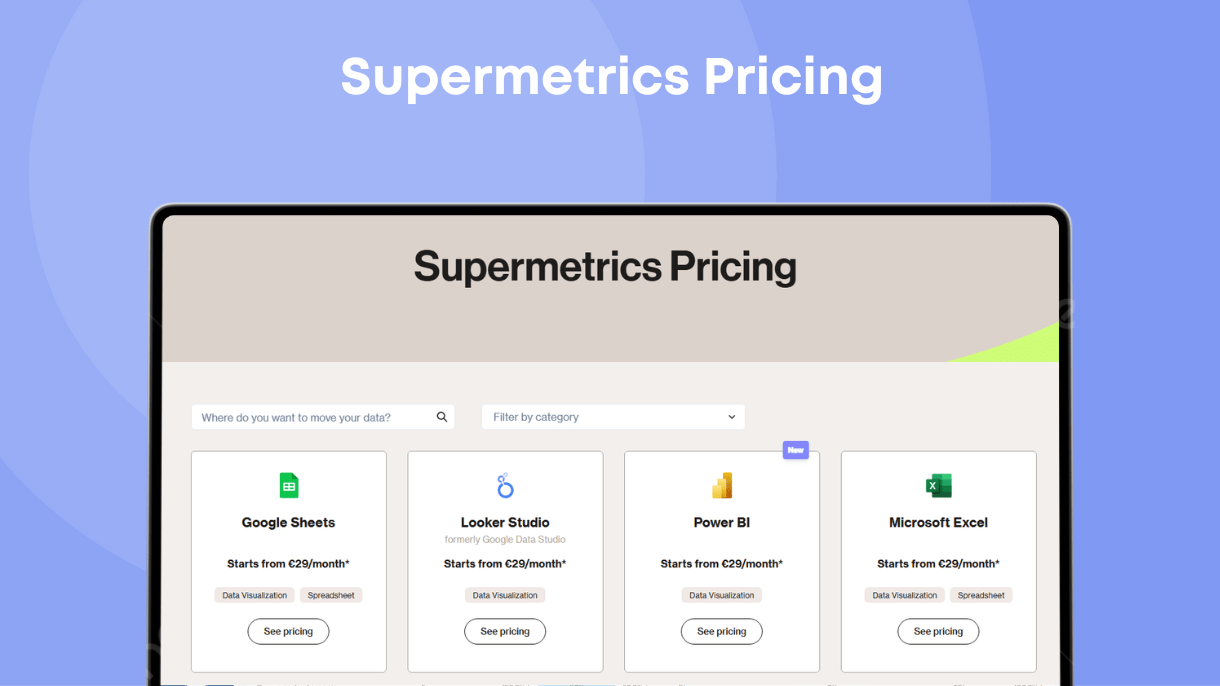
Pricing Model
Often the difference between Supermetrics and its alternatives comes down to pricing and what you are paying for: more users, more sources, or other extra functionality.
We prepared a standalone guide for Supermetrics pricing where we help you better understand it and compare the Supermetric pricing model with its alternatives.
Comparison Table: 10 Supermetrics Alternatives
| Feature / Tool | Supermetrics | Windsor.ai | Dataslayer | AgencyAnalytics | Adverity | Power My Analytics | Databox | Whatagraph | DashThis | FiveTran |
| Data Connectors | 100+ marketing platforms, including paid media, web analytics, social media, SEO, e-commerce, email, and CRM | 325+ data connectors and integrations covering various marketing platforms | 45+ connectors for Looker Studio; lacks Excel and Tableau integrations | Supports major marketing platforms; specific number of connectors not specified | 600+ connectors, including platforms like Amazon Selling Partners, Mailgun, eBay, Zendesk, and Twitch | 40+ connectors; flexible and scalable with any connection available on any plan | 70+ integrations; focuses on marketing and sales platforms | 55+ marketing channels; all integrations available regardless of the plan | 34+ integrations; primarily focused on marketing platforms | Supports a wide range of data connectors across various domains |
| Data Destinations | Google Sheets, Excel, Looker Studio, BigQuery, Snowflake, Azure Synapse, Amazon S3, Redshift, Tableau, Power BI, and more | Google Sheets, Looker Studio, Excel, BigQuery, Google Analytics | Google Sheets, Looker Studio, Power BI, BigQuery, Amazon S3, Redshift | Built-in dashboards and reporting within the platform. Can’t transfer data to data warehouses. | Data Warehouses, Data Lakes, BI tools, and Audience platforms | Google Sheets, Looker Studio, Excel, BigQuery, Google Analytics | Databox platform with native dashboards and reports | Whatagraph’s own platform with drag-and-drop report and dashboard builder | DashThis platform with pre-built dashboards | Various data warehouses and BI tools |
| Data Transformation | Limited transformations; custom fields with AI feature allows creation of new fields but cannot transform existing fields | Offers data transformation capabilities. | Basic data organization; lacks advanced transformation features | No advanced data transformations | Advanced and adaptable transformation options, including coding custom transformations and AI-assisted features | Limited transformation capabilities; lacks custom field creation | Focuses on visualization; transformation capabilities not specified | Offers data organization and blending within the platform | Provides only visualization tools, no advanced data transformation | Supports data transformation through various tools |
| Visualization & Reporting | Relies on third-party tools like Looker Studio, Excel, Tableau, and Power BI for visualization | Provides visualization through integrated tools. | Uses Looker Studio and Power BI for visualization | Built-in dashboards and reporting within the platform | Offers a centralized platform with visualization capabilities | Utilizes third-party tools like Looker Studio and Excel for visualization | Native dashboards and reports within the Databox platform | Includes drag-and-drop report and dashboard builder with media widgets and customization | Provides pre-built dashboards within the platform | Supports visualization through various BI tools |
| Automation & Scheduling | Supports data refresh scheduling; lacks built-in marketing reporting automation | Offers automation features. | Provides scheduling capabilities. | Includes scheduling and automation within the platform | Offers automation features | Provides scheduling capabilities. | Includes scheduling and automation within the platform | Offers scheduling, adding a review stage, and customizing emails for marketing reporting automation | Includes scheduling and automation within the platform | Supports automation through various tools |
| Data Storage Model | Does not store data permanently; uses encrypted caches for performance. Data remains in short-lived encrypted caches and is not stored long-term. | Provides data warehousing for all customers, allowing for centralized storage of marketing data. | Stores data in Google Sheets, Looker Studio, Power BI, BigQuery, Amazon S3, and Redshift. | Warehouses data from integrations to provide more robust reporting. Stores up to 365 days of historical data for most integrations, encrypted at rest. | Stores data extracts in various storage solutions, including Amazon S3, Azure Blob Storage, Google Cloud Storage, and SFTP. Offers flexible storage options based on user preferences. | Offers a Hosted MySQL solution for data warehousing, allowing users to own their data and store it within their country to meet GDPR requirements. Also supports exports to BigQuery and other destinations. | Stores data within its own platform to provide dashboards and reports. | Stores data within its platform, offering drag-and-drop report and dashboard builders. | Stores data within its platform to provide pre-built dashboards. | Supports a wide range of data connectors across various domains. |
| Connects to Data Warehouses / Data Lakes | ✅ Yes | ✅ Yes | ✅ Yes | ❌ No | ✅ Yes | ✅ Yes | ❌ No | ❌ No | ❌ No | ✅ Yes |
| White Labeling Support | ❌ No | ✅ Yes | ❌ No | ✅ Yes | ✅ Yes | ❌ No | ✅ Yes | ✅ Yes | ✅ Yes | ❌ No |
| Data Update Frequency | 1 to 3 days, depends on data source | 24 hours, hourly for enterprise plans | Daily | – | 24 hours, can schedule more frequent fetches | 24 hours | 1 to 24 hours, depends on price plan | 30 minutes | Almost every days | 6 hours, but can be faster with premium pricing plans |
| Custom API Access | ✅ Yes | ✅ Yes | ✅ Yes | ✅ Yes | ✅ Yes | ✅ Yes (Enterprise) | ✅ Yes | ✅ Yes | ❌ No | ✅ Yes |
| AI Insights | ✅ Yes | ✅ Yes | ❌ No | ✅ Yes | ✅ Yes | ✅ Yes | ✅ Yes | ✅ Yes | ❌ No | ✅ Yes |
Windsor
Works for: marketing ops teams and attribution analysts
Windsor.ai is a no-code marketing ELT and attribution platform that automates extraction from 325+ sources and syncs into any warehouse or BI tool.
Important distinction with Supermetrics is that Windsor provides built-in data destinations with no premium-connector fees. Both tools also substantially differ in how they manage schemas, data transformations, and reporting workflows.
For example, with Windsor.ai, basic transformations (e.g., channel grouping, currency conversion) can be applied within the platform, and you can push raw or lightly modeled data downstream. In Supermetrics, users mostly rely on separate ETL\ELT tools or spreadsheet formulas post-extract or have to upgrade to costly enterprise plans.
Windsor also offers pre-built reporting templates for Tableau, Looker Studio, an Excel, and some marketing specific custom dashboards.
Highlights of Windsor.ai:
- Customizable dashboard templates for quick reporting
- No-code ELT
- 325+ data connectors and destinations
Dataslayer
Dataslayer is a marketing data integration and reporting tool that helps marketers and analysts gather, manage, and visualize data from various digital marketing platforms.
It has a user-friendly interface that seamlessly integrates with tools like Google Sheets, Looker Studio, BigQuery, and others.
The difference between Dataslayer and Supermetrics comes down to pricing structure and out-of-box visualization options. Unlike Supermetrics which charges based on number of users and connectors, Dataslayer plans allow for unlimited users and access to all connectors.
It’s worth mentioning, that if you’re an existing Supermetrics user, Dataslayer provides a Supermetrics Query Import tool to help you migrate queries from Supermetrics.
Some prominent features of Dataslayer:
- Unlimited number of users (usage based pricing)
- SQL queries
- Import queries from Supermetrics
- Customizable dashboards and data blending
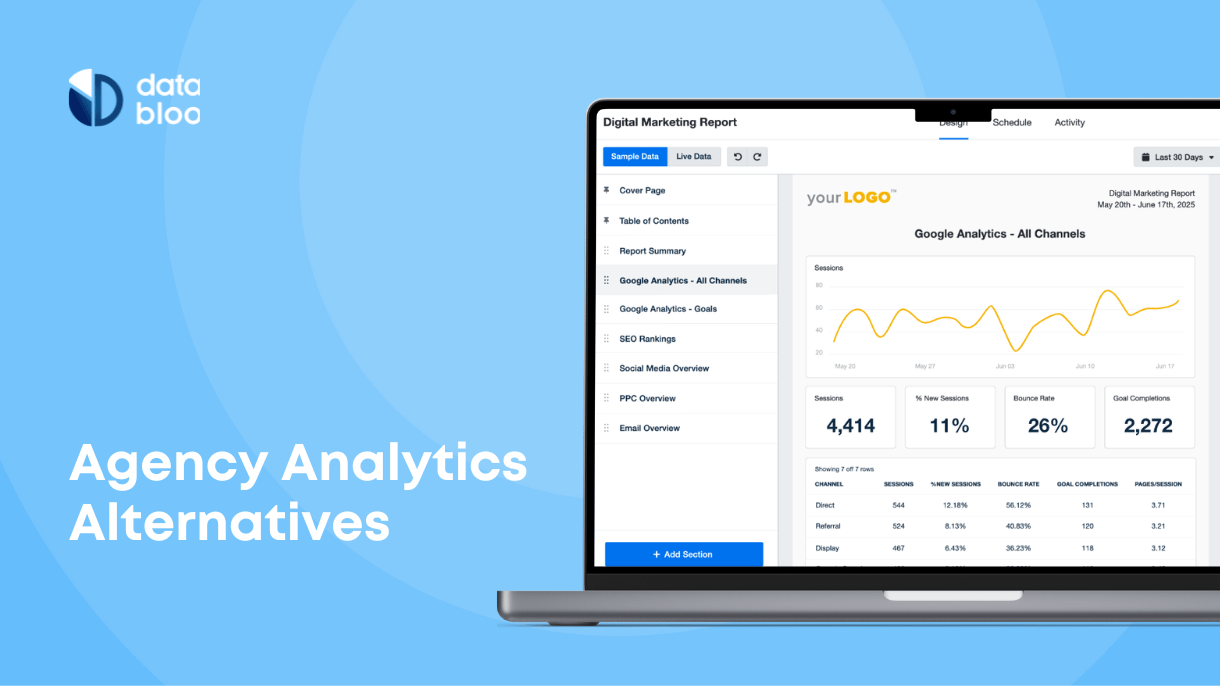
AgencyAnalytics
AgencyAnalytics is an all-in-one client reporting platform built for agencies, offering 80+ native integrations, automated white-label reports, customizable dashboards, and agency management tools within its own interface.
AgencyAnalytics integrates with over 80 marketing, analytics, SEO, and call-tracking platforms, providing pre-built widgets for each source.
AgencyAnalytics centralizes data ingestion, storage, and visualization within its own cloud-based platform, while Supermetrics focuses on extracting raw data into external destinations.
AgencyAnalytics is tailored for marketing and digital agencies that require streamlined, client-friendly reporting.
Highlights of AgencyAnalytics:
- In platform reporting
- Data warehousing
- While labeling
Databloo
Databloo is a great Supermetrics alternative if you need simplicity of visual dashboards combined with versatility of Looker Studio.
Databloo offers dozens of templates for every type of marketing report an agency needs, from SEO and PPC to social media and e-commerce reporting.
Depending on the template, Databloo will connect to specific data sources (Google Ads, Google Analytics, Facebook) and populate the dashboard with your data.
You can customize templates any way you like: add labeling, move around or rearrange elements, change currency, time, and use built-in filters to focus on specific aspects of your data.
Here are the most prominent Databloo features compared to Supermetrics:
- Unlimited number of accounts
- Customizable visual templates
- Custom master template
- Free demo
- Access to free Looker Studio connectors
Adverity
Works for: mid-to-large enterprises
Adverity is an enterprise-grade, fully integrated data platform designed to connect and manage data at scale.
It connects to over 600 data sources (including SaaS apps, databases, event streams, custom APIs) and supports 26+ destinations such as BigQuery, Snowflake, Azure SQL, Amazon S3, Power BI, and Looker Studio.
It boasts such features as automated anomaly detection, schema drift handling, and audit logs while Supermetrics relies on external tools to achieve that.
In short, Adverity is a powerful platform with a costly pricing developed for each particular client. Adverity can be cost-prohibitive for smaller teams, requires a longer onboarding cycle, and pricing transparency is limited due to custom quoting.
Highlights for Adverity:
- Extensive connector library
- AI-Powered data suite
- Enterprise-grade security
- No-code and code-based workflows
Power My Analytics
Works for: small to mid agencies that don’t need complex ETL pipelines or granular reporting
Supermetrics and Power My Analytics both serve as data connectors for marketing and analytics platforms, but target different user needs and architectures. Supermetrics offers 100+ connectors with a strong emphasis on granular data extraction into spreadsheets, BI tools, and cloud data warehouses, complete with custom metrics, premium data sources, or advanced destinations such as Snowflake and Amazon S3.
Power My Analytics, by contrast, provides 50–60+ native connectors, free data warehousing for all plans, and seamless integration into Google Sheets, Excel, Looker Studio, and its own reporting hub at a significantly lower price point.
While Supermetrics excels for analysts and enterprises requiring heavy-duty ETL, historical backfills, and complex transformation, Power My Analytics is optimized for small to mid-sized agencies and marketers who need rapid setup, responsive support, and predictable cost policy without managing a full data stack.
As a drawback, Power My Analytics offers fewer native connectors (50–60+ vs. 100+), no direct API endpoints for custom BI tools, and less flexibility in destination choice beyond its own hub, spreadsheets, and Looker Studio.
However, Power My Analytics offers more predictable, lower-cost plans for small teamsFor example, Power My Analytics includes free, managed warehousing whereas Supermetrics reserves this functionality for enterprise pricing tiers.
Here are some prominent Power My Analytics features:
- Free managed data warehousing
- 50+ native connectors
- Seamless integration with reporting tools
- Robust API access
Databox
Works for: mid-sized businesses, non-technical teams
Perhaps the first big difference from Supermetrics is that Databox provides pre-built templates and dashboards for data visualization, whereas Supermetrics has to rely on 3rd party tools for that.
It’s a full-circle cloud-based platform that combines data collection, reporting, and visualization capabilities under the same hood. So a quick setup and some degree of versatility (almost 100+ native integrations) make it a good choice for smaller, non-technical teams.
At the same time, the more simplified solution leads to some constraints when compared to Supermetrics: Supermetrics excels at extracting and transforming large sets of data, making Supermetrics a better choice as a dedicated ETL tool..
Databox also does not offer native ETL pipeline into data warehouses and does not support destinations beyond its in-platform dashboards and reports.
Here’s a summary of Databox features:
- 100+ native integrations
- Drag-and-drop dashboard interface
- Mobile app
- AI-powered report generation
- Team management features for agencies
Portermetrics
Works for: small to medium-sized businesses
Portermetrics is a reporting solution tailored for small and medium-sized businesses without advanced data blending and transformation needs.
It supports a handful of connectors, primarily focusing on social media and marketing platforms, and primarily integrates with Looker Studio and Google Sheet, lacking support for enterprise destinations like Power BI or Tableau.
Portermetrics pricing model is based on the number of connected accounts, which may become restrictive for agencies managing multiple client accounts.
Here are some highlights of Portermetrics:
- Unlimited user access
- All plans include access to all connectors (although not as many as other tools offer)
- Budget-friendly
Whatagraph
Works for: digital marketing agencies, e-commerce businesses without IT support looking for a scalable reporting solution
Whatagraph stands on its own with 55+ marketing sources and a lego-style visual interface. Unlike Supermetrics, it relies a lot on pre-built templates and visual interface to enable launching live KPI reporting within minutes.
Whereas Supermetrics caters to data teams, BI specialists, Whatagraph is a good in-between solution – a lot of customization will help you tailor tools to your scenario without going too much into technicalities.
Whatagraph does not natively support destinations beyond its dashboards, but offers some solid data transformation features for performing data operations within the platform.
Its connector library is smaller than Supermetrics.
Here’s a summary of Whatagraph features:
- Visual interface
- AOI insights
- 55+ integrations
- Quick exports to 3rd party tool such as BigQuery and Looker Studio
DashThis
Works for: small to mid-sized marketing agencies
DashThis is an end-to-end visualization and reporting platform often employed for its simple and straightforward workflowL pick a template, provide accounts, and use reports.
Such a simplicity is a double-edge sword: you are quite limited in controlling the view of your reports and data transformation capabilities, making DashThis a viable option for small businesses that need fast branded reporting, but leaving out more demanding data teams and in-house marketers.
DashThis loses to Supermetrics when compared by sheer number of native integrations (34 against 100+ of Supermetrics), but offers features such as automated updates and white labeling.
DashThis, unlike Supermetrics, does not natively load data to data warehouses, lacks advanced data transformations beyond merging, and does not offer historical backfills compared to up to 2 years of backfilled data with Supermetrics.
Here’s a summary of DashThis features:
- 34+ Integrations:
- Drag-and-Drop Dashboards tailored to specific small businesses niches
- White-Labeling
- Can push CSV or API data into dashboards
Fivetran
Works for: midsize to enterprise organizations
Fivetran is a fully managed ELT platform that automates extraction, schema migration, and incremental loading of data into cloud warehouses, while Supermetrics focuses on pulling marketing and analytics data into spreadsheets and BI tools before sending data into visualization providers.
Fivetran provides more pre-built data connectors (175 against 100 of Supermetrics) as well as zero-maintenance pipelines, helping data engineers to wrap up reliable data flows in minutes.
It’s worth noting that Fivetran does not provide in-platform dashboards, templated marketing reports, or white-label client portals—features that Supermetrics adds via Looker Studio and Excel connectors.
Overall, Fivetran is valuable in environments with high data volume or strict governance requirements, and a need for built-in data normalization and compliance (SOC 2, GDPR). Supermetrics, on the other hand, targets marketing teams, agencies, and small businesses that prioritize rapid access to marketing metrics in Google Sheets or Looker Studio without managing a full data stack. Its row-based pricing model can become expensive at high volumes of event or log data, whereas Supermetrics’ fixed-fee bundles could be more predictable for purely marketing use cases.
Here’s a summary of Firetran features:
- Zero-maintenance pipelines
- Deep connector library: 175+ sources
- In-warehouse modeling
- Enterprise-Grade compliance