Table of Contents
A keyword analysis is integral to any marketing campaign.
But simply tracking keywords or trying to make sense of several isolated reports will give you an illusion of knowledge at best.
That’s where an SEO dashboard comes in. A smart combination of crucial bits of SEO data from several angles and places in one dashboard lets you reveal unique insights about your SEO campaigns, save you time on reporting, and spot patterns that other marketers wouldn’t.
But with so much ranking data from all the tools and services, what should go into your SEO dashboard?
Here are 7 key components of an effective keyword performance dashboard.
Keywords Overview
A lot of time, marketers will use keyword analysis dashboards for SEO reporting.
They will report to their clients, to their colleagues, or even to themselves.
An overview dashboard is perfect for this purpose as it provides just enough information to form a big picture and yet doesn’t overload with too much data from the start.
But this is where it gets tricky: what information should this dashboard feature?
Here’s what a keywords overview dashboard should be able to do:
- Present actionable data for people with different experience in SEO. A client with no SEO experience will quickly get lost in keyword metrics, let alone several rows of them. A client who is an SEO manager themselves will be bored with basic graphs and would like to know about rankings in more detail.
Your dashboard should feature both intuitive visual graphs and numeric data segmented by several parameters to satisfy both parties. - Let quickly switch between overview mode and focused mode. By analyzing big-picture views, you can spot interesting patterns, but you need to dig deeper to validate your findings. In most analytical tools, you’ll spend time switching between different views and filters, and this added friction prevents you from being intuitive in your search.
Your SEO report dashboard should support several views in one place or one click away.
Here’s an example of a dashboard that archives both mentioned goals:
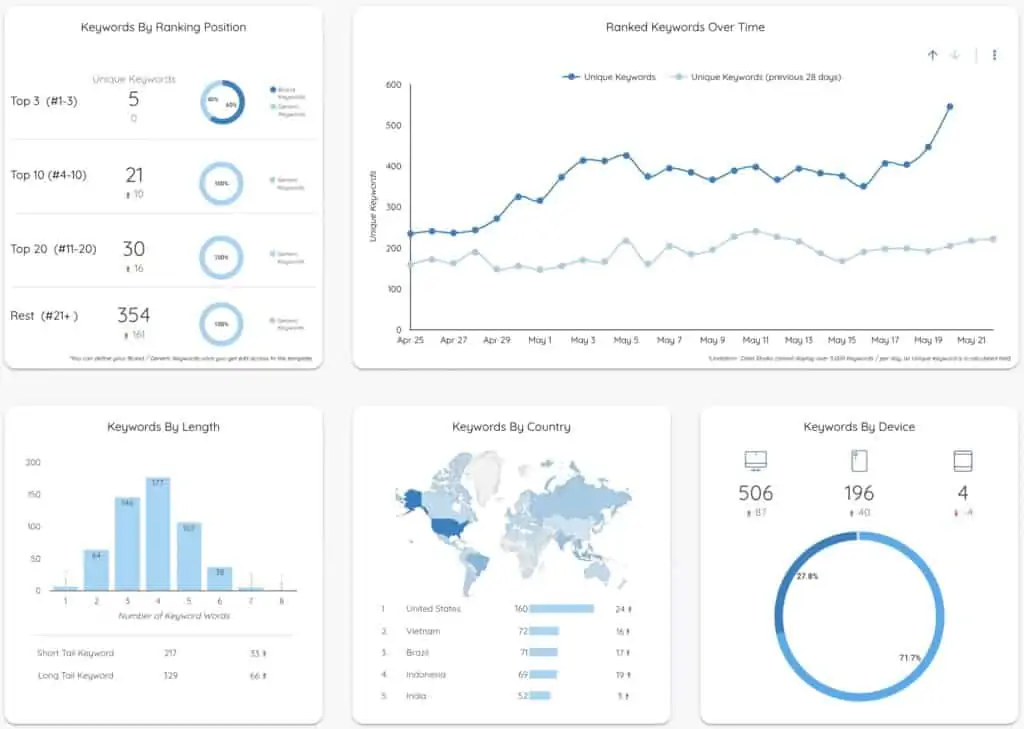
Here are the elements this dashboard contains:
- A visual graph on the right to spot website ranking trends
- Keywords breakdowns by length, country, and device to spot patterns
- An overview of keyword rankings by clusters of Top 3, Top 10, and Top 20 for deeper dive into ranking trends
- A panel on the left to switch between overview and more detailed views
Keyword Ranking Report
Every growing website ranks for hundreds and even thousands of keywords. And every keyword has several metrics attached to it, so it’s easy to get lost in this wealth of information.
A decent keyword ranking dashboard should help you answer the following questions:
What would be the most valuable metric to focus on at the moment?
What keywords should be our top priority during the next day/week/month?
What keywords are not ROI-worth chasing for now?
What types of keywords generate the most business?
A helpful keyword ranking dashboard should let you quickly go from basic keyword ranking data (position tracking, search volume) to detailed historical data on any keyword or a group of keywords you need to inspect.
Here’s an example of a dashboard keyword ranking dashboard:
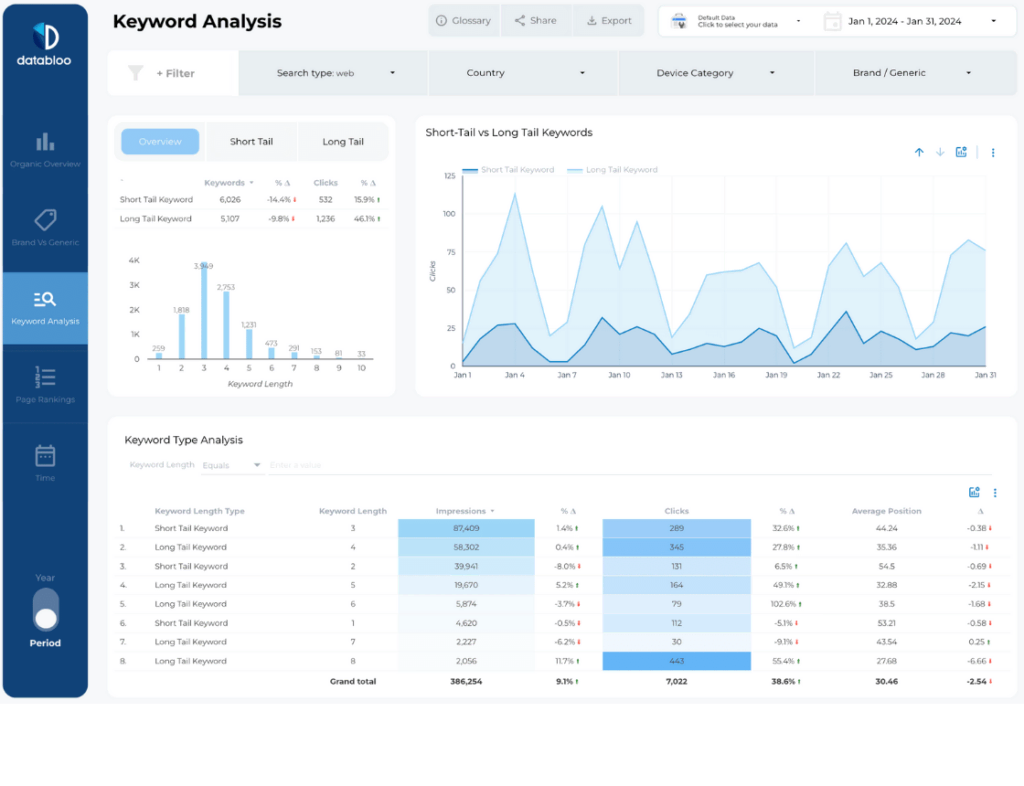
The dashboard consists of two modules. The upper modules give broad keyword ranking data for key groups of keywords as SEMrush report: Top 3 (“business drivers”), Top 10 (“performers”), Top 20 (“lacklusters”), and the rest. On the right, there’s a visual breakdown for every group you choose.
The bottom module is a google keywords performance report that lets you observe in detail the group of keywords that you surfaced in the upper module.
Switching between two modules, you can quickly find insights and ranking patterns for particular keywords and critical keyword groups.
After identifying keywords that interest us let’s get detailed historical data on each with the next dashboard view.
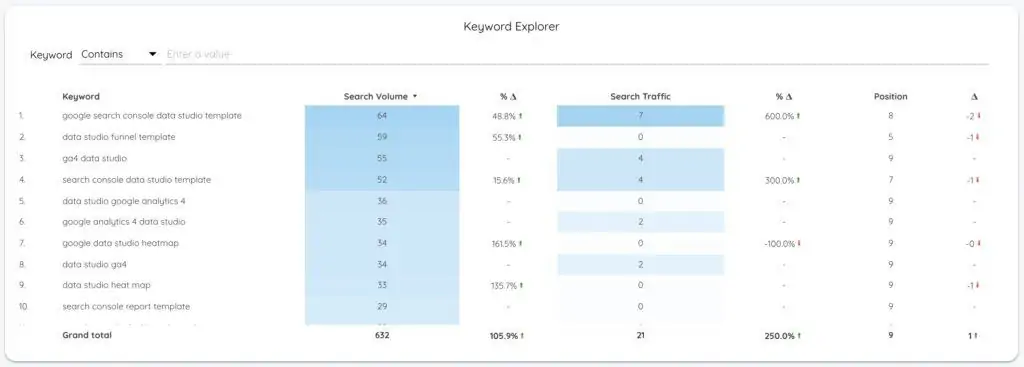
Individual Keyword Performance Report
Any keyword, or several keywords, should have detailed historical data available all in one place.
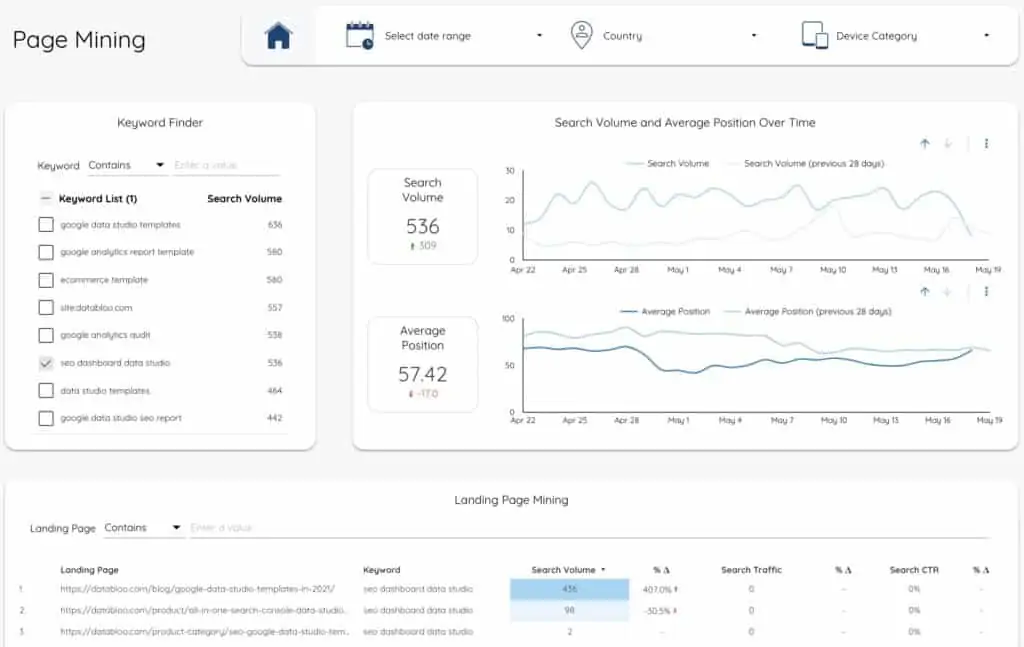
That’s where the keyword mining or page mining dashboard view comes in.
Combined with filters such as data, country, and device, you can get a 360-view of any keyword or a group of keywords:
- Ranking fluctuations over any custom period
- Mobile and desktop performance
- Historical data on search volume
- Landing page data for select keywords (CTR, target keywords, period traffic)
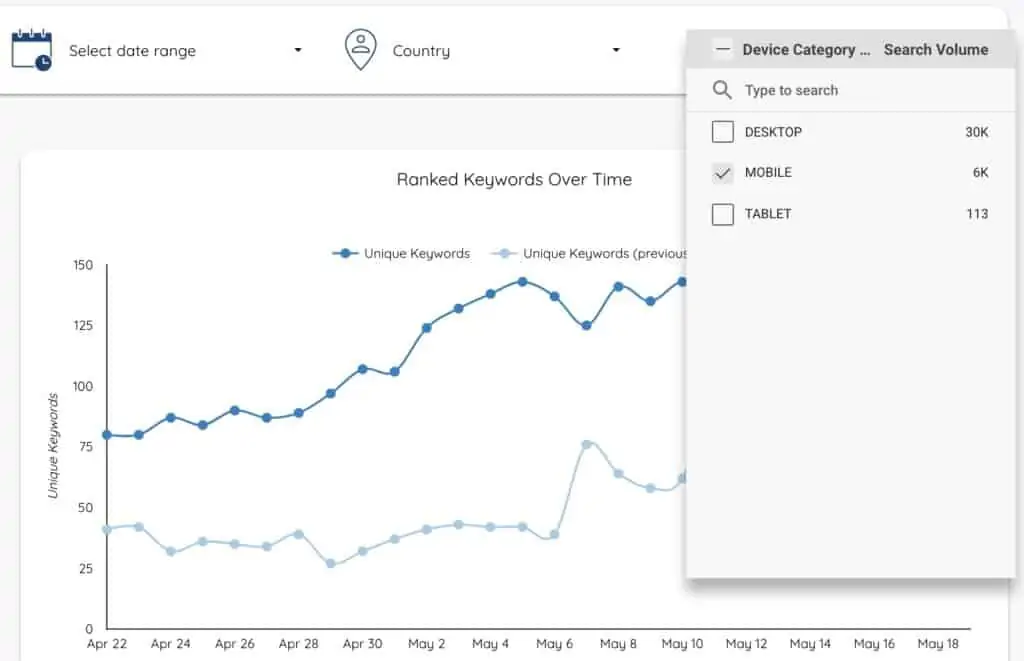
Mobile Keyword Ranking
In the present day, almost 60% of web traffic comes from mobile devices. The number will only grow over time.
Mobile rankings are different from desktop rankings, as mobile user behavior is different from desktop, affecting many ranking factors, like UX, performance, and interlinking.
That’s why your keyword analysis dashboard should quickly transform into a mobile keyword data dashboard.
Ideally, there should be a switch that lets you see all the dashboard data exclusively for mobile users.
Brand & Generic Keyword Break Down
Have you ever tried measuring brand influence and brand awareness? Not that easy.
But from an SEO perspective, a brand keyword dashboard comes as close to that as it’s possible.
Gaining historical insights into your branded and new non-branded keywords perform gives you an idea of how your marketing campaigns affect your branded search.
Here’s how a brand & generic dashboard looks like with all elements combined:
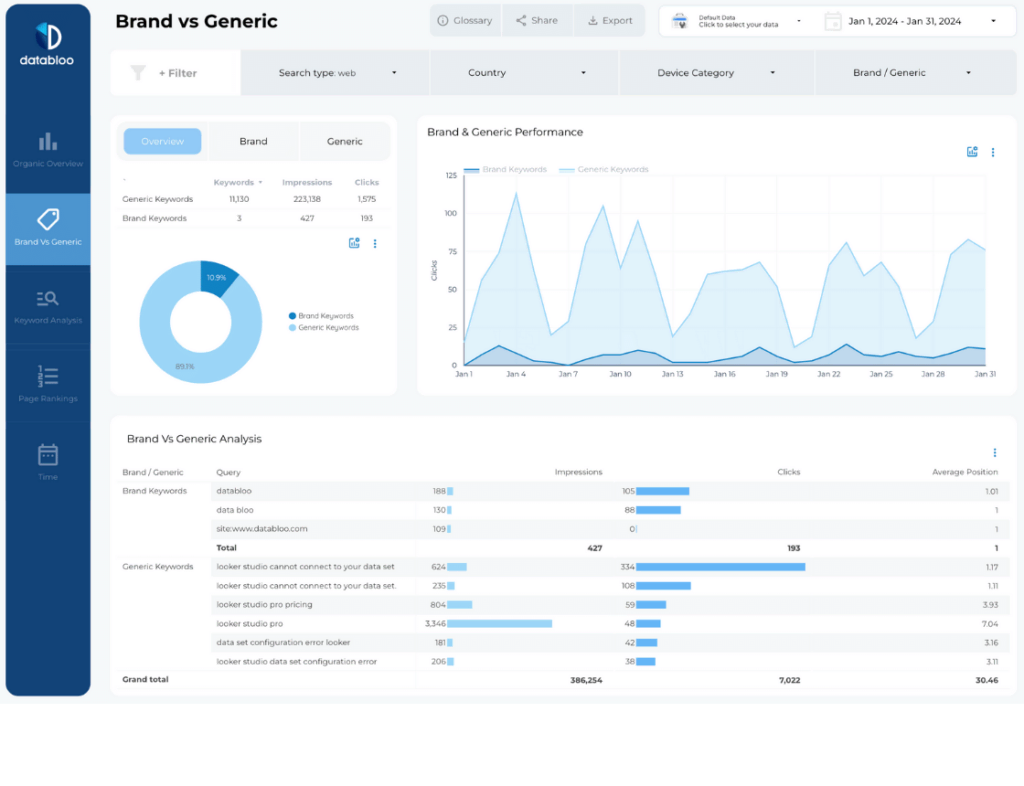
With brand keyword dashboard, you will learn:
- How often people looking for your brand, and if they are doing it more often
- What keywords do people associate your brand with
- Peaks and low of search interest around your brand (great way to track PR campaign success)
- Find out which brand keywords are driving your organic traffic
- Identify generic ranked keywords to explore content opportunities and optimize ads bids
You can test the dashboard that includes all the mentioned segments yourself with this link.
