

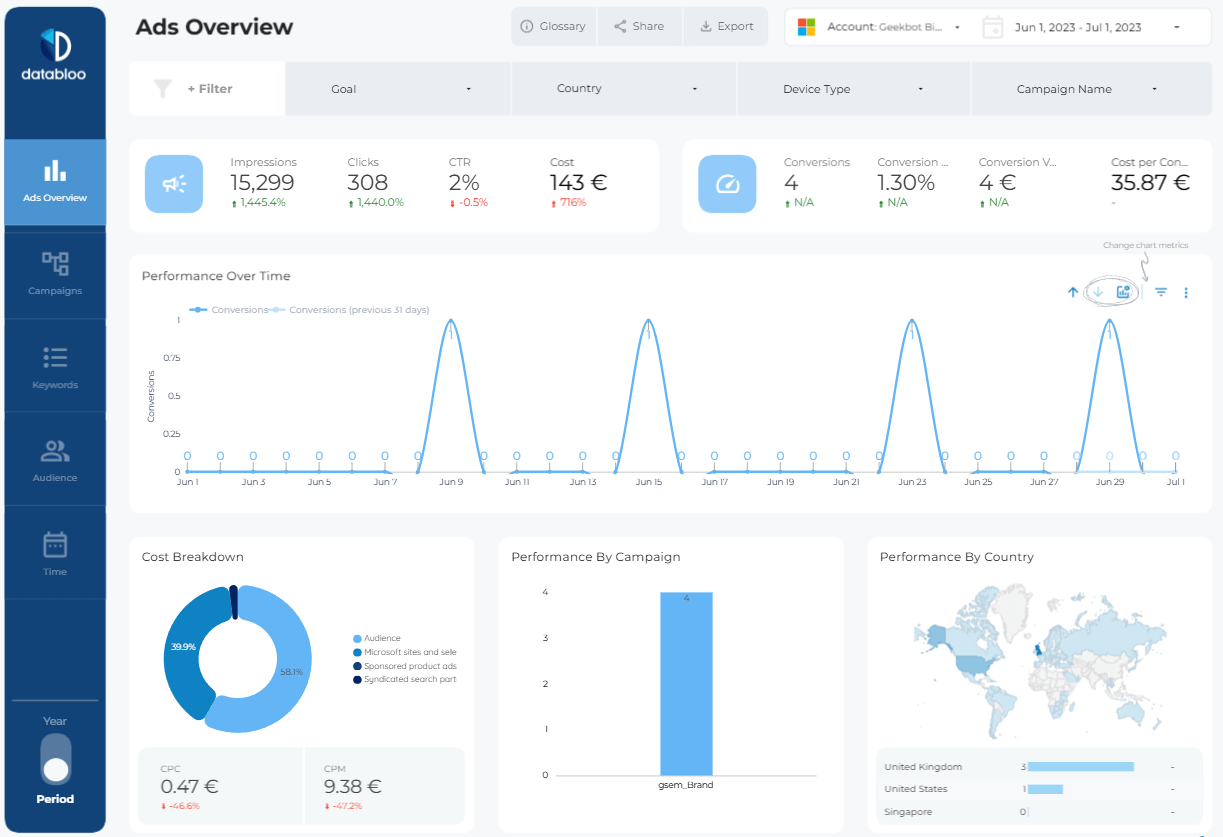
Microsoft Ads Performance Overview
The Overview dashboard gives you a high-level snapshot of your Microsoft Ads account performance, helping you quickly identify trends, spikes, and optimization opportunities.
Track key metrics including impressions, clicks, CTR, conversions, conversion rate, CPC, CPM, and cost per conversion through interactive charts and visual KPI cards.
You can quickly answer questions such as:
- Which campaigns generate the most conversions?
- How is performance changing over time?
- Which countries deliver the best ROI?
- Is my CTR improving month-over-month?
- Which campaigns consume the highest budget?
The dashboard also includes campaign breakdowns, conversion trend visualizations, and geographic performance reporting.
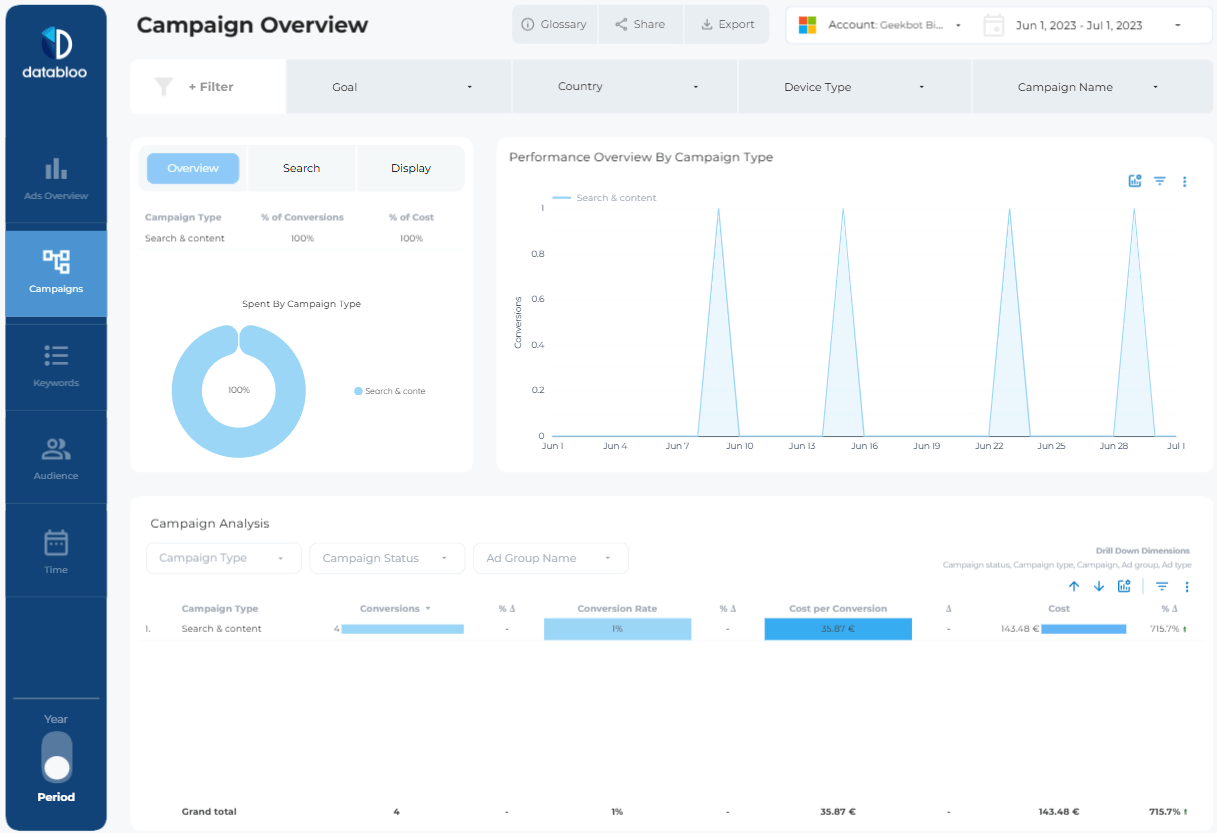
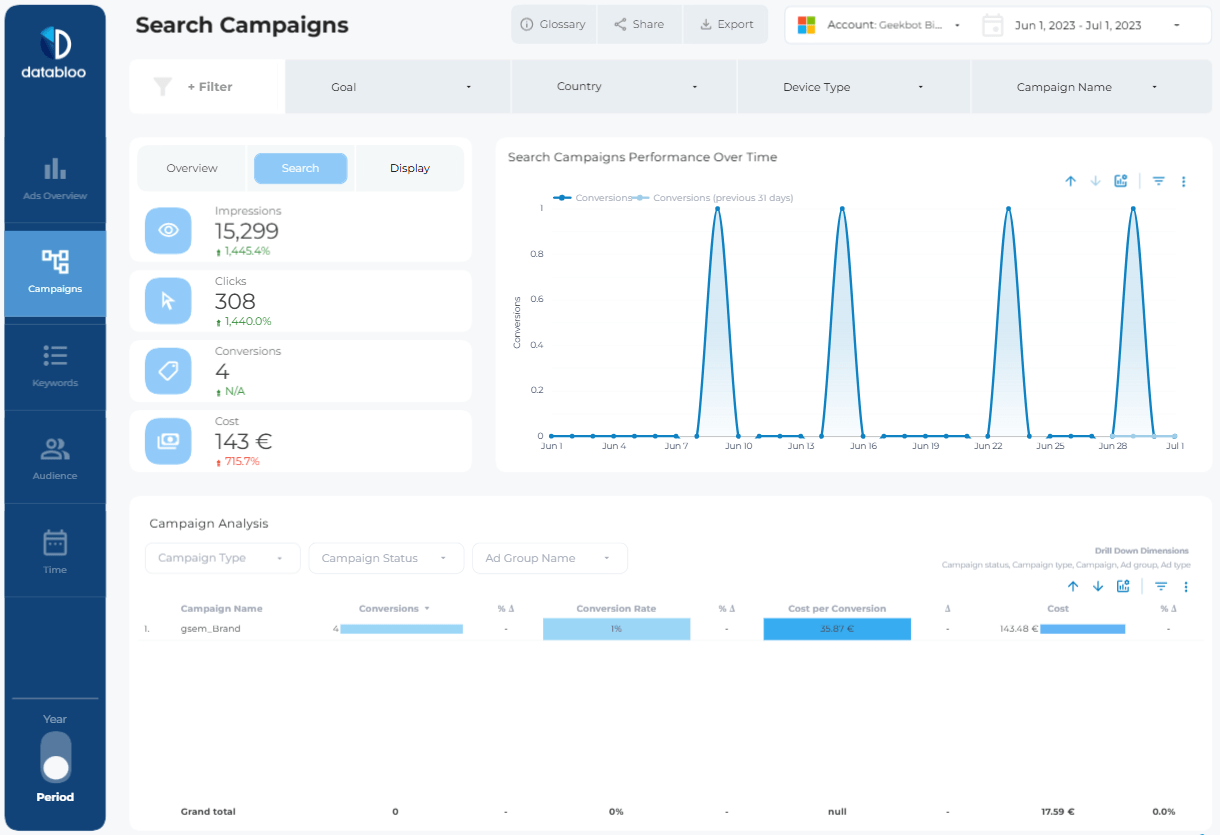
Campaign Reporting & Analysis
The Campaign section is designed to help you analyze Microsoft Ads performance at campaign and ad group level.
Instead of navigating multiple Microsoft Ads reports, you can view everything inside a single Looker Studio dashboard with drill-down filters and visual performance comparisons.
Included reporting views:
- Campaign type performance
- Search vs Audience campaign comparison
- Conversion trends over time
- Campaign cost analysis
- Cost per conversion tracking
- Ad group performance breakdowns
Dedicated Search Campaign pages also allow you to monitor keyword-driven campaigns in more detail.
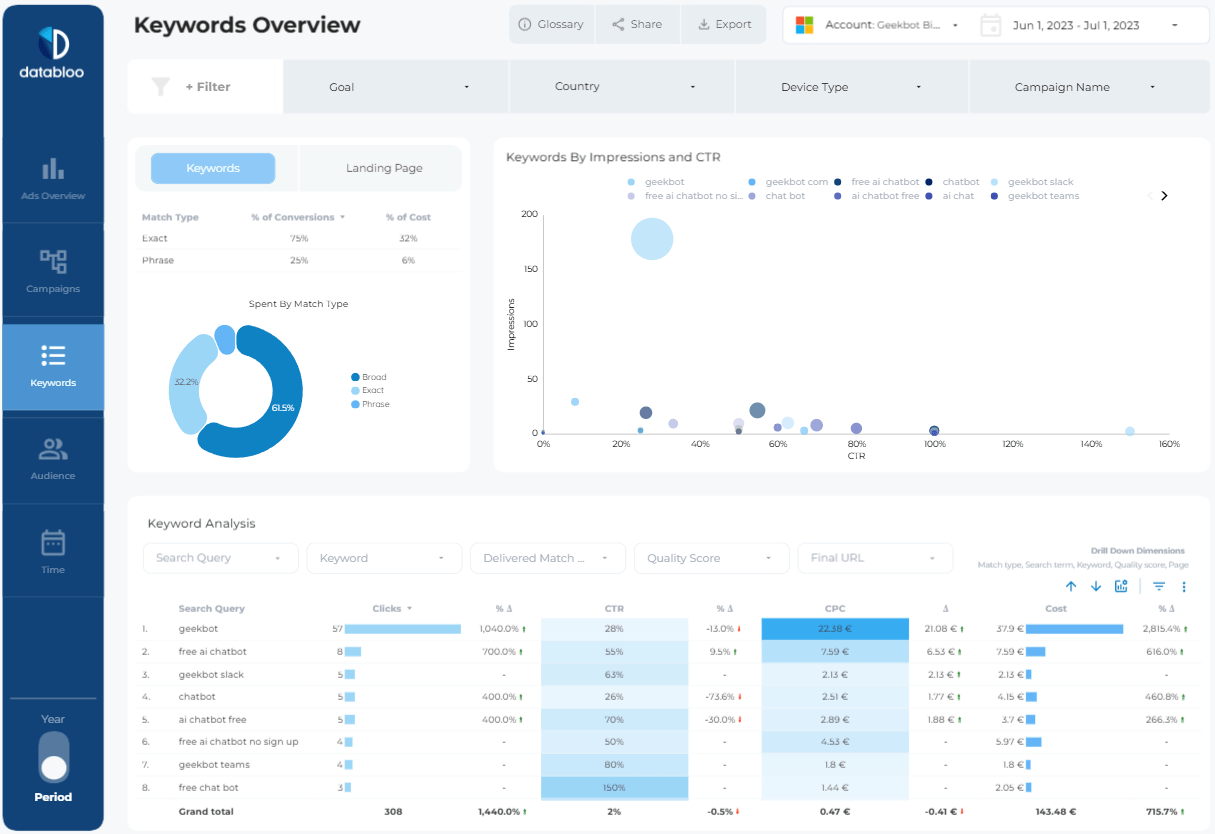
Keyword & Search Query Insights
Understanding keyword performance is critical for improving Microsoft Ads profitability.
The Keywords dashboard helps you identify which search queries drive clicks, conversions, and revenue while highlighting wasted spend opportunities.
Use the report to analyze:
- CTR by keyword
- CPC trends
- Match type performance
- Search query conversions
- Keyword-level spend
- Quality Score breakdowns
Interactive bubble charts and performance tables make it easy to spot high-performing keywords instantly.
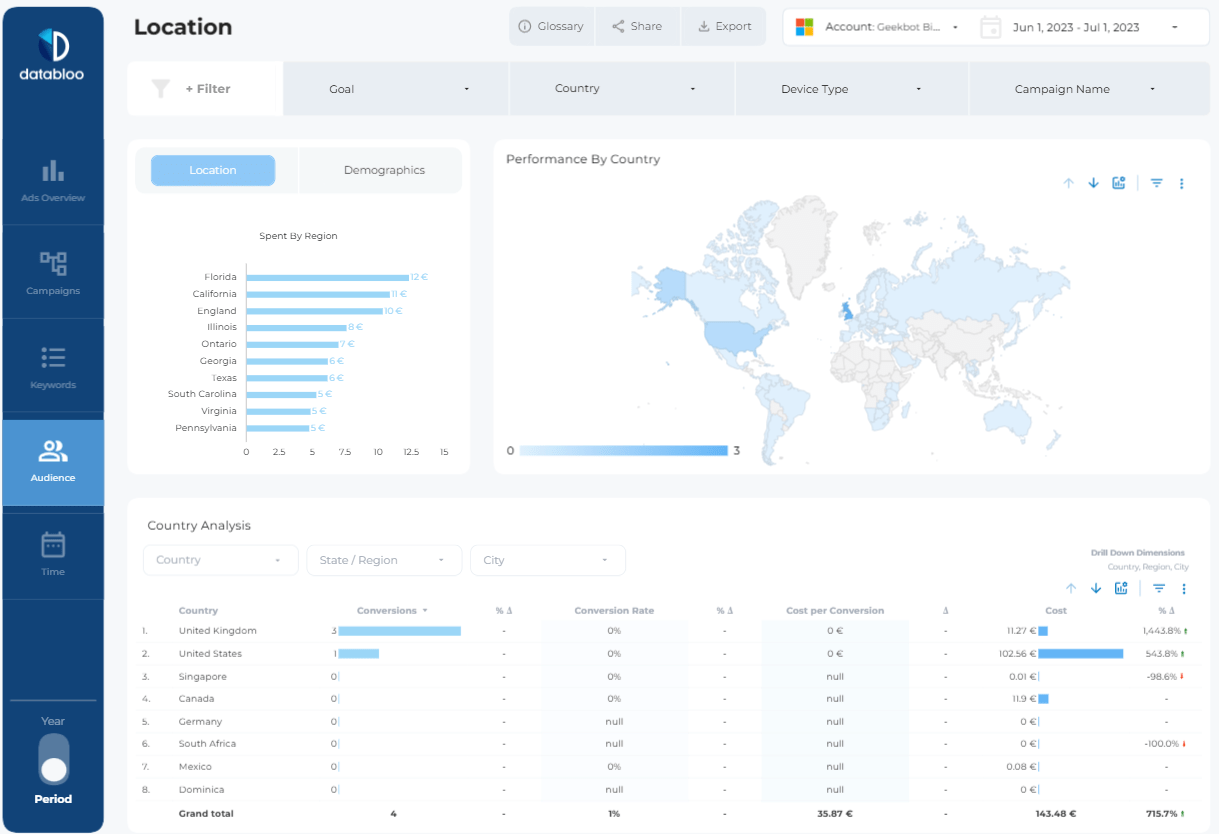
Audience & Location Insights
The Audience and Location dashboards provide a detailed view of where your traffic and conversions come from.
Interactive maps and regional reporting help you discover top-performing countries, states, and cities so you can optimize targeting and budget allocation more effectively.
The report includes:
- Country performance maps
- Regional conversion analysis
- Device type breakdowns
- Audience segmentation
- Geographic cost reporting
- City and state-level analysis
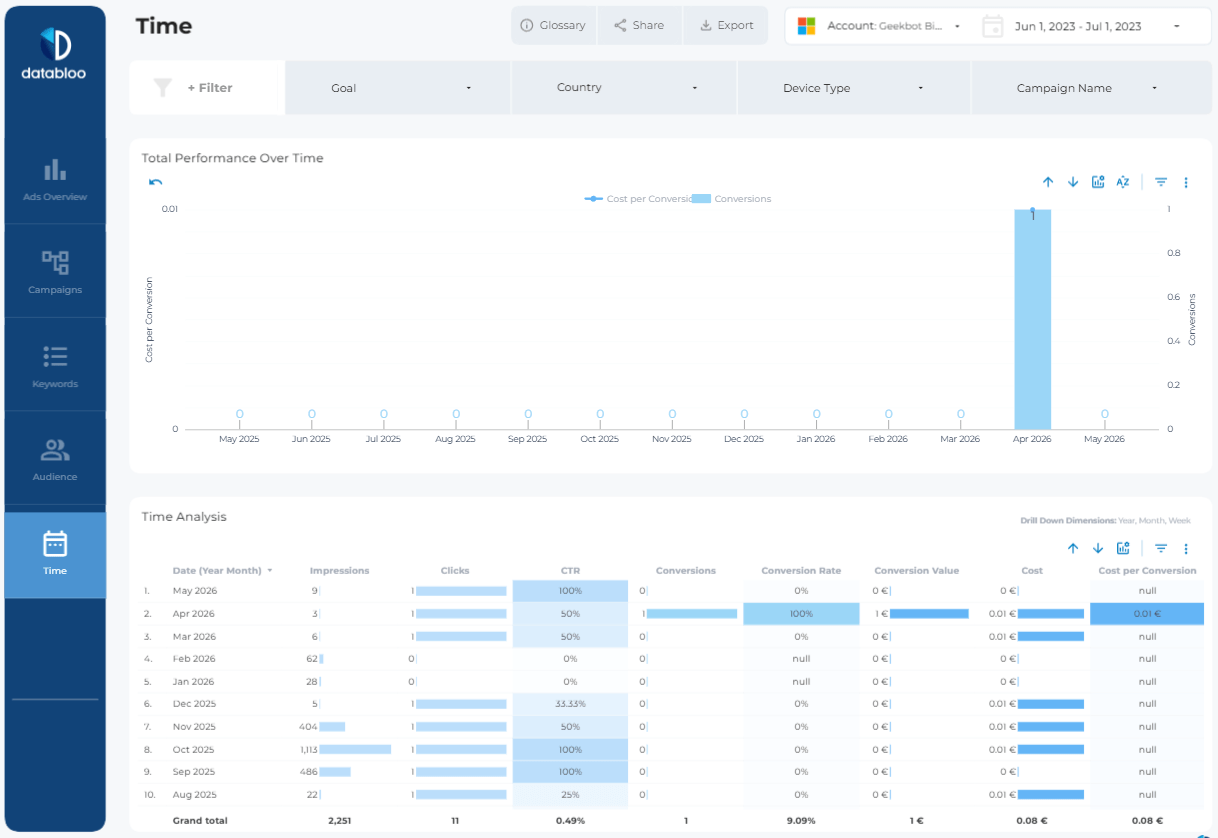
Time-Based Performance Reporting
The Time dashboard helps you monitor long-term trends and performance changes over time.
Track monthly, weekly, and daily performance metrics to better understand seasonality, campaign growth, and conversion behavior.
This section is especially useful for agencies and marketing teams preparing recurring client reports.
Key Features
- Ready-to-use Microsoft Ads Looker Studio template
- Built specifically for Microsoft (Bing) Ads reporting
- Interactive filters and drill-down dimensions
- Campaign, keyword, audience, and location reporting
- Fully customizable branding and visuals
- Instant access after purchase
- Unlimited report copies
- Shareable with teams and clients
One-Click Setup
This template works seamlessly with the Data Bloo Microsoft Ads Connector, allowing you to connect your Microsoft Ads account directly to Looker Studio in minutes.
No spreadsheets. No manual exports. No complex integrations.
Simply connect your account, duplicate the template, and start analyzing your campaign performance instantly.