




Answer These Important Questions
This Instagram Insights template gives you the ability to monitor and analyze the overall performance of your business account and answer the most important questions about your Instagram presence at a glance:
- Am I gaining new followers on a regular basis?
- How many new Instagram followers did I gain this past month?
- What can I do to engage more people?
- What are some trends I can use to improve my presence?
- Are my followers clicking on my website?
- Where do my follower click (website, phone, directions)?
- What type of content does my audience prefer?
- What are my top-performing posts?
- How are my Insta reels performing?
- When is the best time of the week to post reels?
Check Your Entire Instagram Performance
There is an incredible amount of data to analyze regarding your Instagram business account, which can be overwhelming. By breaking this information down into four key sections, Instagram Insights Data Studio Template delivers all of this information in a concise, easy-to-understand format.
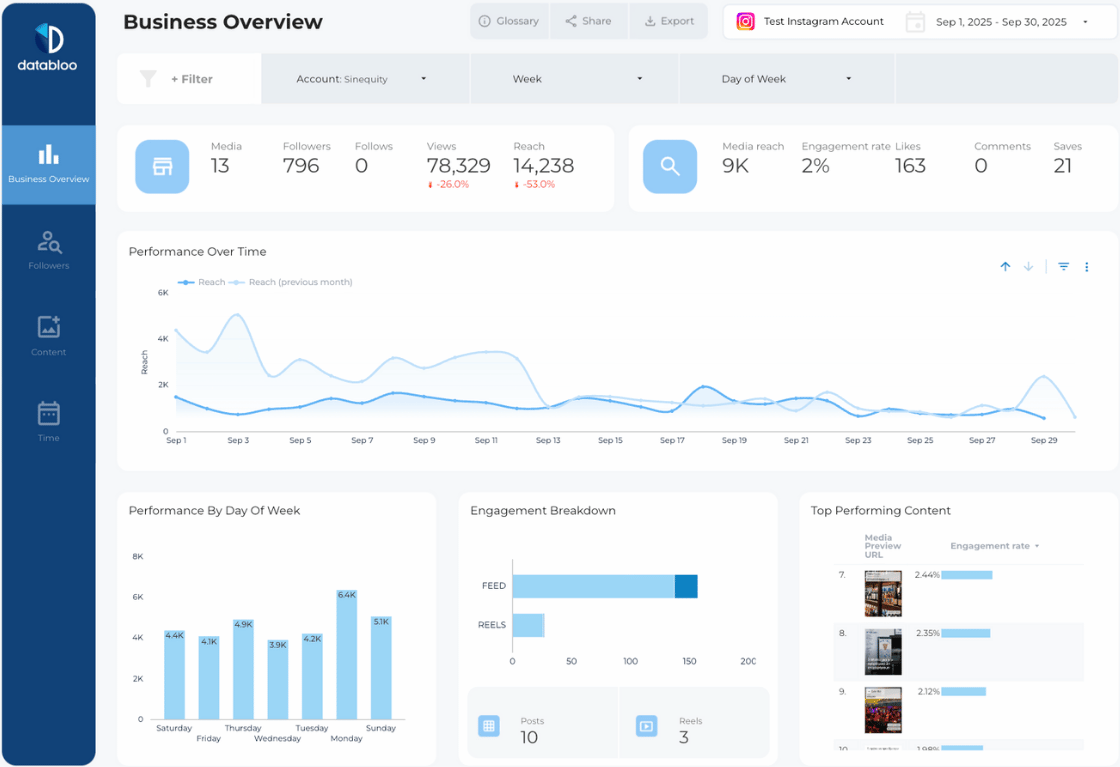
- Overview Section to View Overall Growth: At the top of the Instagram Insights report is the Overview section which displays the overall growth of your Instagram account. Some of the main KPIs included in this section are followers, profile reach, impressions, website clicks, views by day of the week, likes by media type, and top-performing posts.
- Actions Section to Analyze Followers: In the Actions section, key actions made by your Instagram followers are analyzed to provide insight into how much followers interact with your business. Analyzed actions include call clicks, website clicks, map direction clicks, and followers’ actions over time.
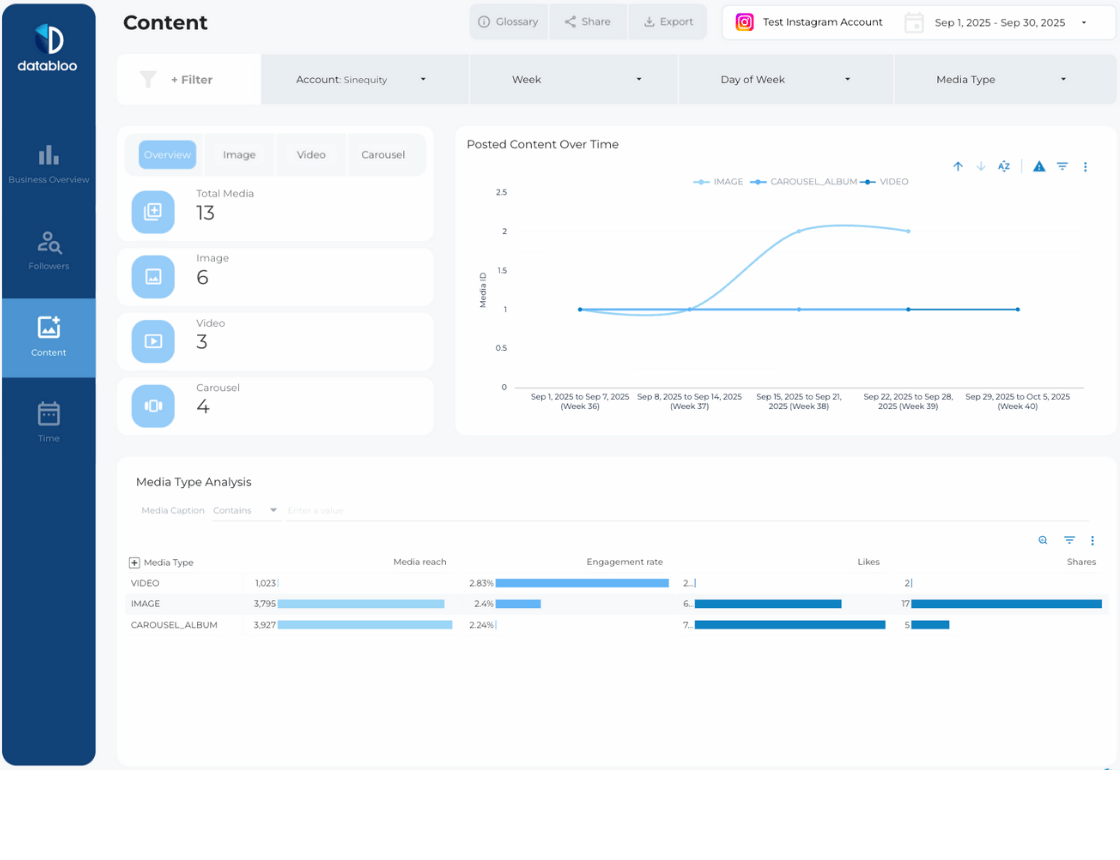
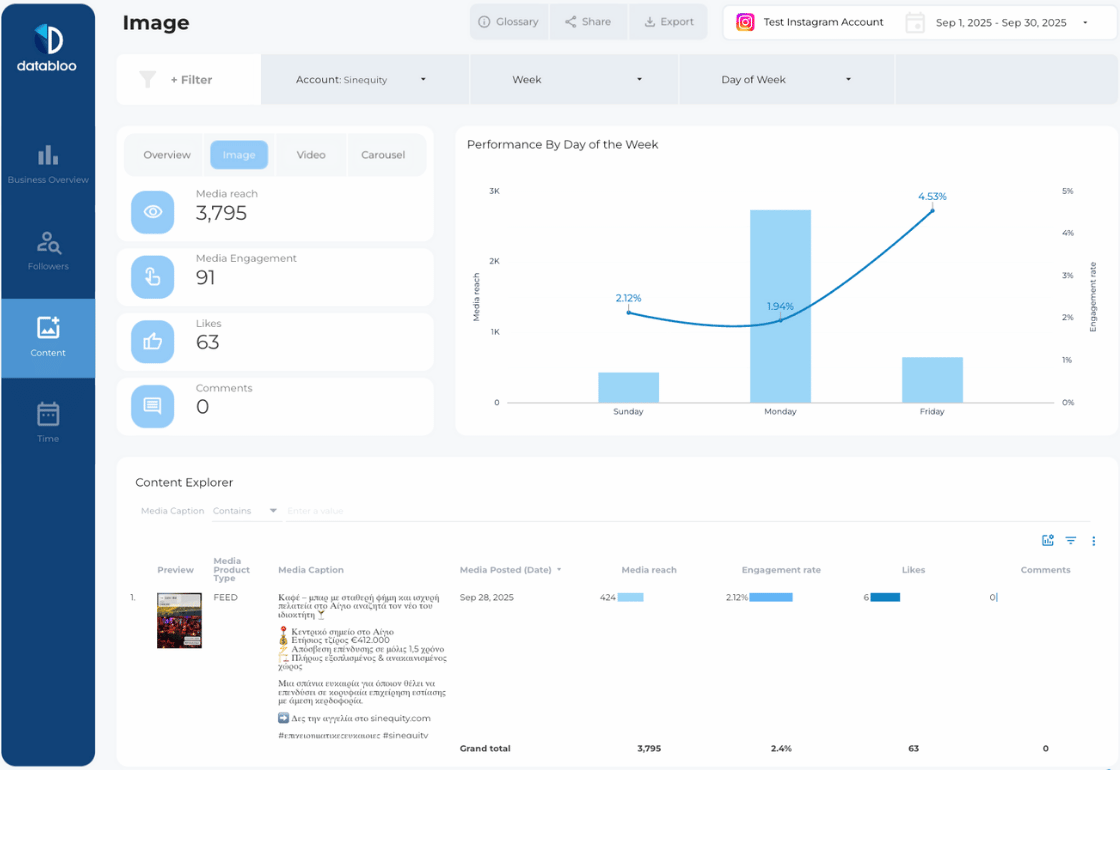
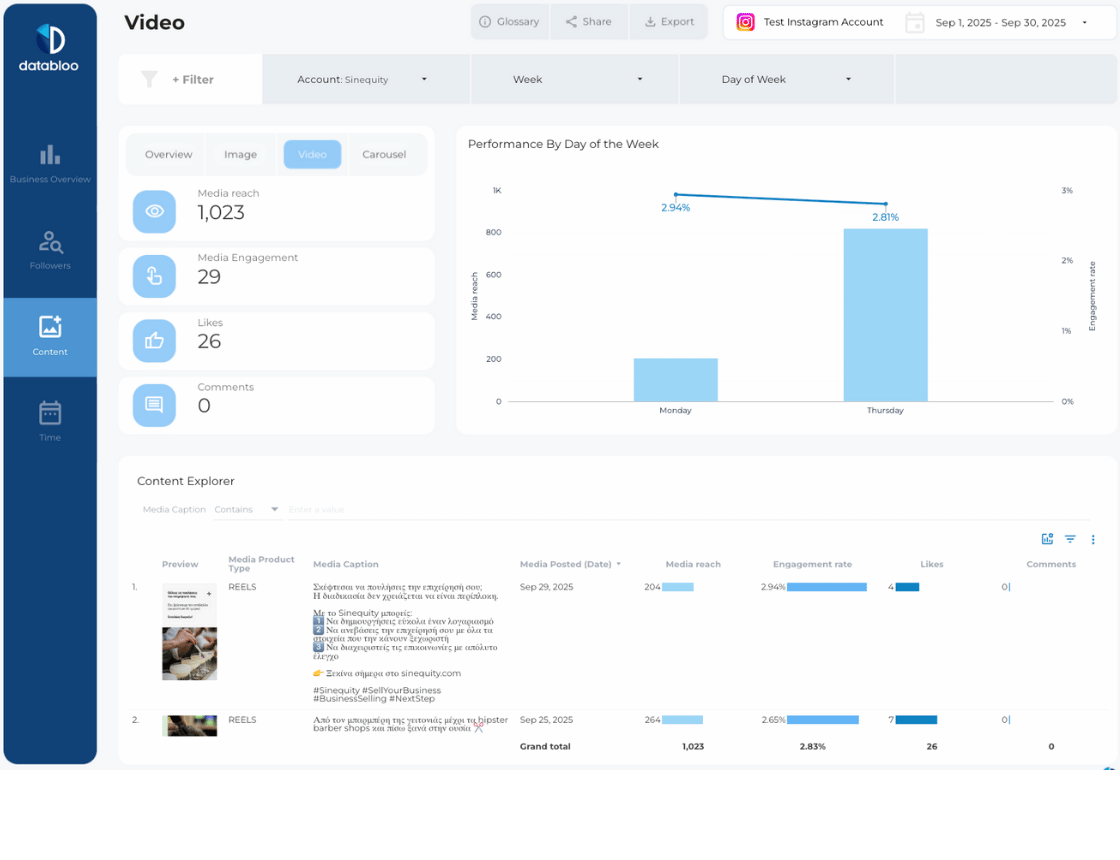
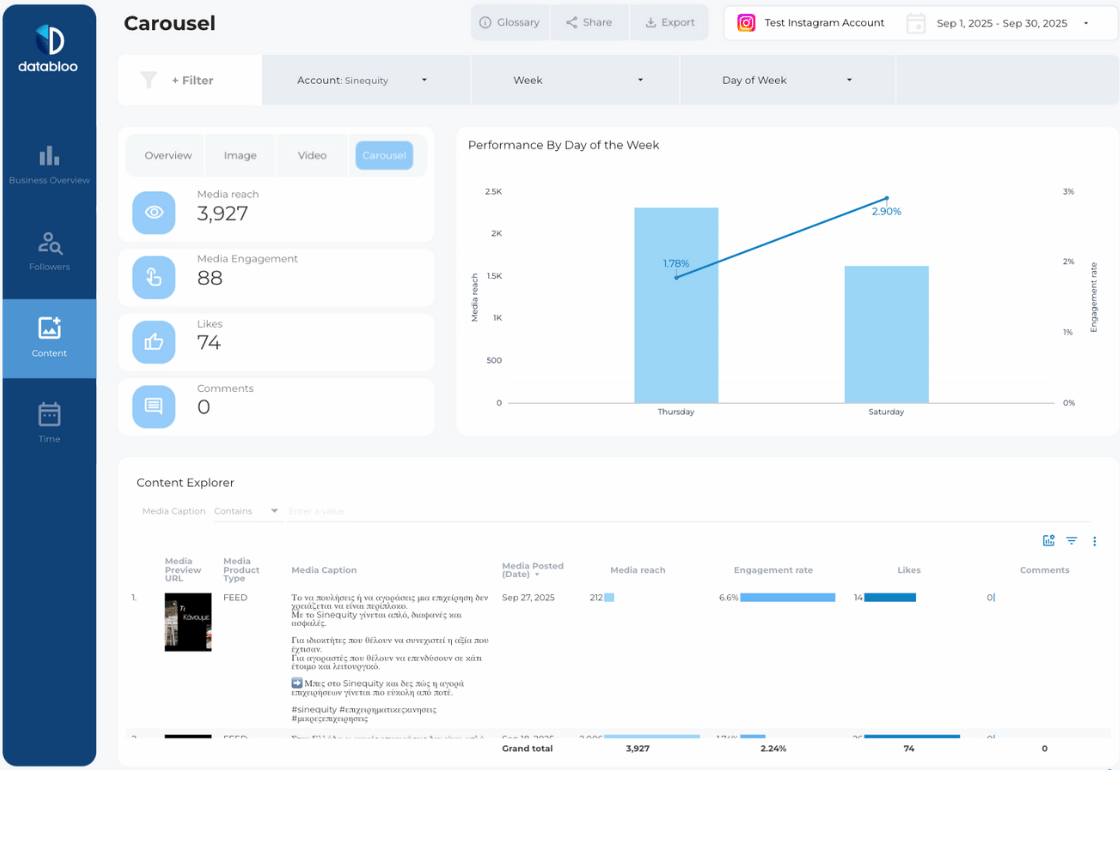
- Posts Section to Understand Content Engagement: To maximize the potential of your Instagram account, you need to understand how your posts, reels and stories are performing. This section shows you engagement such as the number of likes and impressions that your content gets, the performance breakdown by media type (image, video, etc.), and the media engagement of each post. Also there are separate tabs for each media product type (Posts, Reels, Stories), so you can easily drill down and identify the top performing content.
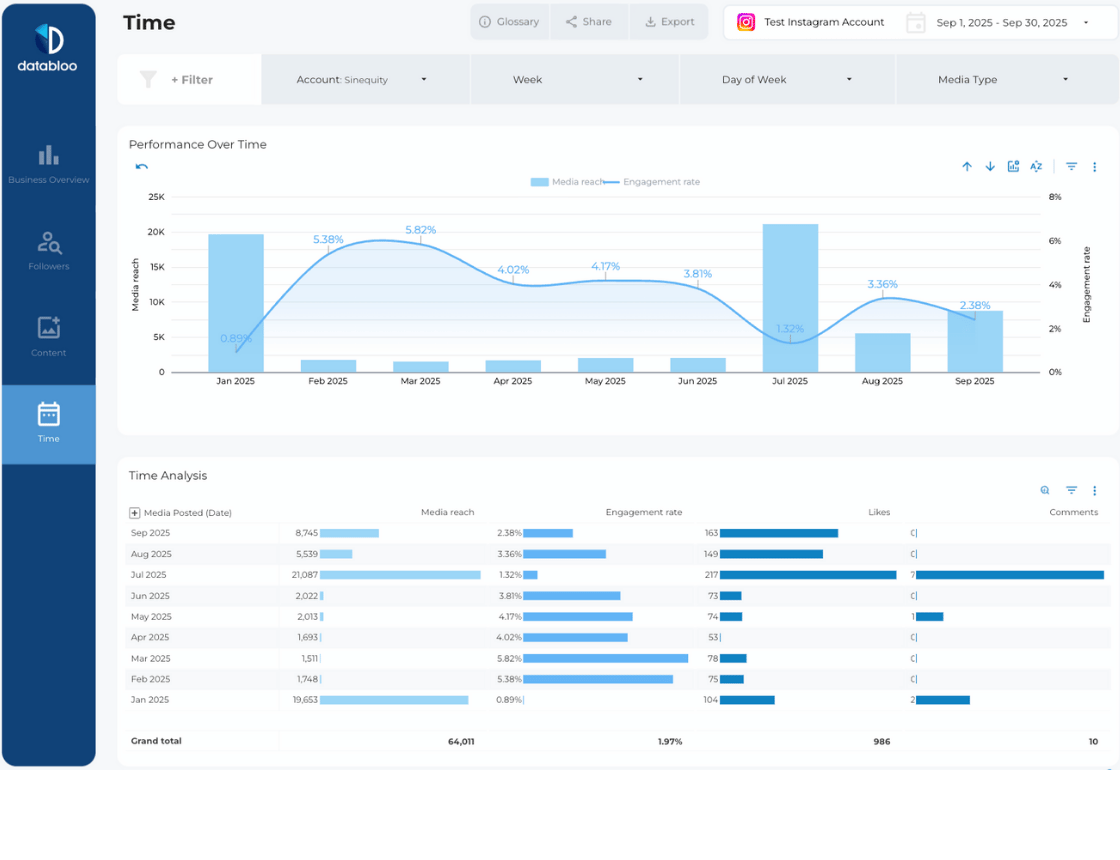
- Time Section to Detail Performance Over Time: The fourth part of the template is a Time section that details your Instagram account’s performance over various time periods. You can view your account’s performance monthly, weekly, and daily. This information helps to identify trends so you can make data-driven decisions to improve your business presence.
Practical Visuals and Charts
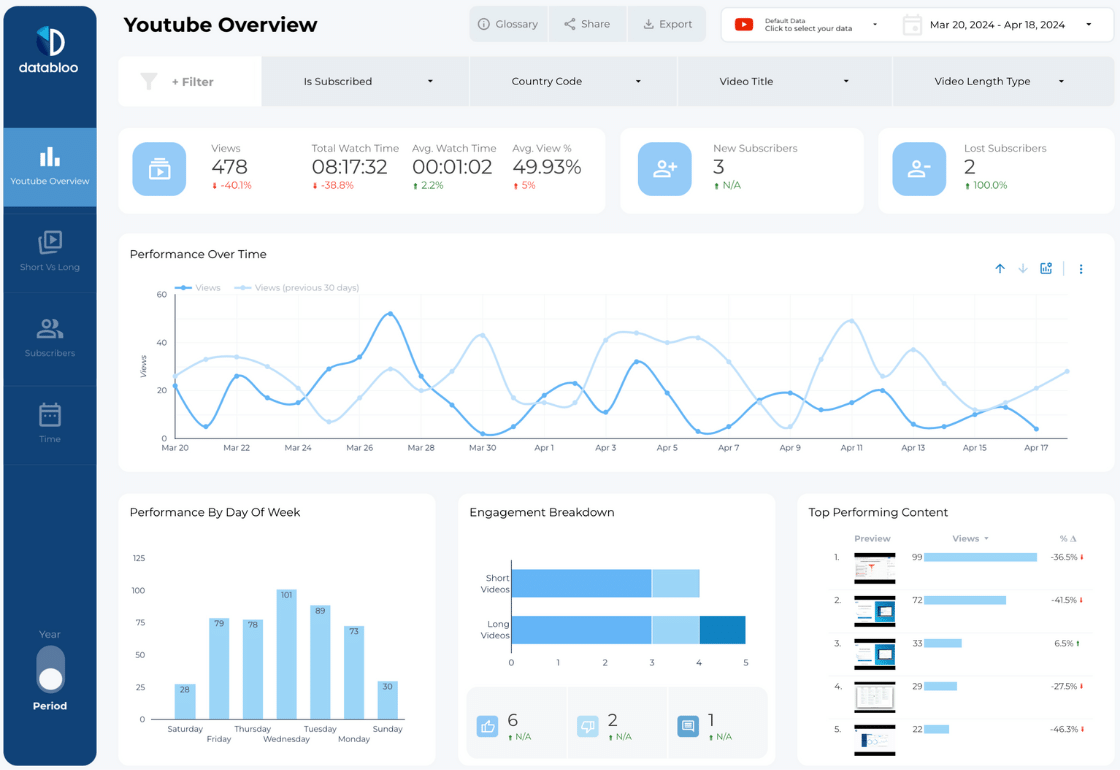
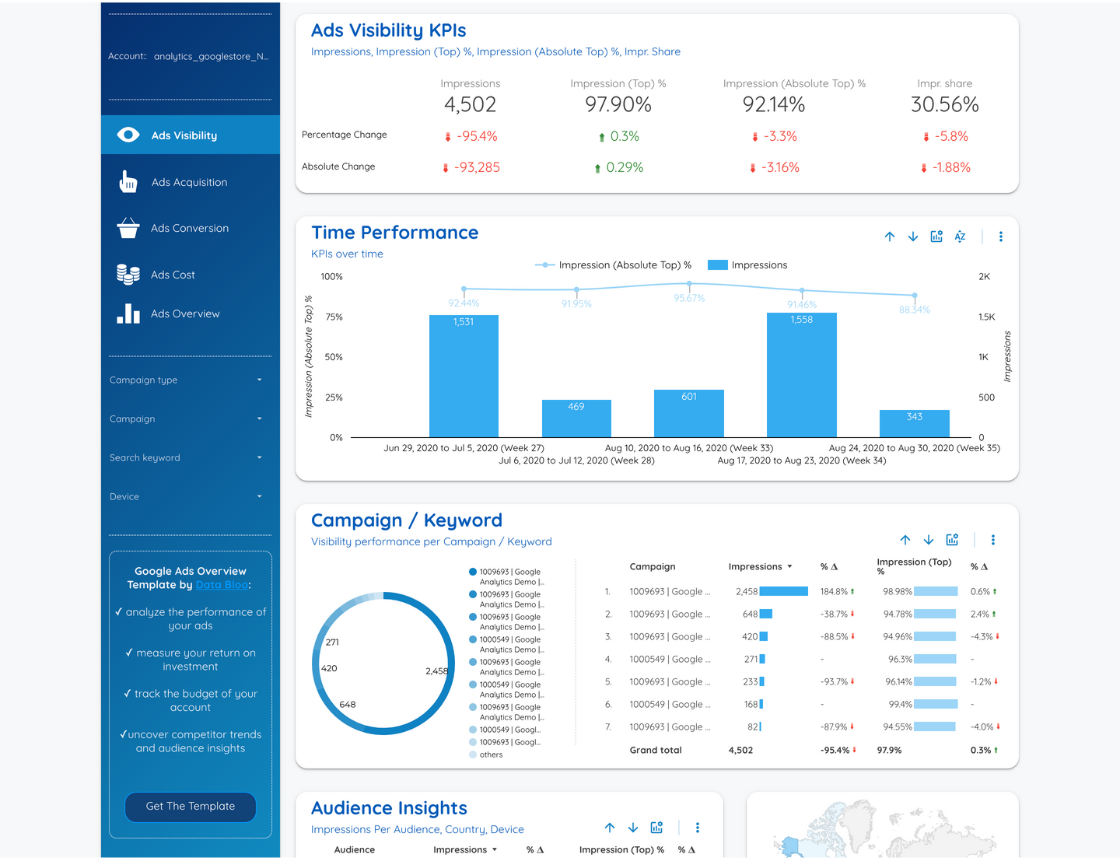
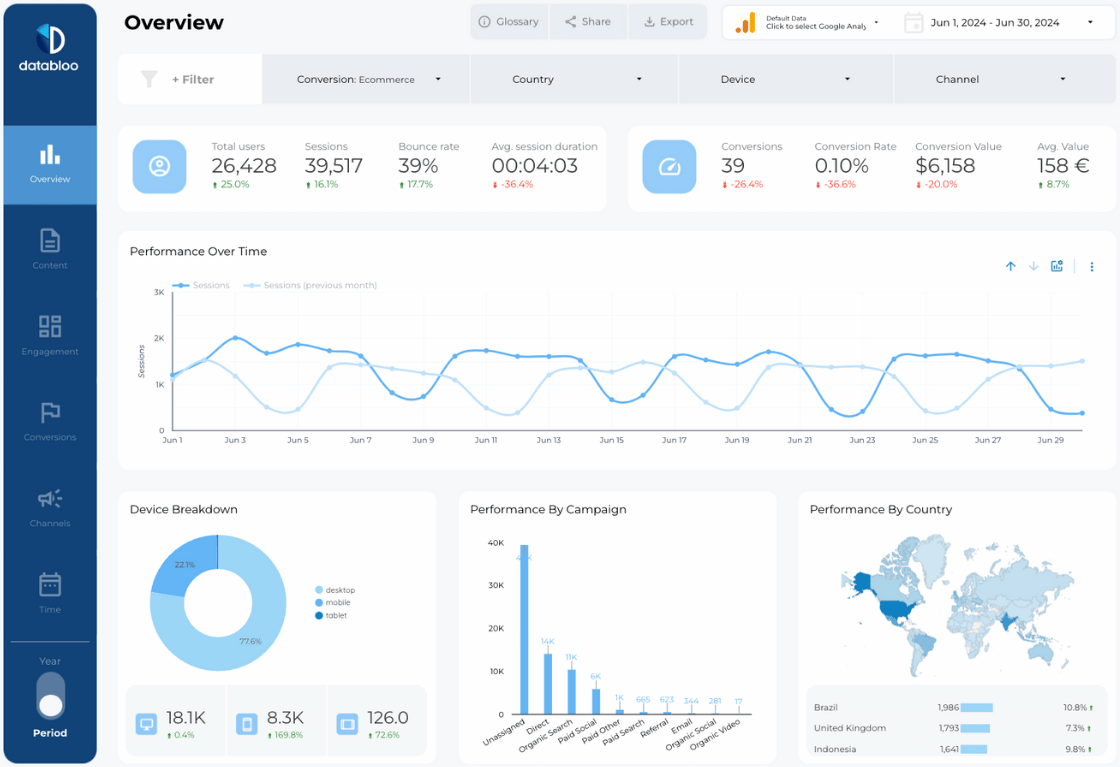
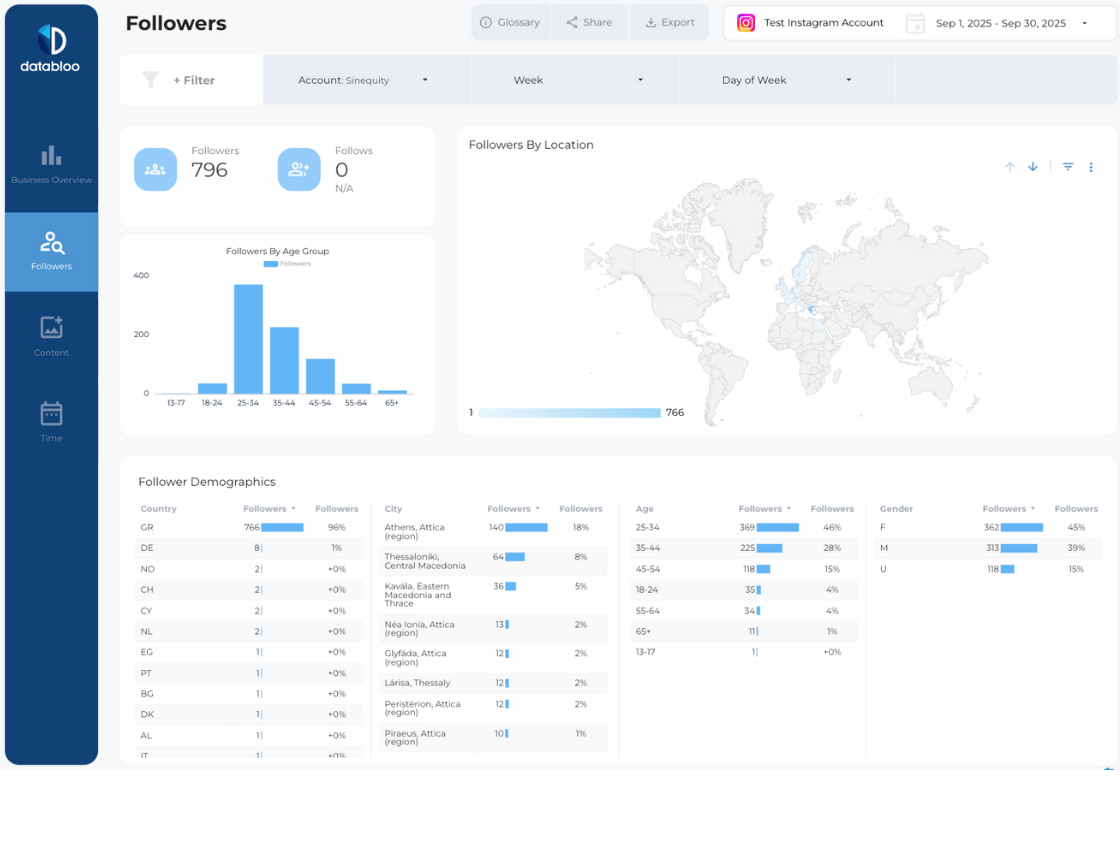
Each section features a range of different charts and visuals to represent your Instagram Insight analytics. There are bar charts, line charts, and pie charts in addition to efficient tables that give you key information in a more detailed view.
Free Connector for Instagram
Setting up the Instagram Insights Data Studio Template is quick, and you don’t need a paid plan to use it. Connect your Instagram account with our Instagram Insights connector for Data Studio, covered by your free Data Bloo account. The free account is $0 forever and includes:
- 1 connected account: use it for your Instagram business account, or for any of our 15+ connectors.
- 300 data refreshes a day, so your report stays up to date.
- 25 AI credits a month for AI reports, summaries and chat answers.
- MCP access, so you can ask Claude or ChatGPT about your data.
- No credit card needed to sign up.
Managing more Instagram accounts or clients? Add more accounts as you grow. See our pricing page.