Table of Contents
A high-converting marketing dashboard is not thrown together at the last minute with some pie charts or graphs added. A dashboard that is effective and not time-consuming is specifically designed and purpose-built to allow you to easily and clearly see what’s working, what’s not, and where to focus your time and budget.
A high converting marketing dashboard is meant to be actionable and powerful. This isn’t something that should scare or overwhelm you. This should be the go-to resource that allows marketers, managers, and professionals to do their jobs better, faster, and more accurately with solid data to back them up.
In this post, we’re going to show you everything you need to know about what should (and should not!) be included on your high converting marketing dashboard. We’ll cover how your dashboard should be structured and what data points are meaningful and actionable to empower you to build the best dashboards possible for your agency or in-house marketing teams.
Understanding the Purpose of a Marketing Dashboard
Before we discuss the 5 components, it’s worth covering what a dashboard really is and its main purpose. A marketing dashboard is essentially a reporting tool.
However, it should offer context, clarity, and direction, not just throw numbers at you. It should allow you to measure real-time performance, identify opportunities, point out inefficiencies, and track your goals.
A dashboard that converts does more than just “reporting on” what’s in front of you. It helps you prioritize actions and spend time and budgets more efficiently for your team. It also makes it easy to show ROI on a given activity to your stakeholders.
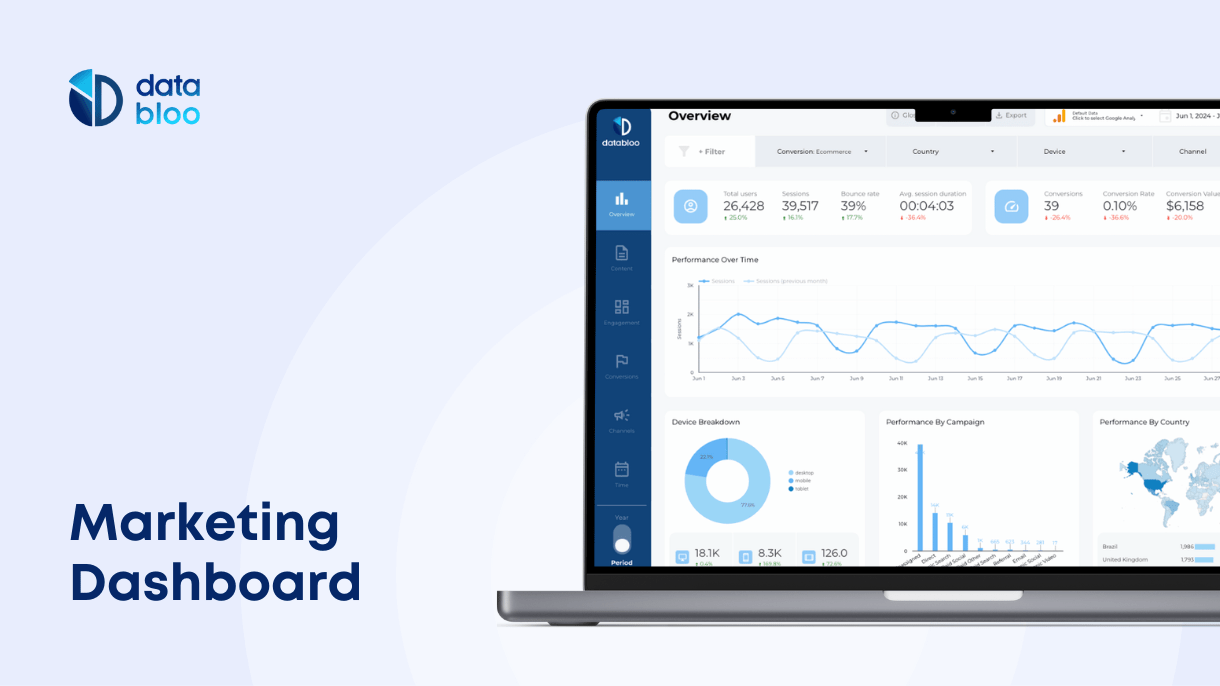
With Data Bloo’s Marketing Dashboard Templates, you don’t have to start from scratch. These pre-built dashboards are designed to highlight the most actionable KPIs, while still giving you the flexibility to customize based on your agency’s goals
Structuring Your Marketing Dashboard for Maximum Value
A cluttered dashboard with unimportant information can be more detrimental than helpful. Consider the hierarchy of your dashboard. What makes the most sense for your objectives and business?
A common way to set this up is starting with top level KPIs and then drilling down into more detailed metrics. It’s a nice balance between having an overview without losing the ability to investigate further.
Another consideration is to break up your dashboards into sections. Think performance overview, campaign reporting, lead funnel, customer behavior, etc.
Key Metrics Every High-Converting Marketing Dashboard Should Include
Not all metrics are created equal. A high-converting dashboard only measures the ones that matter most. Here are the key categories you should include and the metrics that really matter.
Traffic and Source Metrics
As important as it is to understand who your visitors are, you need to know where your traffic is coming from. Along with the total number of sessions and unique users, you’ll want to be tracking new vs returning traffic.
More importantly, you need to know what proportion of traffic is coming from different sources such as organic, paid, referral, email, and social media. Understanding which channels are driving high-quality traffic will help you maximize your spend and efforts.
Keep an eye on trends over time and drill into the details if there is an unusual spike or sudden drop in a certain type of traffic. Is your SEO effort giving you a return? Did a new campaign cause a spike in direct traffic?
These are the kinds of questions you need to be able to answer in order to focus on what’s working.
Conversion Metrics
This is the fun part. Conversions are the lifeblood of any marketing program, so you need crystal-clear visibility here.
Track your overall conversion rate, but don’t stop there. What about your conversion rate by channel, device, or landing page?
Micro and macro conversions are important. Macro conversions are big things like a completed purchase or lead form submission. A micro conversion is something like a brochure download or newsletter signup.
Cost and ROI Metrics
All marketers are inevitably faced with one question: “are we making any money on this?” Cost-per-click (CPC), cost-per-lead (CPL), and cost-per-acquisition (CPA) should all be displayed on your dashboard and are best broken down by channel to show where the best bang for buck is.
Display your return on ad spend (ROAS) as well as the total ROI for marketing. This makes it easy to justify budgets and prove the worth of your campaigns.
Engagement and Behaviour Metrics
All the traffic in the world doesn’t mean a thing if your audience isn’t engaging with your site. That’s where behavior metrics come in. Track your bounce rate, average session duration, and pages per session to get an idea of how people are interacting with your website.
Heatmaps and user flow reports are also useful tools for understanding engagement on a more visual level. If people are abandoning your funnel at certain stages or completely missing your CTAs, you’ll see it right here.
Funnel Performance
Draw it out, literally. Get a big piece of paper and draw your marketing funnel. From awareness to consideration to conversion, map out each stage of your funnel and include supporting data.
Track the drop-off rate between stages, look for any bottlenecks. If you’re focusing on lead generation, track how many leads you receive, how many are qualified, and how many convert to customers. If you’re in e-commerce, track how many users view a product, add it to their cart, and go through checkout.
This will help you zero in on exactly where your prospects are falling off and arm you with the data you need to fix it.
Campaign Performance
Your dashboard should also allow you to measure the success of individual campaigns. Take a look at your impressions, clicks, click-through rate (CTR), and conversions for each individual campaign.
Keep an eye on your top-performing assets and creatives. Figure out what kind of messaging and content is working and apply those learnings to replicate across your other campaigns.
Customization and Real-Time Updates
Customization is one of the best features of a modern marketing dashboard. The ability to view real-time or near real-time data is crucial to fast-moving campaigns or rapidly evolving crisis situations.
You should also be able to slice and dice your data by date range, traffic source, campaign, device, location, and other useful dimensions. This allows you to get quick answers to your questions without having to go through IT or data analysts each time you have a new question.
Try now Data Bloo’s Custom Master Template to combine sources like Google Ads, Facebook Ads, and GA4 into one tailored dashboard that matches your KPIs and reporting style.
Designing for Clarity and Actionability
Good design is important because a dashboard can be too cluttered. Charts, graphs, and visuals should help make the data easier to understand.
Important numbers can be highlighted with color-coding or bold text. Layouts should be clean, consistent, and easy to navigate.
Display data with context, visualize performance against goals or benchmarks, and add short explanations or insights next to metrics. The goal is for users to not only see the data, but also understand what to do with it.
How Often Should You Check Your Dashboard?
Frequency of dashboard reviews will depend on your role and business needs. A PPC manager may need to view their dashboard multiple times a day. On the other hand, an executive may only need a weekly or monthly summary.
Because of this, it can be helpful to create more than one view or version of your dashboard. For example, one for in-depth analysis and another for a quick daily or weekly check-in.
Scheduling the time to review your dashboard will help with discipline. For example, if you have weekly marketing standups where you run through the dashboard, you’re always making data-informed decisions.
Creating a Culture of Data-Driven Marketing
The dashboard is only as good as the humans utilizing it. It can’t possibly live up to its full potential to drive conversions on its own. It’s part of a bigger, company-wide effort to become more data-driven.
That means motivating staff to reference the dashboard on a regular basis, updating the dashboard with new goals and KPIs, and sharing successes that have been the result of intelligent data-informed decisions.
Motivate your team to ask better questions and use the dashboard with a sense of discovery and exploration. The more they use it, the more answers they’ll find!
FAQs
What is the most important KPI in a marketing dashboard?
It depends on your goals and context, but common crucial metrics include your conversion rate, your ROI and your cost-per-acquisition. These are some of the metrics that tell you if your efforts are paying off.
Can I build a marketing dashboard without coding knowledge?
Yes. There are many tools like Google Data Studio, Klipfolio, Databox, and AgencyAnalytics that offer simple drag and drop interfaces to create powerful dashboards without any coding needed.
How do I avoid dashboard overload?
Prioritize the KPIs that align directly with your objectives and eliminate vanity metrics. Keep the visual design simple and structured.
Should I have different dashboards for different teams?
Yes. Personalize dashboards for individual teams or job functions to increase engagement and efficiency. Executives want top level KPIs whereas analysts and managers need drillable detail.
How often should I update the data in my dashboard?
Daily or real time for fast paced campaigns and metrics. Weekly or monthly updates are fine for summary reports. The most important thing is that the data is current enough to be actionable.
What tools work best for building marketing dashboards?
Google Looker Studio, Tableau, Power BI are common tools, as well as agency specific platforms like DashThis or AgencyAnalytics. Choosing the best one for your agency depends on your current tech stack and budget.