Table of Contents
Facebook ads are not a “set it and forget it” marketing campaign. If you want to see actual results, you will need to closely monitor, make data-driven decisions, and be willing to test new tactics based on the numbers.
Facebook ads reporting is underutilized, meaning that if you learn how to take advantage of the tool, you will have an edge on your ad performance. If you are a small business owner running your own ads or if you are an advertiser who runs campaigns for your clients, Facebook ads reporting is an excellent place to start learning how to interpret ad data.
What is Facebook Ads Reporting?
Facebook ads reporting is the capability in Meta’s ads manager platform that helps you track, assess, and visualize how your ad campaigns perform. There’s no more having to rely on your gut instinct as to how well your ads are doing. Instead, you’ll have actual statistics regarding how many people have seen your ad, clicked it, bought something, or taken a particular action after seeing the ad.
The best part? The reports are completely customizable. You can customize your report to only display the key performance indicators (KPIs) most relevant to your particular business objectives.
Setting Up Your Facebook Ads Reports
Facebook ads reporting can be much simpler than you think and you can start it right from your ads manager. You’ll be able to find some options for reporting there such as “Customize Columns” or “Reports.” You can customize your reporting and select the metrics you’re most interested in monitoring for your campaign goals.
Before you start to customize, think about your goals. If you’re trying to drive sales, you will need to monitor the cost per purchase, ROAS, and conversion rate. If you’re trying to increase engagement, link clicks, likes, comments, and shares will be key.
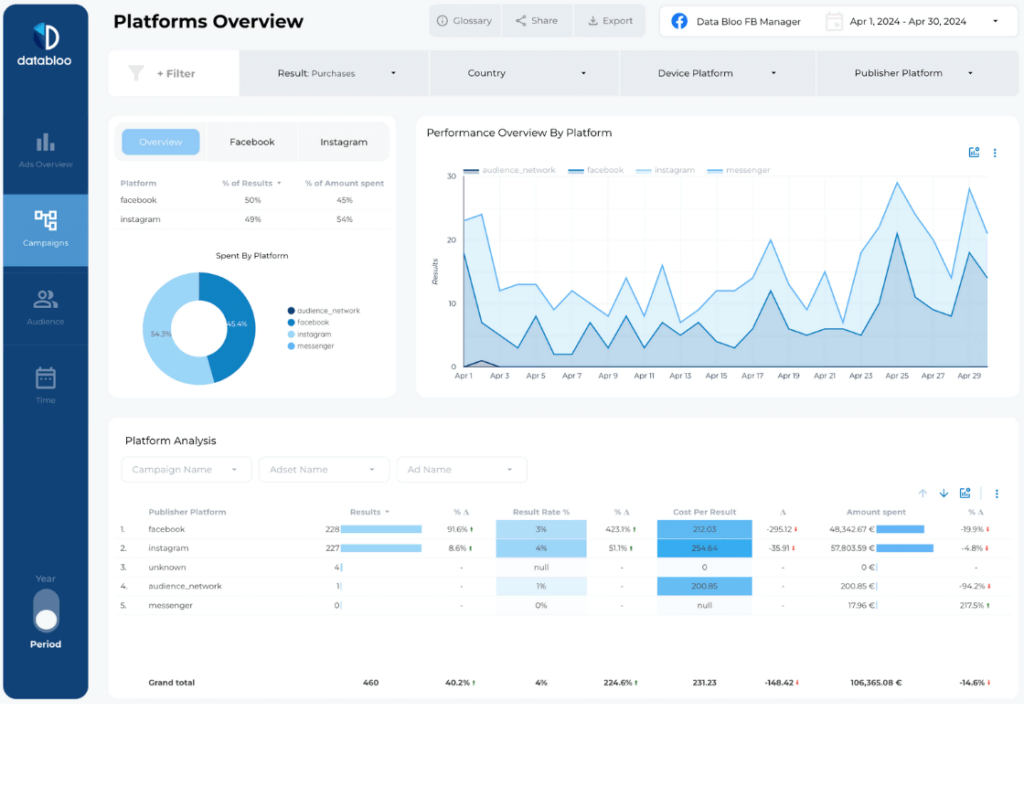
Keep your KPIs in mind as you begin to customize your report, allowing you to stay on-target with what’s important for your campaign. In addition to metrics, you can customize your reports by segmenting out your reporting on dimensions such as age, gender, device, placement, and even geographic location.
Wondering how a campaign performed on Instagram stories or how it did in a particular city? Filters let you narrow down exactly what you want by isolating slices of your data to drill into key performance factors.
Breakdowns are similar to filters, but rather than narrowing your scope because they let you look at different results side-by-side. You can quickly compare performance between mobile and desktop, AM vs. PM, and different audience breakdowns. This type of analysis can be used to identify trends and opportunities that might otherwise be hidden.
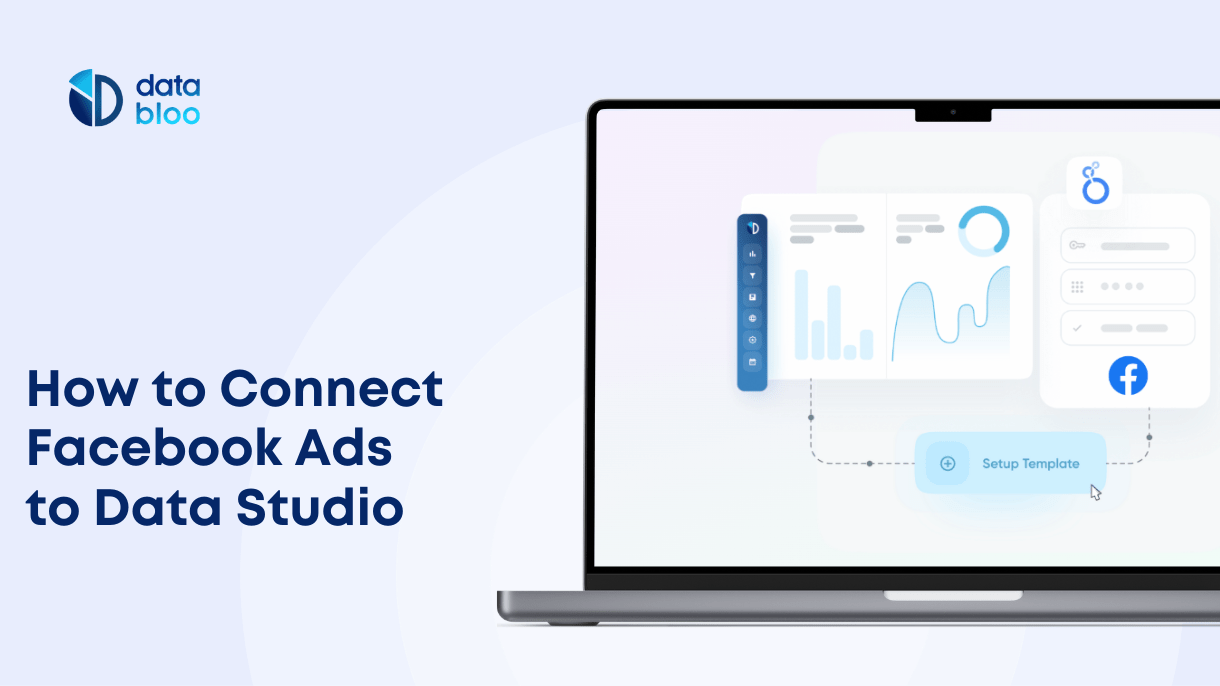
Instead of building custom reports from scratch, you can speed things up with Data Bloo’s Facebook Ads Looker Studio Template. It comes preloaded with key KPIs like CPC, ROAS, conversions, and engagement — so you just connect your account and start analyzing right away.
Key Metrics to Track in Facebook Ads Reporting
Engagement Metrics
These include likes, shares, comments, and click-through rate (CTR). Strong engagement usually signals that your ad content is connecting with your audience. If your CTR is lower than expected, it could mean your visuals or copy need tweaking.
Conversion Metrics
Conversions are where your return on ad spend starts to come into focus. Whether that’s a sale, sign-up, or app download, this is where you track the outcomes that matter most. Keep an eye on cost per conversion, overall conversion rate, and ROAS to understand whether your investment is paying off.
Reach and Frequency
Reach indicates the number of unique individuals who have been exposed to your ad. Frequency represents the average number of times each person has seen your ad.
As frequency increases, if you notice a decrease in engagement or conversions, this may indicate audience fatigue. This is when you want to refresh your creativity or expand your audience.
CPC and CPM
Cost per click (CPC) reveals the cost of each click. Cost per thousand (CPM) reveals the cost of having your ad shown to 1,000 people. High CPCs and low conversion may mean that you need to adjust your targeting and/or landing page experience.
How to Use Facebook Ads Reporting to Improve Campaigns
Reporting tools aren’t just for taking in information, but for acting on it. It’s important to analyze your reports and use them as a guide to optimizing your campaign and testing your next steps.
First, find the top-performing ads in your campaigns. If you have a clear frontrunner in terms of performance, there’s no harm in reusing a winning approach on more ads.
Clone the ad and experiment with small tweaks to see if you can squeeze even more performance from that ad concept. Something as simple as a new call-to-action or different image might be enough to make a small, but significant difference.
Spotting the losers and nipping those campaigns in the bud is just as important as capitalizing on the top performers. You can cut your losses by pausing a campaign with a low click-through rate or weak conversion performance before it eats further into your budget. Use the reports to work out why that ad isn’t working and adjust your strategy accordingly to test and learn.
Reporting is also a good way to understand where your most responsive audiences are located. If you’re finding most conversions are coming from mobile users aged 25–34, there might be value in moving more of your ad spend to that audience. On the other hand, if you’ve been targeting users by demographics and location, you might want to remove underperforming demographics and focus on specific locations if the reporting shows they perform better.
Timing is another factor you can leverage with the help of your reports. Let’s say your analytics indicate that your target audience is most active from 6PM to 10PM, you can make sure that your ads run during those hours.
Using A/B Testing and Reporting
One of the best strategies for optimizing Facebook ads is making decisions based on data through A/B testing. The process of A/B testing is when you run two versions of an ad at the same time. This then tests which performs better with your target audience and which ad elements they engage with most.
After you have run your A/B test, the next stage is analysis. The results you are looking for do not have to be which ad got the most clicks. For example, you could base the results off asking which ad had the most conversions, which had the lowest cost per result, or which ad may have had the most engagement.
Improving Reporting Over Time
Create Saved Reports for Faster Decision-Making
When you find yourself checking the same metrics every week, it makes sense to create saved reports. You can even make different versions based on campaign goals like one for lead generation and another for sales. This is so you don’t waste time hunting for the data you need.
With Data Bloo, you don’t even need to manually save or rebuild reports. Our free Facebook Ads Connector keeps your dashboards automatically refreshed with the latest data, so you’re always working with up-to-date numbers.
Use Data Visualization to Spot Trends
Numbers are essential, but sometimes graphs and charts make patterns easier to see. Facebook ads reporting allows you to turn your data into visuals, so you can spot trends over time and make comparisons at a glance.
Combine Facebook Data with Google Analytics
To get a full picture of what happens after someone clicks your ad, consider pairing your Facebook data with Google Analytics. This helps you see not just who clicked, but what they did once they landed on your site.
Troubleshooting Common Reporting Issues
Inaccurate Data Due to Attribution Settings
Facebook’s attribution settings determine how conversions are credited. If your settings don’t align with your sales cycle, your data may be misleading. Make sure your attribution window (like 7-day click or 1-day view) reflects how your customers typically make buying decisions.
Delayed Reporting
Sometimes the data just isn’t fully updated right away. System delays or changes in privacy settings (like Apple’s iOS updates) can slow things down. For the most accurate view, wait 24–72 hours before drawing conclusions from recent activity.
Discrepancies Between Platforms
If Facebook’s numbers don’t match what you see in your e-commerce platform or CRM, that’s not unusual. The platforms measure different things in different ways. Use both to paint a more complete picture, and don’t stress over exact matches.
How to Report Results to Clients or Stakeholders
Tell a Story with the Data
Don’t just paste charts and data into a PowerPoint. Tell the story behind the numbers and relate the results to the objectives of the campaign. Draw out the main conclusions, point to the places where you succeeded, and identify how to do better next time.
Provide Context
A campaign can sometimes look poor on paper, but not necessarily be unsuccessful. It could be generating awareness or long-term customers. Always put the numbers in context of the larger picture.
Include Visual Aids and Comparisons
Comparing week-over-week or month-over-month performance with visual charts can help clients and stakeholders understand progress. Most of the time, they’re not ad experts, they just want to know if things are moving in the right direction.
FAQs
What is the difference between an ads manager and Facebook Ads Reporting?
Ads Manager is the place you create and manage your campaigns. Facebook Ads Reporting is a tool in Ads Manager that allows you to create customized reports to track how your campaigns are performing.
How often should I be reviewing my Facebook ads reports?
Daily is the best, especially if you are running high-budget or high-volume campaigns. But if you have well-established campaigns, once a week is enough. You will start to see trends and will know when to make smart changes.
Can I export my Facebook ads reports?
Yes, you can download your Facebook ads reports in Excel or CSV format. You can even schedule regular email attachments for your team or clients.
What is a good ROAS on Facebook ads?
It’s dependent on your business, but for a general ROAS goal, you would want a 2.0 or greater ROAS to be at a minimum, generating at least a 2-to-1 return on advertising spend. Keep in mind your product price point, industry standards, and average customer lifetime value, too!
Why don’t my Facebook numbers match up with my Google Analytics numbers?
Facebook has a different tracking algorithm that they use. For example, a Facebook conversion may credit a click that happened a few days ago, while Google is more strict with last click. The two together will give you a more accurate picture of what is actually working.