Table of Contents
Facebook Ads Manager is a great tool for running campaigns. It’s a terrible tool for reporting on them.
The native interface is cluttered, hard to share with clients, and gives you no way to combine Facebook data with Google Ads, GA4, or Search Console in one place. If you’re spending time every week exporting CSVs, reformatting tables, and building the same slides from scratch – you already know the problem.
Connecting Facebook Ads to Data Studio solves all of it. Your data flows in automatically. Reports update on their own. And instead of a spreadsheet that’s stale the moment you send it, your clients get a live dashboard they can actually use.
In this guide, we’ll walk you through exactly how to do it – step by step – and show you what a solid Facebook Ads report looks like once it’s set up.
What You Need Before You Start
Before connecting anything, make sure you have the following in place:
A Data Studio account. It’s free with any Google account. Visit datastudio.google.com and sign in with your Google credentials.
The right Facebook Ads permissions. You need at least an Analyst role on the ad accounts you want to report on. Admin and Advertiser roles also work. To check your role, go to Facebook Ads Manager → Settings → Ad account roles.
A third-party connector. Data Studio doesn’t have a native Facebook Ads connector – that’s not a bug, it’s just how it works. You need a connector to bridge the two. More on this below.
Does Data Studio Have a Native Facebook Ads Connector?
No. Data Studio connects natively to Google products – Google Ads, GA4, Search Console, YouTube, and a few others. Facebook Ads is a Meta product, so you need a third-party connector to bring that data in.
The good news: it takes about five minutes to set up, and once it’s done, it runs itself.
How to Connect Facebook Ads to Data Studio Using Data Bloo
Data Bloo’s Facebook Ads connector is one of the most straightforward ways to get your Meta data into Data Studio. No CSV exports, no API setup, no code. Just connect your account and your data starts flowing.
There are two ways to do it: through the Data Bloo Hub, or directly from Data Studio. Both take about five minutes.
Option A: Connect via the Data Bloo Hub (Recommended)
The Hub gives you a central place to manage all your connectors and data sources in one spot.
Step 1: Sign in to Data Bloo
Visit hub.databloo.com and sign in using Google or your email and password.
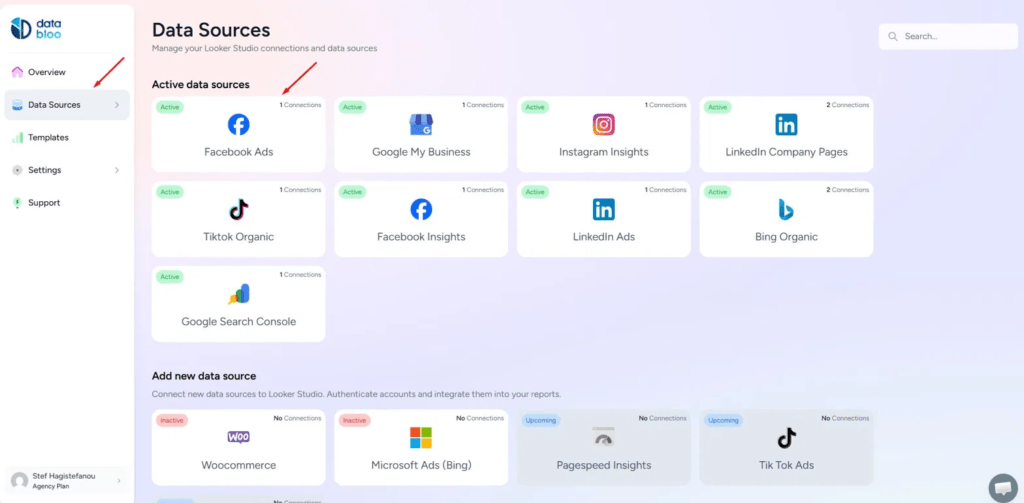
Step 2: Navigate to Facebook Ads Data Source
After logging in, go to Data Sources from the left menu. You’ll see all your active connections and an “Add new data source” section below. Click on the Facebook Ads tile.
Step 3: Connect Your Facebook Ads Account
You’ll be prompted to authorize your Facebook account. Log in with the account that has access to the ad accounts you want to report on.
Important: If you manage multiple clients, select access to all relevant Business Manager accounts at this stage. It saves you from re-authorizing later.
Step 4: Select Your Ad Accounts
Choose the ad account (or accounts) you want to include. Once connected, you’ll see each account listed with its name and External ID. If you need to add more accounts later, use the + Add Account button.
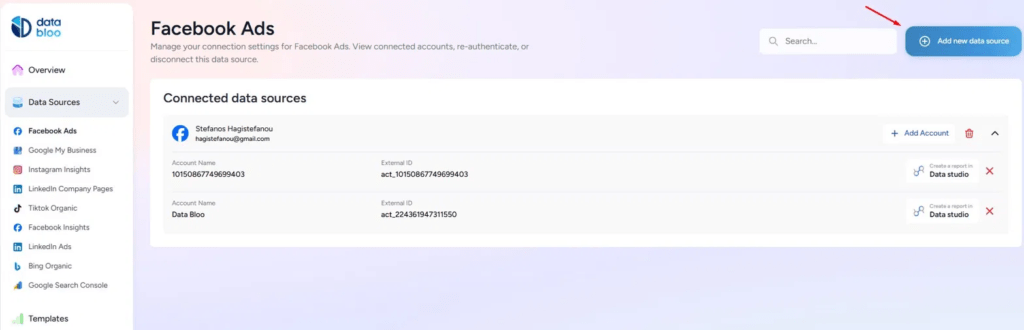
Step 5: Create Your Report in Data Studio
Next to each connected account, you’ll see a “Create a report in Data Studio” link. Click it and Data Studio opens with your Facebook Ads data source already connected. From here, you can build from scratch or use a pre-built template.
Option B: Connect Directly from Data Studio
Prefer to stay inside Data Studio? You can add the Data Bloo connector from there too.
Step 1: In Data Studio, click Create → Report and then Add data.
Step 2: Search for “data bloo” in the connector search bar. You’ll see all Data Bloo partner connectors appear. Select Facebook Ads – Free.
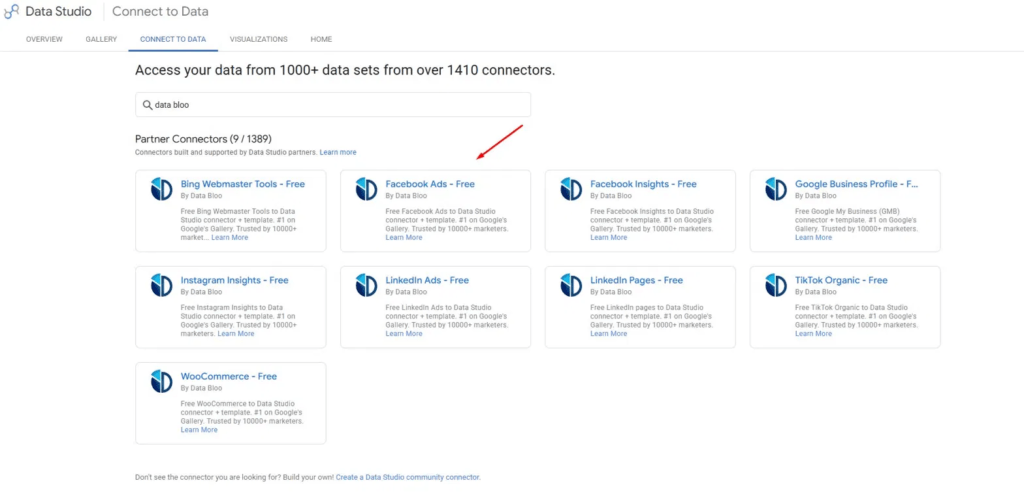
Step 3: The connector configuration screen will open. Select your credentials, choose your Facebook Ads account, set your conversions and conversion window preferences, then click Connect.
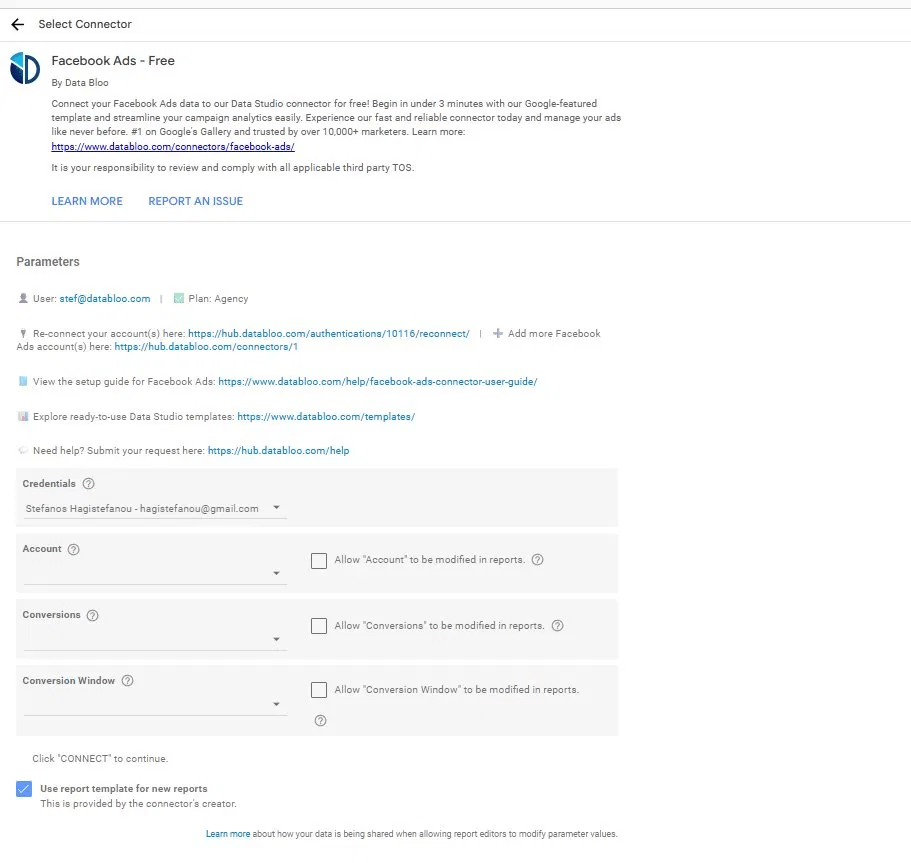
Step 4: Click Connect, then Create Report. Your Facebook Ads data source is live and ready to use.
Tip: Check the “Use report template for new reports” box on the configuration screen. It applies a pre-built Data Bloo layout automatically – saving you from starting with a blank canvas.
Use a Ready-Made Facebook Ads Template (Faster)
Building a report from a blank canvas works, but it takes time. The faster approach – and the one most agencies use – is starting from a template.
Data Bloo’s Facebook Ads report template comes pre-built with the charts, KPIs, and layout you need. Connect your data source, and your report is ready in minutes.
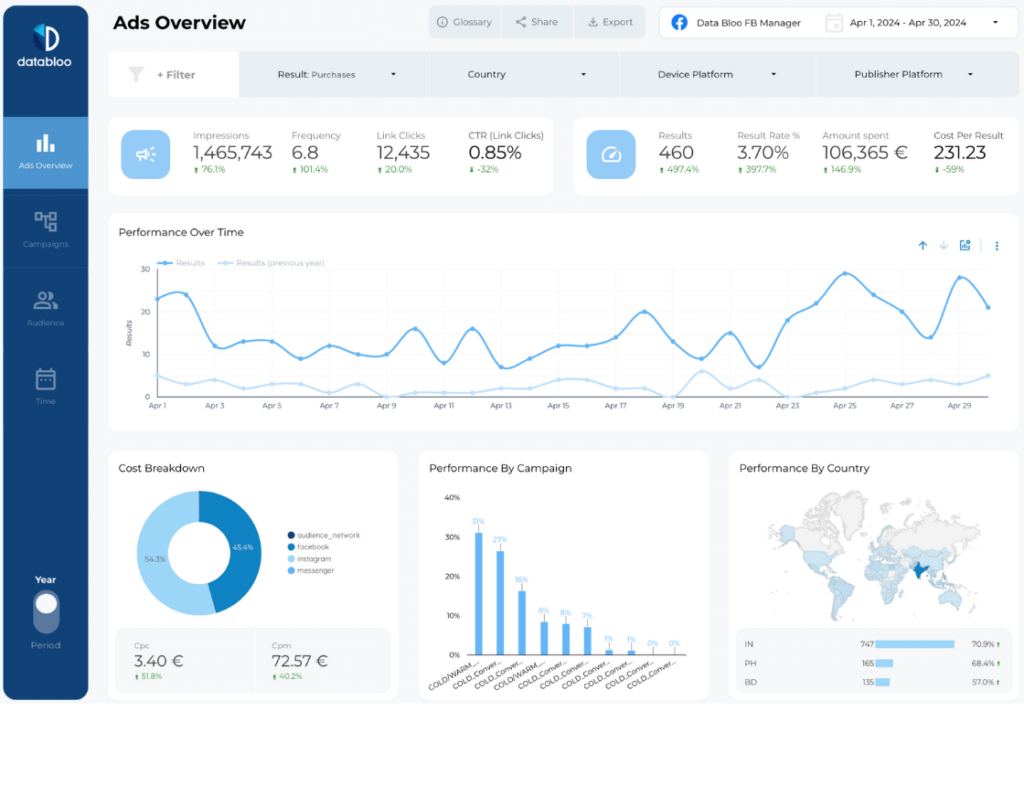
The template covers:
- Campaign overview — spend, impressions, clicks, CTR, and ROAS at a glance
- Conversion tracking — purchases, leads, cost per result, and conversion value
- Audience breakdown — performance by age, gender, country, and device
- Placement performance — Facebook vs. Instagram vs. Audience Network
- Period-over-period comparisons — month-on-month and year-on-year trend views
If you need to white-label it for a client, you can swap in their logo, apply their brand colors, and remove any pages that aren’t relevant to their business. Unlimited edits, no restrictions.
Key Facebook Ads Metrics Available in Data Studio
Once you’re connected, you have access to the full range of Facebook Ads metrics and dimensions. Here are the ones that matter most for reporting.
Performance Metrics
| Metric | What It Tells You |
|---|---|
| Impressions | How many times your ad was shown |
| Reach | How many unique people saw it |
| Link clicks | Traffic being driven to your site |
| CTR (link click-through rate) | Whether your creative and targeting are working |
| Amount spent | Total budget consumed over the period |
| Cost per result | Efficiency of your conversions |
| ROAS | Revenue generated per dollar spent |
| CPA | Cost to acquire one customer or lead |
Dimensions for Segmentation
Breaking performance down by the right dimensions is what separates a useful report from a generic one. Key dimensions include campaign name, ad set name, ad name, objective, publisher platform (Facebook, Instagram, Messenger), placement, country, age range, gender, and device platform.
All of these come through automatically with the Data Bloo connector, so you don’t have to configure them manually.
What to Do After Connecting
Getting the data in is step one. Making it useful for clients is step two.
Add date range controls. This lets clients change the reporting period themselves without needing to ask you. Go to Insert → Date range control and place it at the top of your report.
Set up period comparisons. Clients want to know if things are getting better or worse. Add comparison date ranges to your scorecards so each metric shows the change versus the previous period.
Apply filters for multi-client reports. If you’re running one dashboard for multiple accounts, add a campaign name or account filter so each client only sees their own data.
Schedule automated delivery. In Data Studio, go to Share → Schedule email delivery. Set a recurring send – weekly or monthly – and your client gets a fresh report in their inbox without you lifting a finger.
Common Issues (and How to Fix Them)
Authentication Expired
Your connection is no longer authenticated, so Data Bloo can’t retrieve your ad data. This usually happens when the access token expires, the token is revoked, or your login credentials changed.
To fix it: go to hub.databloo.com, open Data Sources → Facebook Ads, and click the Re-authenticate button on your connection. If that button isn’t available, click Add new connection instead. Reload your Data Studio report once reconnected.
Session Invalidated
Your authentication session is no longer valid. This happens when an access token expires, after a password or security change, or due to prolonged inactivity.
To fix it: go to hub.databloo.com, select Data Sources, and click Add Account. Re-select your account or click Skip – this generates a new access token automatically. Reload your Data Studio report after reconnecting.
Account Required
No account is selected for the data source, so the connector has nothing to query. Metrics and dimensions are tied to specific accounts – without at least one selected, the report can’t run.
To fix it: open your report in Data Studio, go to Edit data source → Edit connection, select at least one account under the Account field, and click Reconnect. Refresh your report and data should appear.
For a full list of Facebook Ads connector errors and fixes, visit the Data Bloo Facebook Ads error guide.
Using Your Facebook Ads Data in Multi-Channel Reports
One of the biggest advantages of having Facebook Ads in Data Studio is the ability to combine it with other data sources in a single report.
With Data Bloo’s Custom Master Template, you can blend Facebook Ads data with Google Ads, GA4, Search Console, and more – all in one dashboard. Instead of jumping between platforms or building separate reports for each channel, you get a single view of your complete marketing performance.
This is especially useful for agencies managing full-funnel campaigns, where Facebook might drive awareness while Google captures the conversion. Seeing both in one place makes it much easier to tell the right story to clients.
FAQs
Does Data Studio have a native Facebook Ads connector?
No. Data Studio connects natively to Google products only. You need a third-party connector like Data Bloo to bring Facebook Ads data in.
Is it free to connect Facebook Ads to Data Studio?
Data Studio itself is free. The connector may have a cost depending on the provider. Data Bloo offers a free connector for Facebook Ads – you can check the current plans on the connectors pricing page.
Can I connect multiple Facebook Ads accounts to one report?
Yes. When setting up the connector, you can select multiple ad accounts. This is useful for agencies managing several clients from one dashboard.
What Facebook Ads metrics are available in Data Bloo’s connector?
Once connected, you have access to spend, impressions, reach, clicks, CTR, CPC, CPM, conversions, conversion value, ROAS, CPA, and many more – plus all major dimensions like campaign, ad set, ad, placement, country, device, age, and gender.
Can I white-label my Facebook Ads report for clients?
Yes. Data Bloo templates support full white-labeling – add your client’s logo, apply their brand colors, and share via a private link or scheduled email delivery.