Table of Contents
If you’re looking for viable Agency Analytics alternatives, the number of potential tool candidates may be overwhelming.
Fear not – this article is an overview into the majority of tools on the market. For your convenience, we covered three major aspects of every tool: its reporting capabilities, pricing model, and level of data management.
Using our guide, you can quickly compare AgencyAnalytics with other tools and choose the one that your data needs the most.
Let’s dive in!
Looker Studio
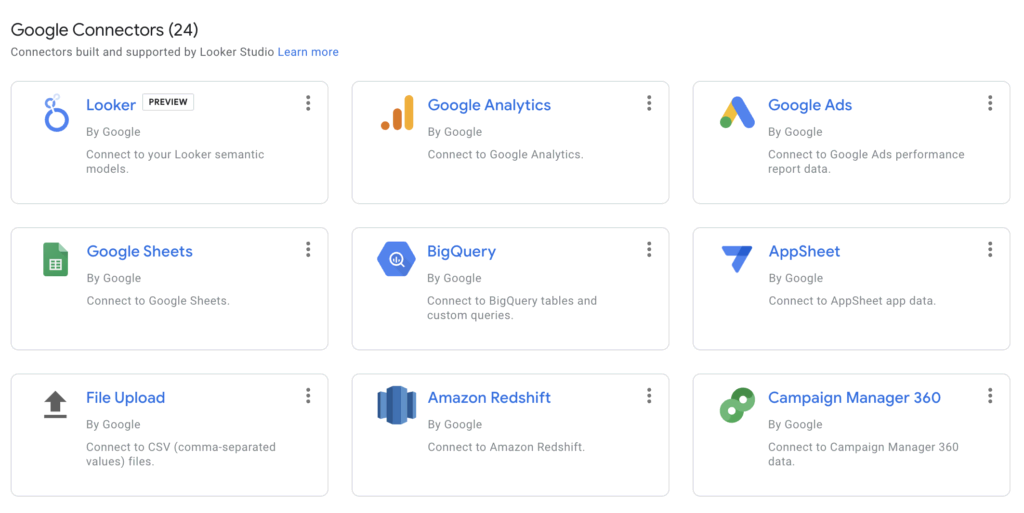
Looker Studio (formerly Google Data Studio) is a free data visualization platform by Google. It can be used by marketers, analysts, and agencies to build interactive dashboards and reports of various complexity. Compared to AgencyAnalytics, it offers more customization and integration flexibility — but it comes with a steeper learning curve and lacks some out-of-the-box client reporting features.
Reporting
Looker Studio lets users create fully customizable reports using charts, tables, scorecards, and visual widgets. Reports are interactive, and shareable via link. They can be embedded or scheduled for email delivery. While it doesn’t come with pre-built marketing reports like AgencyAnalytics, it gives users total control over layout, branding, and storytelling.
Pricing
Looker Studio is completely free to use with Google data sources. To connect to non-Google platforms, Looker Studio users have to rely on third party data connectors, and sometimes those come at a price. Tools like Databloo, though, provide Looker Studio data connectors for free.
Data Management
Looker Studio is highly flexible: there you can blend data from multiple sources, build calculated fields, and apply filters or data segments across charts. However, it doesn’t store data or perform ETL operations.
Data Bloo

Data Bloo is a library of pre-built reporting templates each focused on different needs of an agency – ranking from all-encompassing platform-specific reporting templates (e.g Google Analytics 4 Report Template For Looker Studio) to multi-channel and reports tailored to specific industries and niches (e.g. Ecommerce templates).
Reporting
Data Bloo reporting capabilities are vast — each template is structured for maximum efficiency and optimal reporting, created by analysts with decades of field expertise.
However, you can tailor every report to your needs – add more data channels, rearrange layout, replace fonts, and white labeling, and more.
Pricing
Each Data Bloo template is purchased separately. That said, the payment is one-time, and allows for indefinite access, not locking you into any subscription models like many other services on this list, Agency Analytics included.
As a bonus,each template comes with a free, fully functional demo that lets you see reports already populated with your data.
Data management
Given that Data Bloo builds on top of Looker Studio, its data management capabilities are vast. You can update and improve reports with adding new data channels, use advanced metric calculations, and so on. To do that, however, requires some level of proficiency with Looker Studio.
Databox
Databox is a dashboard and reporting for marketing teams and agencies that want to streamline KPIs from multiple tools. Compared to AgencyAnalytics, it offers more data flexibility and visualization options but may require a bit more setup.
Reporting
Databox offers a wide variety of reporting options such as live dashboards, scheduled email reports, and mobile-friendly views. Users can choose from over 300 pre-built templates or build custom dashboards with drag-and-drop widgets. The tool supports goal tracking, alerts for metric changes, and scorecards that summarize performance across campaigns. Advanced users can create calculated metrics or combine data from multiple sources in a single view.
Pricing
Databox’s pricing model is based on the number of data source connections, users, and data storage. It has a limited free plan (3 data sources, 3 users, 3 dashboards), with paid plans starting around $47/month for more sources, dashboards, and advanced features like calculated metrics and white labeling. It’s affordable for small teams and scales well for growing agencies.
Data Management
Databox offers a moderate level of data management. Users can pull in metrics from 120+ native integrations. It supports basic data manipulation (like calculated metrics and data blending) within the dashboard builder, but it’s not a full data warehouse or ETL tool. Compared to AgencyAnalytics, Databox offers more flexibility for combining and transforming data, but it’s still geared toward non-technical users rather than data engineers.
DashThis
DashThis is a plug-and-play marketing dashboard tool built for agencies and marketers for simple, automated client reporting. Compared to AgencyAnalytics, it offers similar ease of use but with fewer built-in SEO tools and less emphasis on technical audits.
Reporting
DashThis specializes in automated visual reports that aggregate data from platforms like Google Analytics, Google Ads, Facebook Ads, LinkedIn, and more.
It includes pre-built templates for SEO, PPC, email marketing, and social media dashboards, making setup extremely fast. Users can schedule recurring reports via email, annotate graphs via widgets, and customize widgets with drag-and-drop ease. However, it lacks SEO features like keyword tracking or backlink site audits that are present in AgencyAnalytics.
Pricing
DashThis pricing model is based on the number of dashboards available in each plan. The cheapest plan starts with $42 per month and provides access to 3 dashboards. The number of users, data sources, and integrations in each plan is unlimited.
Data Management
DashThis provides basic data management features focused on simplicity and speed. You can import custom data via CSV or Google Sheets, but there are no options for advanced calculations, data blending across sources, or querying databases. It works well for users who want fast, clean reporting with minimal technical overhead. Compared to AgencyAnalytics, DashThis is slightly more limited in custom metric handling and is not suitable for complex or large-scale data environments.
NinjaCat
NinjaCat is an all-in-one reporting and call tracking platform designed for digital marketing agencies who supervise multiple client accounts. Compared to AgencyAnalytics, it supports deeper integrations, larger teams, and more enterprise-scale customization, yet has a steeper learning curve.
Reporting
NinjaCat excels at multi-channel, client-facing reporting with a strong visual focus. It supports no-code drag-and-drop report creation, scheduled email delivery, and white-labeled dashboards. Templates are available for PPC, SEO, social, and call tracking, with dynamic, automatically updated widgets that auto-update. A standout feature is its call tracking and attribution.
Pricing
NinjaCat pricing is less transparent,offering no public pricing model. It is custom quotes based on the number of clients, data sources, and features needed. It’s generally priced for mid-sized to large agencies, starting around several hundred dollars per month.
Data Management
NinjaCat offers advanced data management capabilities. Users can import data from over 150 integrations, connect via BigQuery, or use data from spreadsheets, CRMs, or custom databases. It supports data blending, calculated metrics, budget pacing, and KPI tracking across platforms. This positions NinjaCat as a more powerful (and complex) and expensive tool than AgencyAnalytics — one that’s suitable for agencies handling high volumes of data, cross-channel reporting.
PorterMetrics
Porter Metrics is a lightweight reporting tool that connects marketing data to Google Looker Studio (formerly Data Studio) or Google Sheets. Compared to AgencyAnalytics, it’s more flexible in visualization but relies on Looker Studio for all reporting and design.
Reporting
Porter Metrics itself doesn’t offer standalone dashboards. Instead, it acts as a connector that feeds real-time data from platforms like Facebook Ads, LinkedIn Ads, and HubSpot into Looker Studio or Google Sheets, where users can build and customize reports. It offers plug-and-play templates and prebuilt connectors to speed up the process.
Pricing
Porter Metrics uses a connector-based pricing model, where you pay based on the number of account connections per platform. Plans start at$12.5/month per account. There’s no limit on dashboards or users.
Data Management
Porter Metrics allows moderate data management, depending on the connectors used, but you’ll need knowledge of Looker Studio to make the most of it. Porter itself doesn’t store or transform data — it just transfers it. For deeper data control (e.g. blending multiple sources or handling SQL queries), you’ll need to handle those tasks within Looker Studio or connect to a data warehouse. Compared to AgencyAnalytics, Porter is more flexible when you know how to use it, but offers no hand-holding or built-in structure for beginners.
Reportz
Reportz is a client reporting tool designed specifically for digital marketing agencies. It offers fast, no-frills dashboards with real-time data and an emphasis on affordability. Compared to AgencyAnalytics, it’s leaner, more budget-friendly, and less feature-heavy, making it suited for teams that only need quick, automated reports.
Reporting
Reportz focuses on live, shareable dashboards that pull data from marketing platforms like Google Analytics, Google Ads, Facebook Ads, and more. You can build reports using drag-and-drop widgets, filter by date, and clone templates to save time. Reports are fully white-labeled and can be scheduled via email. While it lacks extras like SEO audits or call tracking, Reportz delivers solid, real-time reporting that’s quick to deploy and easy to maintain.
Pricing
Reportz offers flat-rate, dashboard-based pricing, starting at $9.99 per dashboard per month (and discounts for higher volumes). Each dashboard includes unlimited widgets, users, and integrations, which makes the platform highly scalable for agencies that manage lots of clients.
Data Management
Reportz is a basic data visualization tool with limited options for custom metrics or data manipulation. While it supports all the essential integrations and lets you filter or segment data, it doesn’t allow for blending data from multiple sources or performing advanced calculations. There’s no support for databases or custom data pipelines. Compared to AgencyAnalytics, it’s similarly limited in data depth, but even more stripped-down.
Swydo
Swydo is a reporting and monitoring platform tailored for digital marketing agencies and in-house teams. Compared to AgencyAnalytics, it offers similar automation and white-labeling features but distinguishes itself with dynamic templates and goal-tracking functionalities.
Reporting
Swydo provides a user-friendly interface to create detailed marketing reports and dashboards. Users can leverage pre-built templates or customize their own, integrating data from over 30 platforms such as Google Ads, Facebook Ads, and LinkedIn Ads. Reports can be scheduled for automatic delivery and are fully white-labeled, allowing customization of logos and colors.
Pricing
Swydo has a usage-based pricing model. The base plan starts at $49/month and includes 10 data sources, unlimited users, dashboards, and reports. Additional data sources are charged on a sliding scale: 3.50 euros per source for 11–100 sources, $2.50 for 101–500, and $1.50 for over 500 sources.
Data Management
Swydo offers moderate data management capabilities. Users can create custom metrics by combining existing ones from the same data source and integrate data via Google Sheets for platforms that are not natively supported. The tool doesn’t provide advanced data transformation or warehousing features.
TapClicks
TapClicks is a versatile marketing operations platform designed for agencies and enterprises managing large volumes of data across multiple clients. Compared to AgencyAnalytics, it offers more advanced data integration, automation, and scalability features, making it suitable for organizations with complex reporting needs.
Reporting
TapClicks provides robust reporting capabilities through its Report Studio, allowing users to create interactive, data-driven reports and presentations. Features include dynamic text, object effects, GIF support, and drag-and-drop editors. Reports can be customized using preloaded templates or built from scratch, and are shareable in PDF and PowerPoint formats.
Pricing
TapClicks offers multiple pricing tiers to accommodate different business needs. The cheapest plan starts at $99 per month and includes access to 64 data connectors for up to 10 clients. More expensive plans offer more connectors, and access to advanced features such as calculations, scale management, multiple export destinations, and so on.
Data Management
TapClicks is a robust data management tool and as such offers advanced features suitable for large-scale operations. The platform supports over 250 native integrations and provides SmartConnectors™ for custom data sources. For example, Scale Management tools enable users to handle extensive datasets efficiently, with capabilities like auto-assign, client groups, data warehousing and business units for organized data segmentation. TapClicks also offers batch operations for bulk data editing and data import/export functionalities to manage large datasets seamlessly.
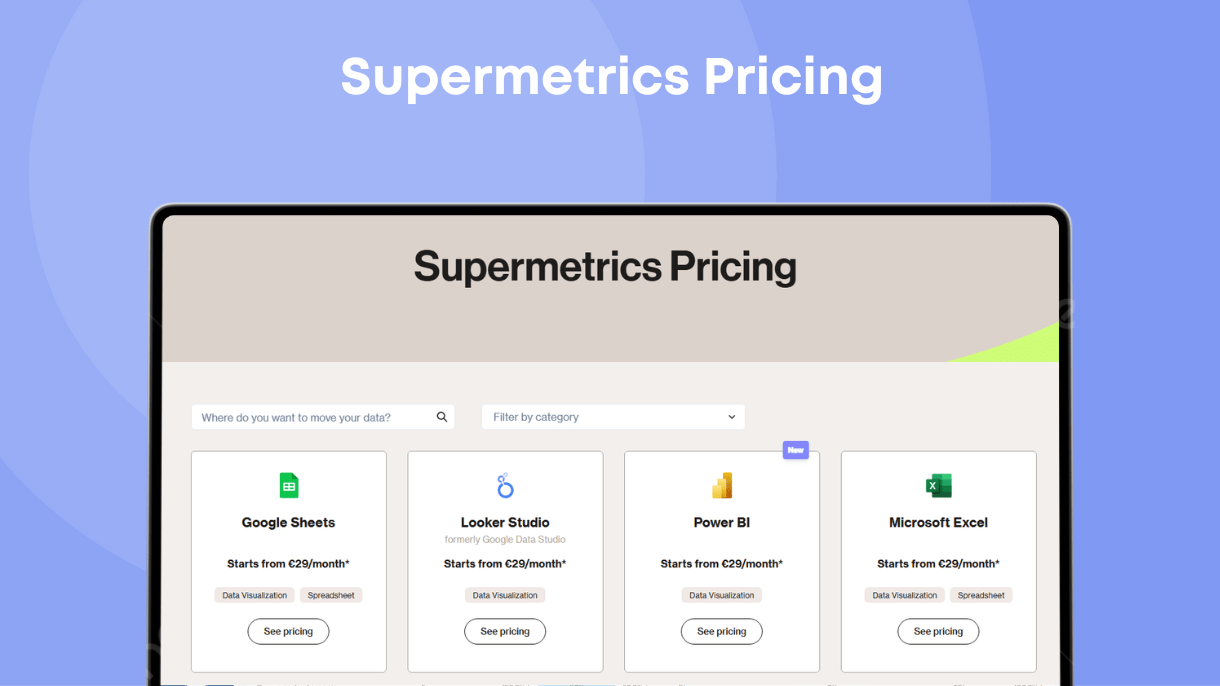
Supermetrics
Supermetrics is a powerful data integration tool that automates the transfer of data from various marketing platforms into reporting and analytics tools like Google Sheets, Excel, Looker Studio, or data warehouses. Compared to AgencyAnalytics, Supermetrics offers greater flexibility and scalability in data handling, provides no data visualization features of its own (relies on 3rd party tools), and requires more technical proficiency to set up and manage effectively.
Reporting
Supermetrics has data visualization functionality of its own, but enables users to pull data from over 150 marketing platforms into their preferred analysis tools. It supports real-time data fetching, scheduled refreshes, and automated report deliveries via email or collaboration platforms like Slack and Teams. Users can create custom fields, blend data from multiple sources, and apply transformations to tailor reports to specific needs.
Pricing
Supermetrics has a modular pricing model based on the data destination (e.g., Google Sheets, Excel, Looker Studio) and the number of data sources, users, and accounts. The cheapest plan is 29 euros per data connector that allows for 3 data sources, 1 user, and 3 accounts per data source with a single core destination.
You can learn more about Supermetrics pricing and how it compares with other tools from our standalone guide.
Data Management
Supermetrics offers advanced data management capabilities, allowing users to edit, manage, blend, and transform marketing data without requiring technical skills. Features include dynamic currency conversion, campaign naming convention parsing, and the creation of custom fields for tailored data analysis. Users can blend data from multiple paid channels to gain a holistic view of performance and calculate metrics like ROI or ROAS. Supermetrics does not function as a full-fledged data warehouse, but supports integrations with data storage solutions such as Google BigQuery, Snowflake, and Amazon S3.
Windsor.ai
Windsor.ai is an AI-powered marketing attribution and data integration platform designed for marketers and analysts seeking to combine and analyze data from multiple channels. Compared to AgencyAnalytics, Windsor.ai offers more advanced data integration and attribution modeling capabilities.
Reporting
Windsor.ai connects data from over 300 marketing platforms, including Google Ads, Facebook Ads, and HubSpot. Users can automate data collection and generate real-time dashboards with AI-powered insights. The platform supports customizable dashboards.
Pricing
Windsor.ai offers flexible pricing plans to accommodate different business needs. Each plan provides access to all destinations and data sources, with the cheapest one starting at $19 per month with access to 3 different data sources, 75 accounts, and unlimited users.
Data Management
Windsor.ai is great for data management and provides extensive data integration capabilities. The platform connects to over 300 marketing platforms, enabling users to unify data from various sources and supports data transformation and cleaning within the platform. Users can export data to BI tools like Looker Studio, Power BI, and Tableau, as well as data warehouses such as Google BigQuery and Snowflake.
Power My Analytics
Power My Analytics is a marketing data hub that automates the collection, warehousing, and integration of data from over 40 marketing platforms into tools like Looker Studio, Google Sheets, Excel, and major data warehouses. Compared to AgencyAnalytics, it offers more advanced data management capabilities.
Reporting
Power My Analytics provides a suite of pre-built report and dashboard templates for various marketing scenarios, including SEO, PPC, social media, email, and e-commerce reporting. These templates are designed for Looker Studio and Google Sheets and help users to quickly generate insightful reports. The platform supports automated data refreshes and backfilling. Users can also customize them to a degree to align further to their needs.
Pricing
The cheapest PMA pricing plan starts at $14.95 per month and is limited by 1 source, 1 account, and 1 admin. The more lucrative plans extend these metrics while adding on more advanced features such as spreadsheet addon, exports, sovereign data warehousing for an enterprise plan and hourly refreshes.
Data Management
Power My Analytics excels in data management by offering automated data collection from a wide array of marketing platforms, centralized warehousing using Google Cloud (included free), and seamless integration with tools like Looker Studio, Google Sheets, Excel, and major data warehouses such as BigQuery and SQL. The platform supports data backfilling, API access, FTP exports, and dedicated account representatives for high-tier paid plans.
Dataslayer
Dataslayer is a marketing data integration and reporting tool designed for agencies and marketers focused on cost-efficiency and seeking to automate data workflows without incurring per-user fees. Compared to AgencyAnalytics, Dataslayer offers greater flexibility in data destinations and advanced data management capabilities.
Reporting
Dataslayer simplifies the reporting process by allowing users to import and automate marketing data from over 50 platforms. The platform supports scheduled data refreshes, enabling users to maintain up-to-date reports with minimal manual intervention. Additionally, Dataslayer offers features like data blending and the ability to import existing queries from Supermetrics, helping to a smooth transition for users switching platforms.
Pricing
Dataslayer has a usage-based pricing model that charges based on daily API calls rather than the number of users. You need to choose a target destination platform thought in a way similar to Supermetrics, and pay for each new destination separately. More expensive plans increase the number of API calls and accounts per connector.
Data Management
Dataslayer has robust data management capabilities, supporting integrations with databases like MySQL, PostgreSQL, Microsoft SQL Server, and MongoDB. Users can export data to data warehouses. The platform’s API Query Manager enables users to extract data into BI tools like Tableau, Qlik, and Power BI.
Tableau
Tableau is a business intelligence and data visualization platform designed for analysts, data teams, and enterprises. Compared to AgencyAnalytics, Tableau offers significantly more advanced data modeling, governance, and scalability features, making it a good fit for organizations with complex data environments and analytical needs.
Reporting
Tableau offers a rich suite of tools for creating interactive, real-time dashboards and visualizations. Users can build reports using drag-and-drop interfaces, apply advanced calculations, and incorporate AI-driven insights through features like Tableau Pulse. The platform supports a wide range of data connectors, enabling seamless integration with various data sources. Reports can be shared across teams via Tableau Cloud or Server.
Pricing
Tableau offers a diverse set of plans to accommodate different data management and reporting needs. The cheapest and simplest pricing plan Tableau Viewer that starts at $15 and simply allows for viewing and interacting with dashboards.
Data Management
Tableau offers robust data management features through features like Tableau Prep Conductor and Tableau Catalog. Tableau Prep Conductor allows for the scheduling and monitoring of data preparation flows, while Tableau Catalog provides a comprehensive view of data assets, enabling users to discover, understand, and trust their data. Advanced features include data lineage, impact analysis, and metadata management.
Klipfolio
Klipfolio is a cloud-based business intelligence and dashboard platform designed for businesses, agencies, and analysts to create real-time, interactive dashboards and reports. Compared to AgencyAnalytics, Klipfolio offers more advanced customization and data integration capabilities.
Reporting
Klipfolio can be a great reporting solution by providing a highly customizable dashboard builder with drag-and-drop functionality, allowing users to create tailored views for different clients, teams, or metrics. The platform supports integration with over 100 data sources and SQL databases, enabling comprehensive data visualization. Users can build custom data visualizations, apply advanced calculations, and create interactive dashboards that update in real-time.
Pricing
Klipfolio base pricing plan starts at $80 per month and includes access to 3 dashboards while supporting unlimited number users. Extended packages increase the number of available dashboards while adding advanced features such as single sign on, scheduled reports, and publishable links.
Data Management
Klipfolio offers robust data management capabilities. Users can connect to data warehouses such as Snowflake, BigQuery, Databricks, Redshift, PostgreSQL, and MariaDB through add-ons, enabling advanced data analysis and storage. The platform’s schema-less architecture allows non-technical users to connect to data sources and separate data from presentation for efficient reuse. Klipfolio also provides features like data transformation, data modeling, and calculated fields.
SEMrush

Semrush is a comprehensive digital marketing platform offering tools for SEO, PPC, content marketing, and competitive research. Compared to AgencyAnalytics, Semrush provides a more extensive suite of features related to SEO and search performance, making it ideal for businesses seeking marketing analytics and strategy development in these aspects.
Reporting
Semrush provides client-optimized SEO reports that connect to Google Analytics 4 and Google Search Console Data, as well as platform-fueled reports focused on different aspects of SEO performance such as backlinks, competitor analysis, and technical audit analysis.
Pricing
Semrush pricing plans start at $139+ per month, making it a lucrative tool compared to others on this list if your needs exceed SEO reporting, but justifiable if SEO is the primary aspect of your agency reporting needs.
Data Management
Semrush does not support data warehousing, and data connectors. You will need to rely on external tools and plugins if you want to combine Semrush data with other data you have.
SE Ranking
SE Ranking is a tool similar to Semrush as it focuses mostly on SEO reporting. Compared to AgencyAnalytics, SE Ranking provides a more comprehensive suite of SEO-focused features, making it suitable for businesses seeking in-depth search engine optimization capabilities.
Reporting
SE Ranking offers customizable reporting features, including white-label reports, scheduled email deliveries, and integrations with tools like Google Looker Studio. Users can generate detailed reports encompassing keyword rankings, website audits, backlink profiles, and competitor analysis. The platform’s reporting tools are designed to provide clear insights into SEO performance.
Pricing
SE Ranking provides three primary subscription plans, with pricing based on the number of keywords tracked and the frequency of rank checks, the cheapest plan starting at $52 per month billed annually.
Data Management
SE Ranking provides robust data management capabilities when it comes to SEO, but limited compared to other tools on this list when it comes to broader reporting and data management functionality.
Adverity
Adverity is an advanced data integration and analytics platform tailored for enterprise marketing and analytics teams. Compared to AgencyAnalytics, Adverity offers more sophisticated data transformation, governance, and scalability features.
Reporting
Adverity provides robust reporting capabilities, enabling users to create real-time, interactive dashboards and visualizations. The platform supports integration with over 600 data sources. Features include real-time reporting, trend analysis, retroactive reporting, segmentation, and campaign tracking. Users can also export data to BI tools like Looker Studio, Tableau, and Power BI for advanced visualization.
Pricing
Adverity pricing model is usage-driven. The first plan starts at $500 per month, with the plan including 200,000 unique data rows per month and up to 15 sources, and basic data integration features.
Data Management
Adverity is tailored for enterprise-level data management, offering features like automated data cleansing, seamless transformations, and data enrichment. The platform’s Data Quality Suite includes AI-powered monitors to ensure data accuracy, consistency, and completeness. Users can standardize data structures, apply smart naming conventions, perform currency conversions, and utilize a shared data dictionary for unified data comprehension. Adverity supports integration with various data warehouses and BI tools.
FiveTran
Fivetran is a cloud-based data integration platform that automates the extract, load, and transform (ELT) process. Compared to AgencyAnalytics, Fivetran offers a more robust and scalable solution tailored for enterprises requiring complex data pipelines.
Reporting
Fivetran itself doesn’t provide direct reporting tools, instead preparing data for analysis by providing accurate and timely data replication. It integrates with over 650 data sources, including databases, SaaS applications, and cloud services.
Pricing
Fivetran employs a usage-based pricing model centered around Monthly Active Rows (MAR), which are unique rows added, updated, or deleted in a month.
Data Management
Fivetran offers advanced data management capabilities, including automated data extraction, transformation, and loading processes. It supports integration with a wide array of data sources and destinations, facilitating real-time data replication and ensuring data consistency across platforms.
Features like change data capture (CDC) allow for efficient data synchronization, and the platform’s support for tools like dbt enables users to perform in-warehouse data transformations. Additionally, Fivetran provides robust security measures, including role-based access control and encryption, to safeguard data throughout the integration process
Google Analytics 4

Google Analytics 4 (GA4) is an analytics platform from Google focused on providing insights into search and paid search performance and tracking user interactions across websites and apps.
Reporting
GA4 offers a broad range of built-in reports such as traffic acquisition, engagement, monetization, retention, auction insights, and more. It works with an event-based tracking model, enabling users to measure custom interactions like button clicks or scrolls without extra tagging. GA4 also supports customizable dashboards and exploration tools like path analysis, funnel exploration, and segment overlap.
Pricing
GA4 is free for most users and offers robust functionality out of the box, making it a great choice for small to medium businesses.
Data Management
GA4 provides moderate data management capabilities natively. Users can create custom events and dimensions, define conversions, and segment audiences within the platform. However, GA4 lacks true ETL functionality or multi-source data aggregation, which makes it less suitable as a standalone solution for agencies needing cross-platform reporting and data warehousing.