Table of Contents
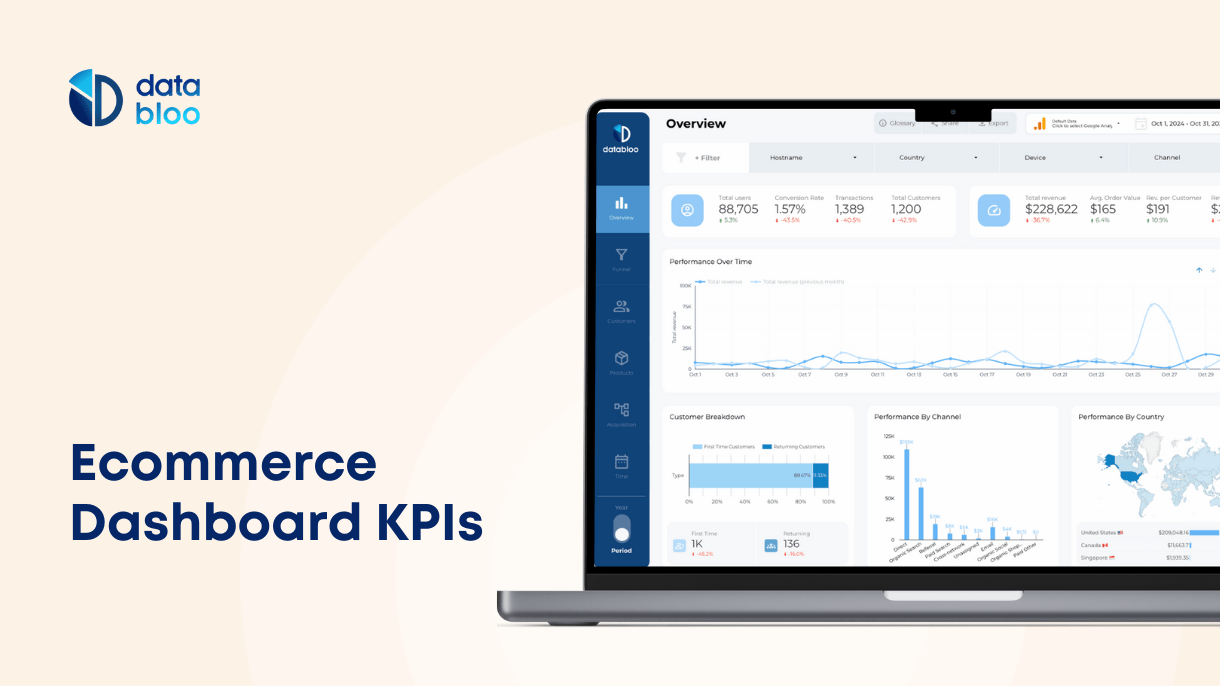
There’s no such thing as a perfect ecommerce dashboard, but you might come really close if you know what ecommerce KPIs are most important to track and how they work together in a single dashboard to produce reliable and regular insights.
Although the selection of KPIs for an ecommerce dashboard should be tailored to the specific needs and goals of the business, different businesses might prioritize different KPIs based on their unique strategies, customer base, and operational challenges.
However, there are ecommerce KPIs that should be present in any ecommerce dashboard.
In this article, we’ll cover critical ecommerce KPIs to feature in your dashboards and reports, explain how to add them, and how to combine them in a single dashboard for business-developing insights.
But first, let’s discuss the difference between important and unimportant ecommerce dashboard KPIs.
Try our GA4 Audit with 25+ actionable checks
Important vs Unimportant Ecommerce Dashboard KPIs
There are many ecommerce metrics you can obtain, but putting them all in a single dashboard would be unproductive. While some metrics don’t add anything to your bottom line, others are straight confusing.
Important e-commerce metrics instantly reveal a successful going of your campaigns while being directly attached to business metrics. These metrics also tend to work well with other ecommerce KPIs and establish ecommerce metrics such as conversion and gross margin.
Unimportant ecommerce KPIs are always indirect and seem important, but the connection to ecommerce performance is rarely direct and often ambiguous. Examples of less important metrics that you should probably avoid displaying in your ecommerce dashboards are page views or social media followers.
Let’s go through the most important ecommerce metric to feature on your ecommerce dashboard.
- 1. Conversion Rate
Conversion Rate = ( Number of Conversions / Total Number of Visitors) × 100%
Conversion rate is vital for measuring the success of your site in turning visitors into customers, directly impacting revenue. Conversion KPIs should always be a click away on your ecommerce dashboards because that are tightly related to other ecommerce metrics.
For example, if you’re not satisfied with your conversion metrics in a certain period, you can cross check the data with high card abandonment rates or low checkout metrics, and start optimizing your checkout process.
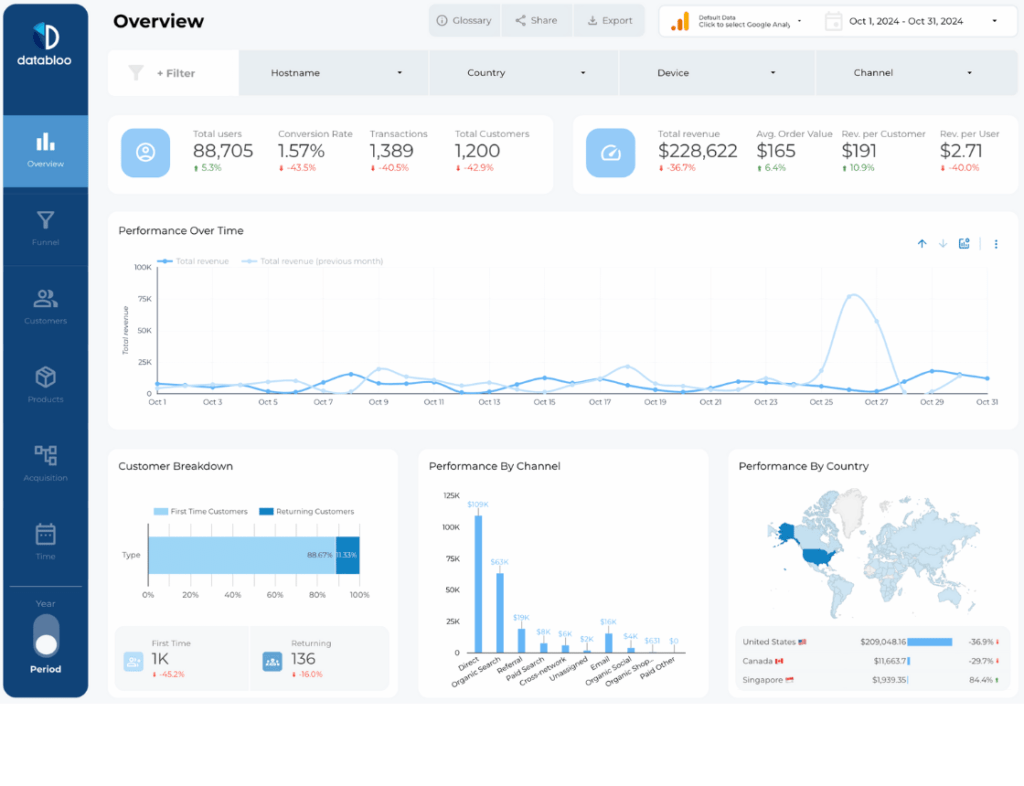
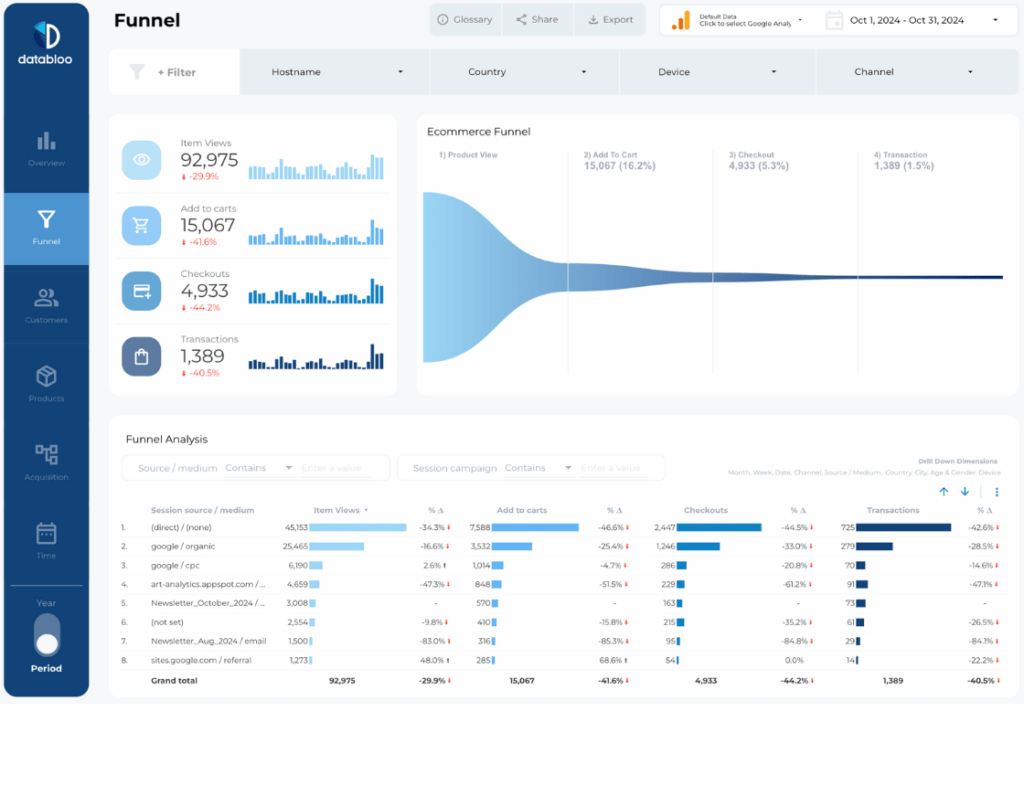
The more detailed your conversion funnel is visualized on your ecommerce dashboard, the easier it’s to spot where most of your conversions fall off.
- 2. Cart Abandonment Rate
Cart Abandonment Rate = (Number of Completed Purchases / Total Number of Shopping Carts Created) x 100%
Displaying cart abandonment rates in your ecommerce dashboard is vital to identify the proportion of potential sales lost and to highlight areas for improvement in the shopping and checkout process.
Although card abandonment rates vary from industry to industry, the average cart abandonment rate according to several studies is closer to astonishing 70%. But high cart abandonment often means untapped potential. So many factors contribute to cart abandonment that you always find new opportunities to improve your conversions.
Additionally, changes you make to improve cart abandonment are not short-lived and often force you to implement global positive changes to your entire sales funnel: better recommendation system, better advertisement, or more elaborate client reactivation campaigns.
Combine card add rates with product data to analyze card abandonment rates for individual products.
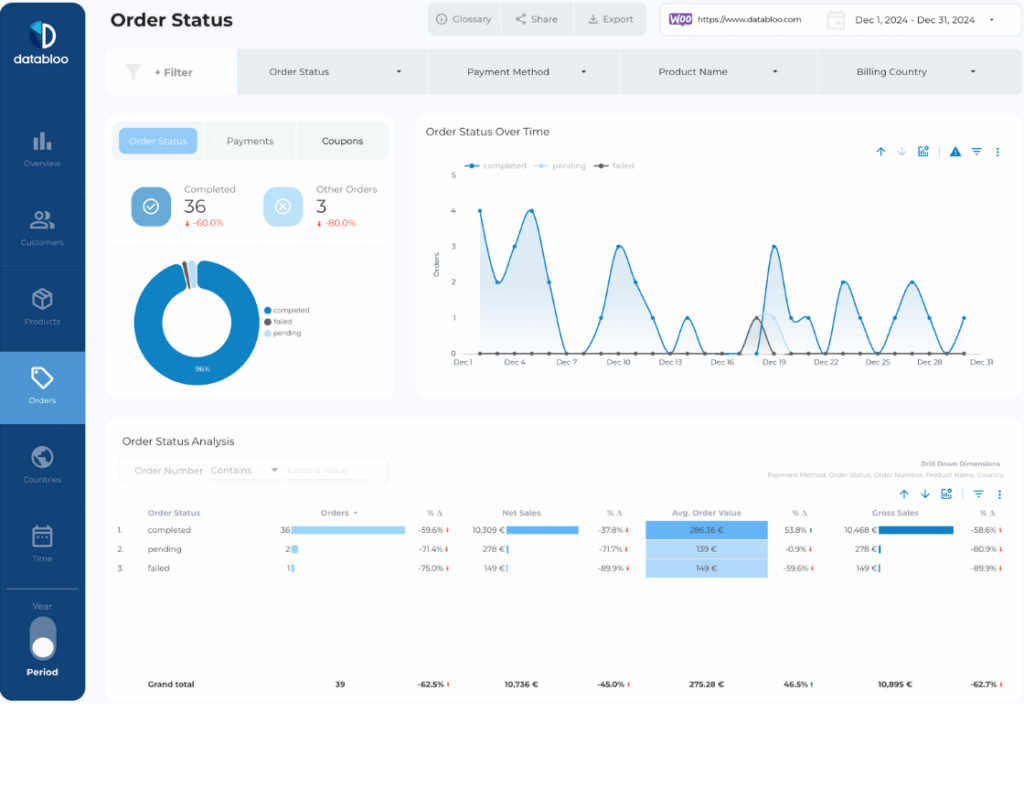
For more granular data, consider tracking multiple stages of a buyer’s journey and don’t limit yourself to cart abandonment. Track these statuses for more precise actionable data:
- completed
- refunded
- canceled
- failed
Tip: if you’re using WooCommerce plugin for your WordPress ecommerce site, you can combine Google data with WooCommerce to track order statuses with audience data in one dashboard.
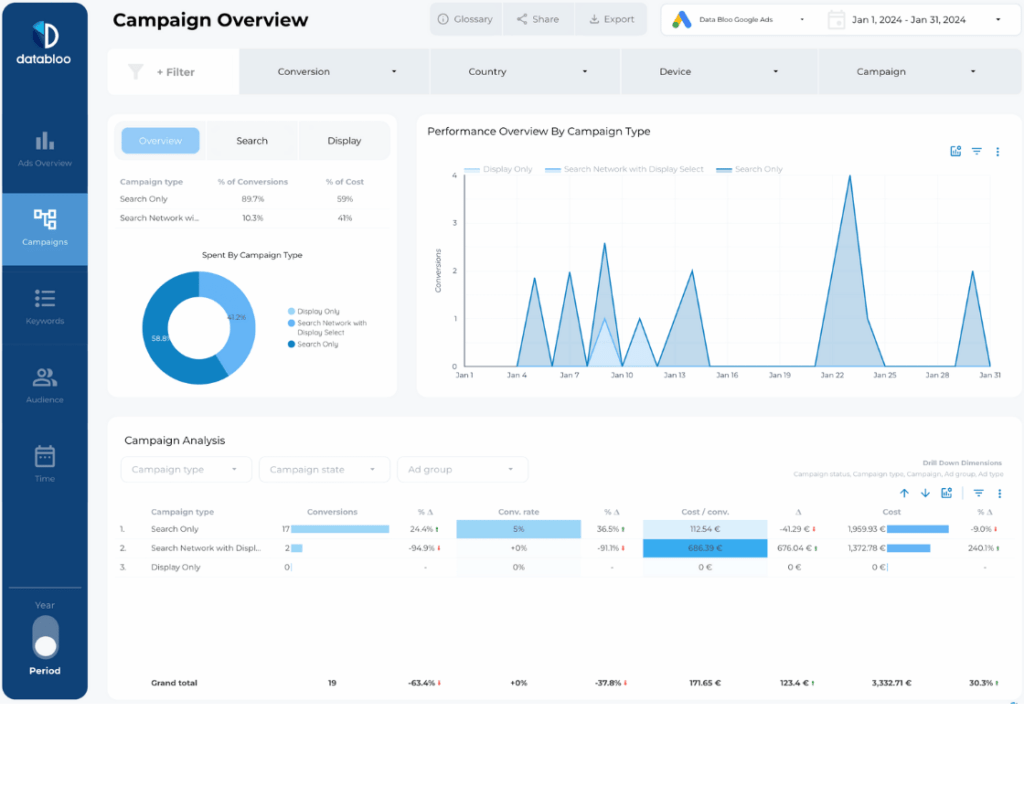
- 3. Cost Per Acquisition (CPA)
CPA is determined by dividing the total marketing expenses by the number of acquisitions over the same period.
Cost Per Acquisition KPI measures the cost-effectiveness of acquisition efforts and it’s vital for budget allocation and marketing strategy. Feel free to combine CPA data with traffic source performance to compare efficiency of different marketing channels over time or for a specific product.
You can optimize your CPA by A/B testing ads and targeting high-converting customer segments.
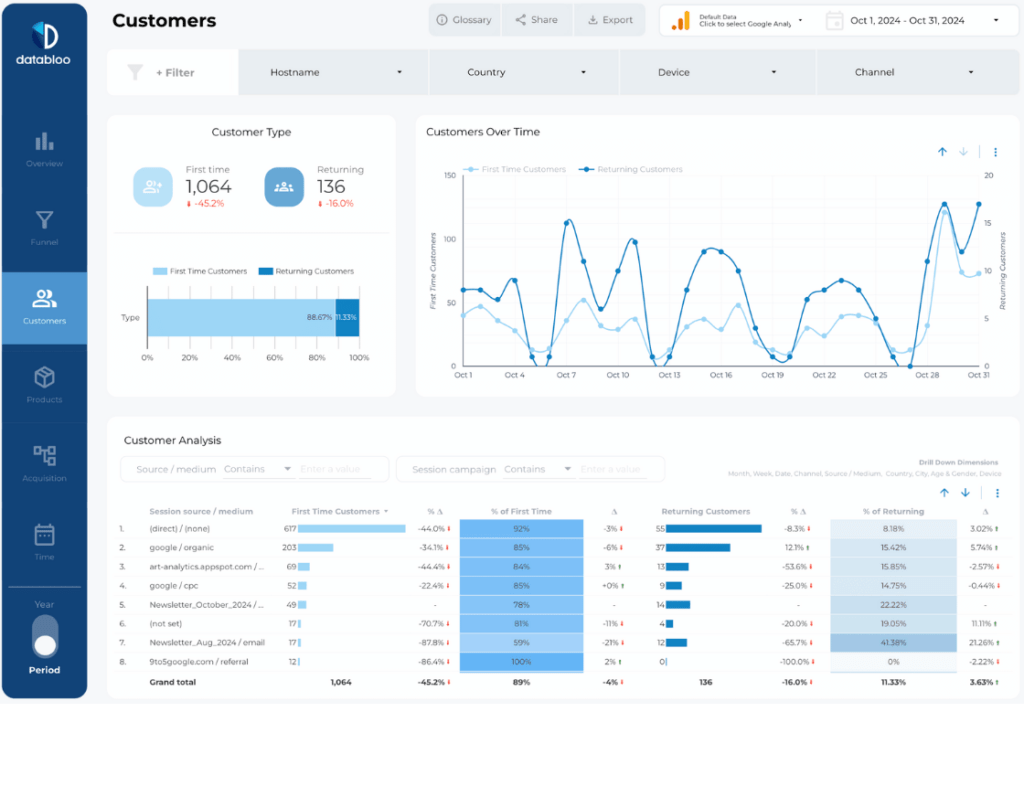
- 4. Customer Lifetime Value (CLV)
CLV is the average profit generated from a customer over the duration of their relationship with the company.
CLV helps predict revenue and inform strategies for customer retention and loyalty programs.
Displaying CLV along with audience data such as country, traffic sources, or pages visited in your ecommerce dashboard will help you establish better buyer personas, make better decisions on what audience brings the most value to your company over long periods of time and attract more people with similar behavior patterns to boost your bottom line.
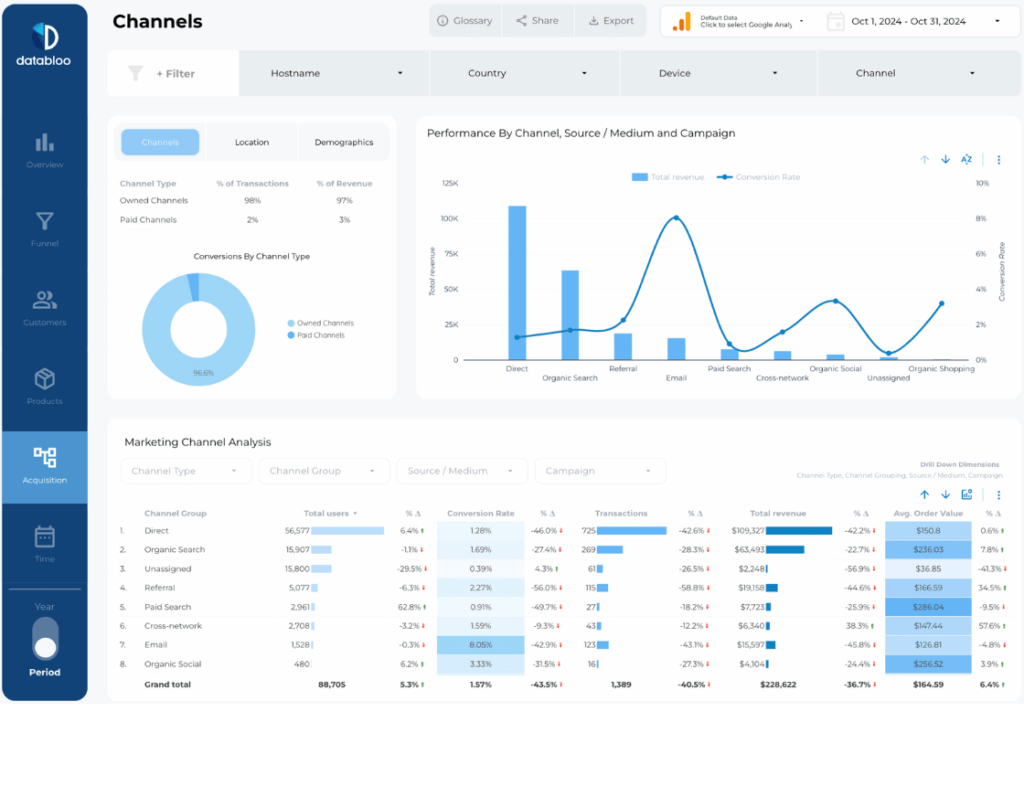
- 5. Traffic Source Effectiveness
Traffic source effectiveness is calculated by tracking the number of visitors and conversions from each traffic source.
Use this ecommerce KPI to quickly analyze the percentage of traffic from each source that converts into sales or desired actions.
Traffic source data on your ecommerce dashboard will help you determine which channels are most effective at driving valuable traffic. Using this data, you can invest more in sources with higher conversion rates to maximize ROI and scale down campaigns from low-performing sources.
- 6. Total Sales
Total sales are the sum of all transactions completed within a specific timeframe.
Total sales metric a direct indicator of the ecommerce business’s performance and market demand.
Analyzing totals sales helps you better understand seasonality of your products or global sales trends that more specific reports can’t display.
When including sales data on your ecommerce dashboard make sure it’s easy to switch between various periods of time and combine totals sales with more granular reports such as revenue by country or product for quick in-depth analysis of market dynamics.
Quick switching between weekly and quarterly reports help you better understand whether market shifts are seasonal or long-term.
- 7. Gross Margin
Gross margin is calculated by subtracting the cost of goods sold from total sales revenue and then dividing by total sales revenue.
This KPI reflects profitability before operating expenses, indicating product pricing and cost control efficiency.
Improve gross margin by optimizing supplier costs and product pricing strategies.
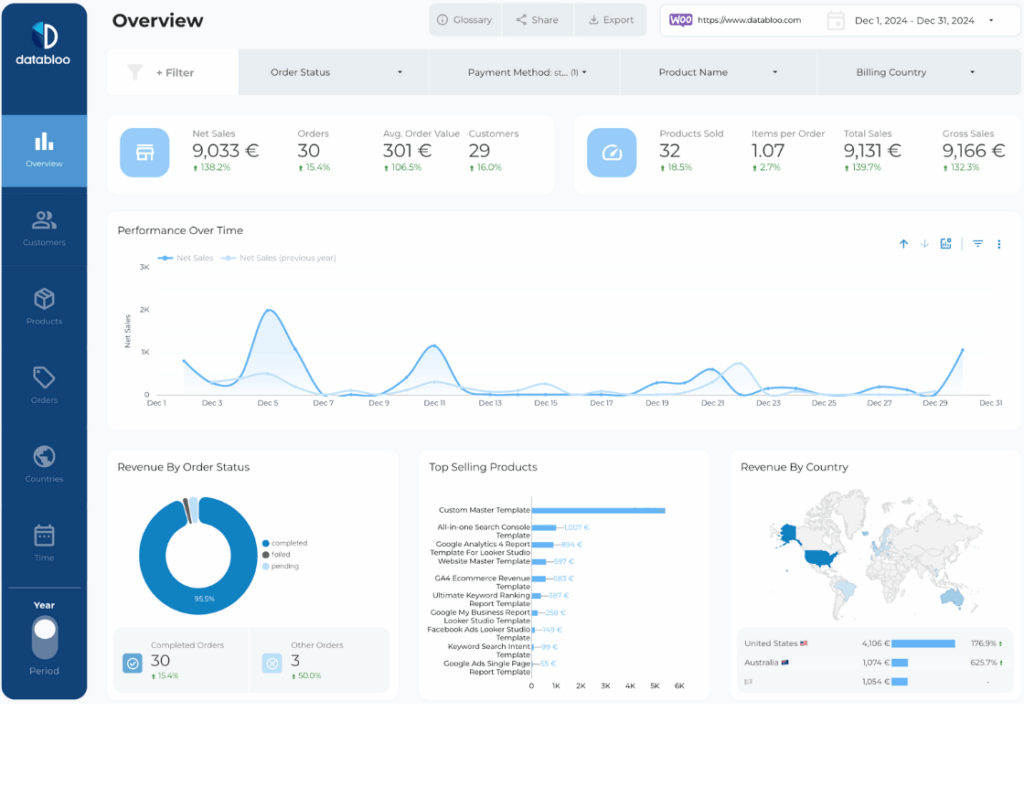
For more detailed breakdown, you can use a specific revenue dashboard focused on gross and net sales in a given period as shown in the WooCommerce dashboard.
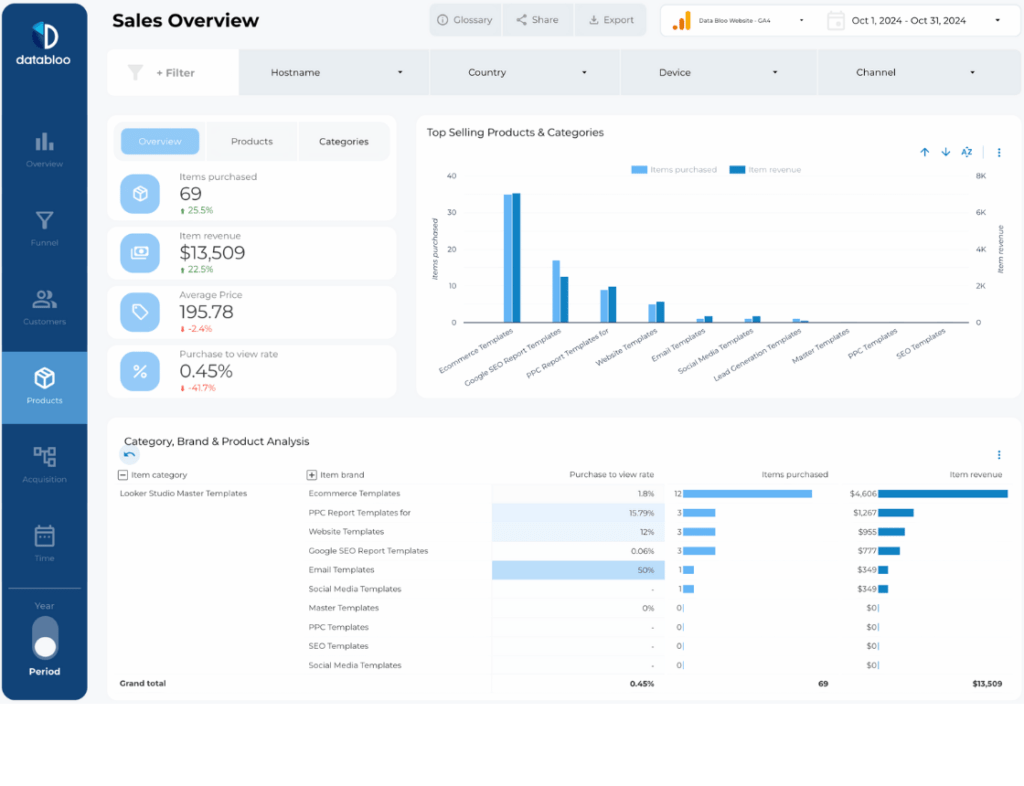
- 8. Average Order Value (AOV)
Average Order Value (AOV) is calculated by dividing total revenue by the number of orders.
AOV provides insights into customer purchasing behavior and pricing strategy effectiveness.
Boost AOV with upselling and cross-selling strategies, and use an ecommerce dashboard to quickly analyze the efficiency of your strategies over various periods of time. Spot correlations with other KPIs such as traffic sources or audience engagement metrics for in-depth insights.
- 9. Revenue By Country
To display revenue by country, segment total revenue by the geographical location of customers.
Understanding revenue distribution helps tailor marketing and expansion strategies into new markets. If you have detailed buyer personas for different countries, you can use revenue by country metrics to improve your targeting or scale up operations in the most successful geographies.
Revenue by country correlates with several ecommerce metrics such as customer lifetime value, cost per acquisitions, and conversion rate. By customizing customer experience you can notice simultaneous improvement across all mentioned KPIs at once.
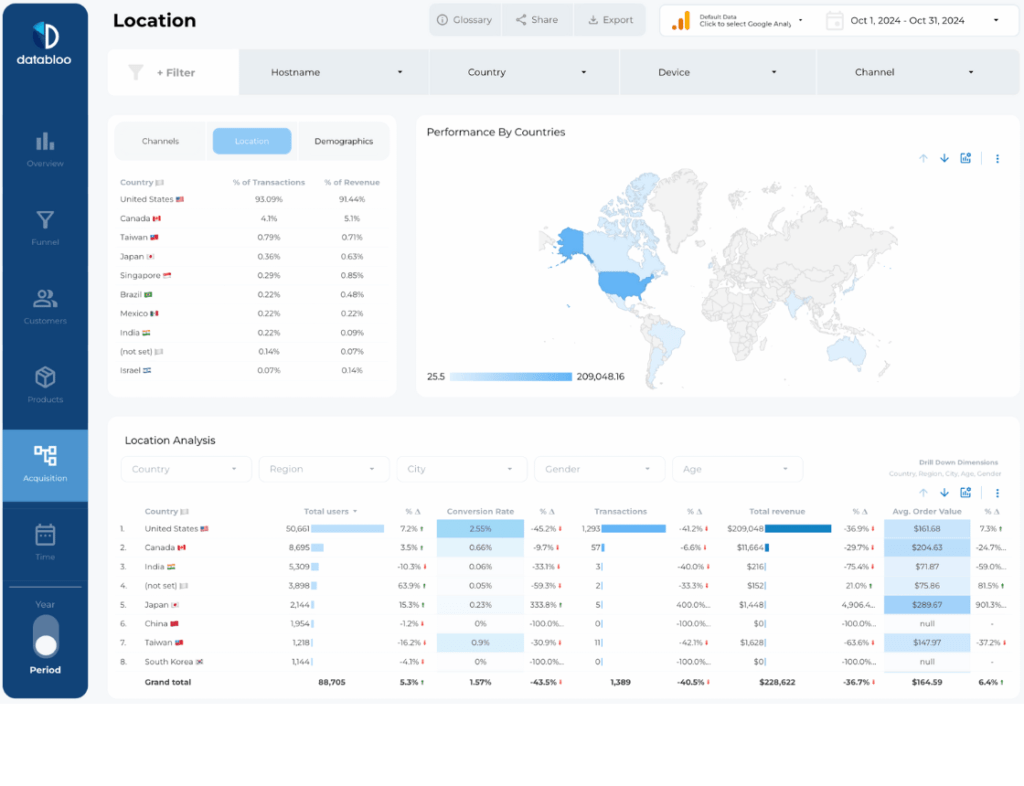
Often specific products convert better in certain geographies, so make sure your ecommerce dashboard displays the connection for better insights.
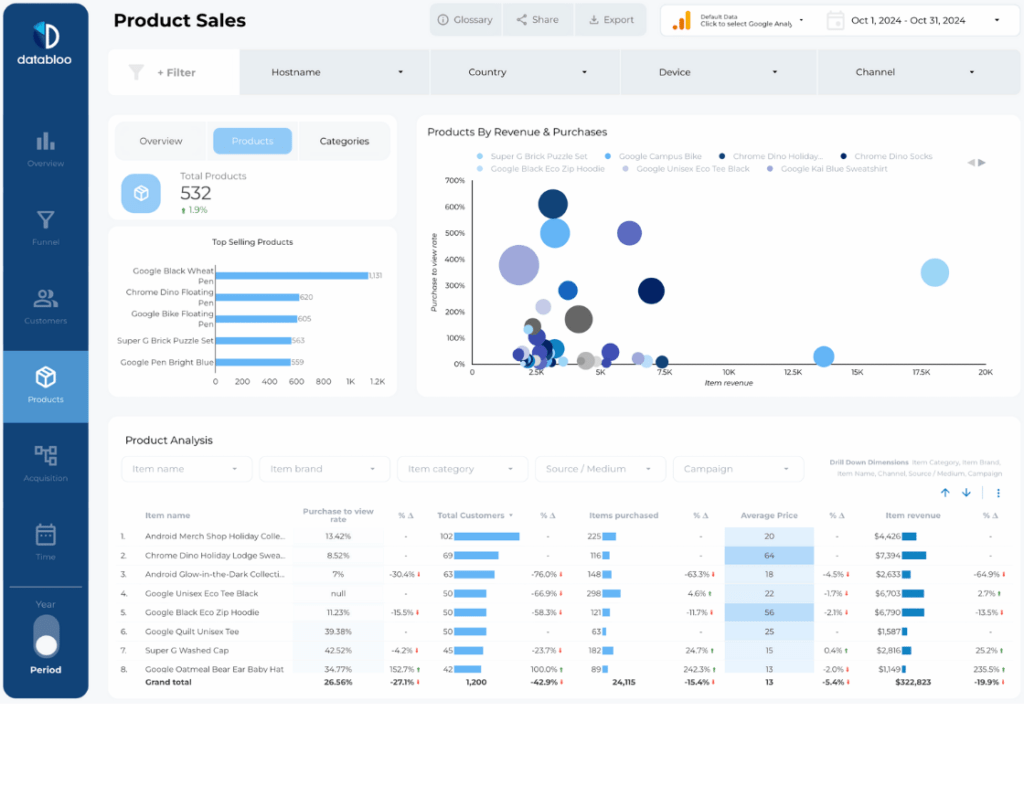
- 10. Revenue By Device
Track revenue generated from users on different devices, such as mobiles, tablets, and desktops.
Revenue by device KPI informs device-specific optimization for improved user experience and sales.
Current generation of users is mobile first, but that’s not always the case. Understanding what devices your users are using will help you understand whether your advertising campaigns should be targeting mobile or desktop users, and also analyze conversion behavior in different use scenarios.
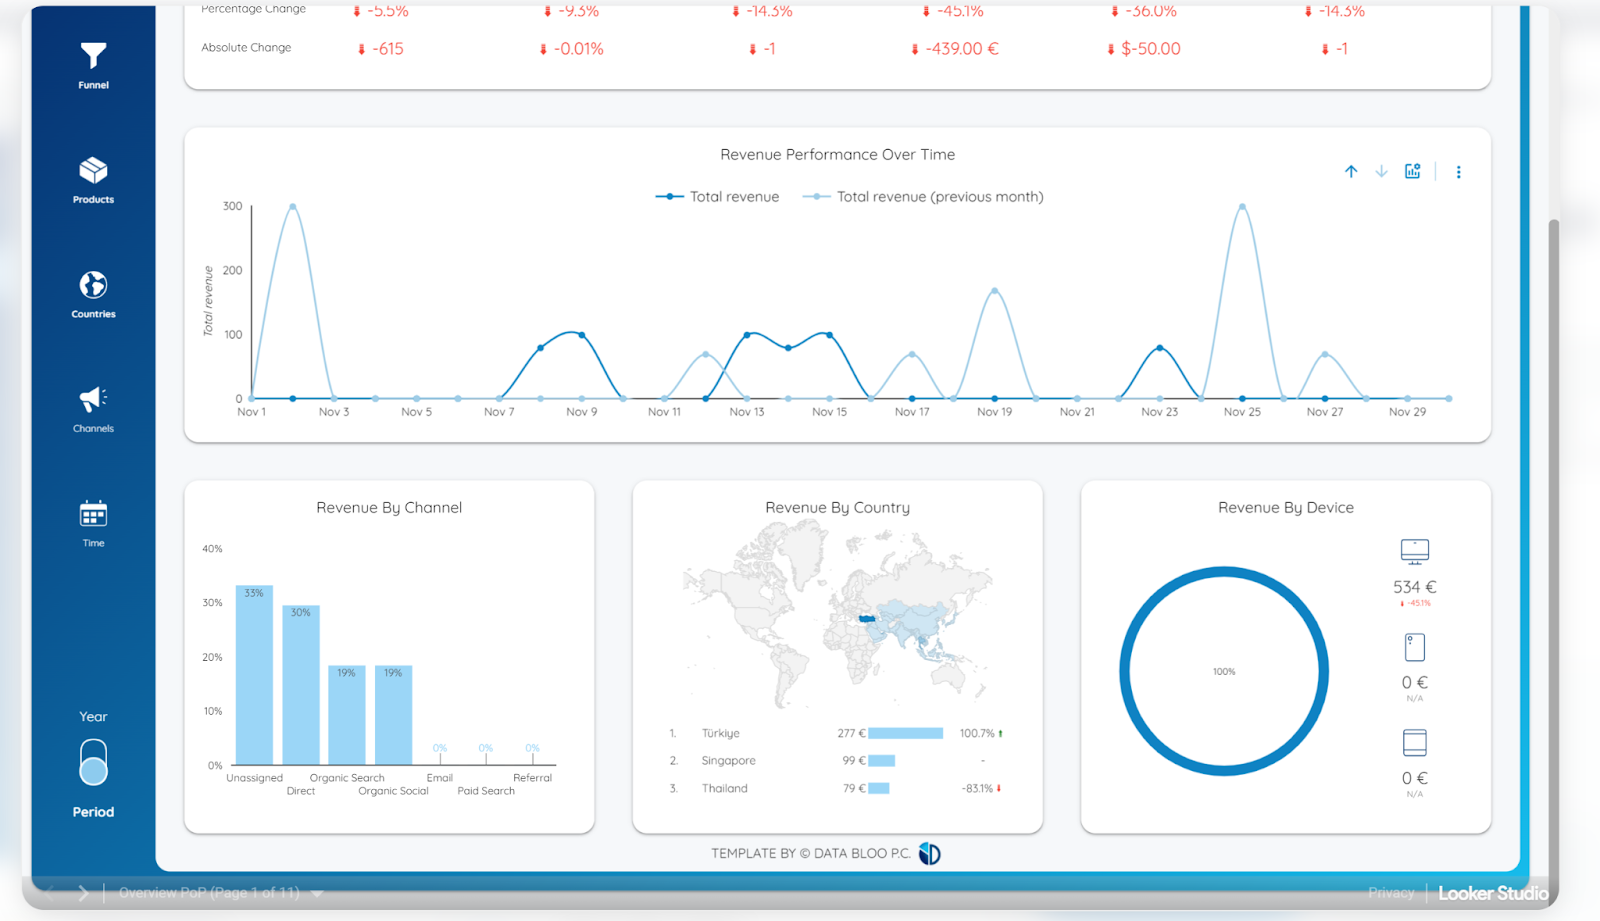
As you can see on the screenshot above, this product is bought exclusively by desktop users, which might inform you to scale up all desktop advertising campaigns.
Additional Ecommerce KPI
These ecommerce KPIs are not necessary, but can be included in your ecommerce dashboards in specific scenarios for additional insights.
- Bounce Rate. Number of single-page visits divided by the total number of website visits, multiplied by 100. Bounce rate indicates the percentage of visitors who leave the site after viewing only one page. Compare bounce rate of your best performing pages and worst performing pages to find issues with your ad targeting, or user experience.
- Page Load Time. Typically measured using website analytics tools. It’s the average time taken for pages on a website to fully display content to visitors. While page load time might be considered a less important metric, ecommerce websites with thousands of pages should really focus on delivering fast loading pages to reduce cart abandonment rates and increase page conversions.
Tip: Consider combining an ecommerce dashboard with an SEO reporting if your marketing strategy relies a lot on organic traffic from Google and other search engines. By combining data about your top organic pages, local SEO searches, and best selling products, you can spot interesting trends in user behavior, such as increased demand for certain products in certain locales and so on.
The success in e-commerce hinges on identifying and focusing on the most impactful KPIs. This article has highlighted the difference between essential and less significant metrics for your ecommerce dashboards.
Concentrating on KPIs that directly affect revenue and customer engagement is crucial for informed decision-making and sustainable growth.