Table of Contents
Did you know that between 30 and 50 million websites across the web use Google Analytics? Analytics tools are a great way to monitor your website’s engagement. And with Google Analytics 4, it’s much easier for eCommerce professionals and marketers to gather all the essential data they need.
While you might already have GA3, GA4 comes with many new features that make it easier to gather and understand your engagement rate and data.
But how does GA4 calculate its engagement rate? Keep reading to learn all about engagement rate in Google Analytics 4.
A Brief History of Engagement Rate
Engagement metrics have always played an important role in web traffic analysis. But before engagement rate, came Bounce Rate.
Bounce rate was first introduced in Universal Analytics, to help people understand how visitors act on web pages or apps. Bounce rate recorded the number of people who left a webpage without making any meaningful interaction. These interactions included making any clicks, filling out a form, or viewing another page.
While all this data was meaningful, GA4 made a major shift, with the introduction of Engagement Rate.
We’ll get into the specifics of the engagement rate later on. But one thing you need to understand is that GA4 aims to give people meaningful, insightful data, which Bounce Rate seemingly lacked.
However, this metric has been sorely missed. And because GA4 is flexible to fit the ever-changing nature of the internet, Google recently re-introduced its new version of Bounce rate (bounce rate in GA4).
Now, with both Bounce Rate and Engagement Rate, you and your marketing team get an even better, clearer picture of your overall engagement.
What is the Engagement Rate in Google Analytics 4?
So GA4 is a must-have. Sure. But what exactly is the engagement rate in Google Analytics 4?
Engagement rate ultimately gives you important information about the quality of the visits to your website. This rate shows you how long visitors stay on and if they interact with your page or app.
While engagement rate is probably the most important, there are several other engagement metrics. Altogether, these metrics give you a full picture of your website’s or app’s engagement and reach.
How is the Engagement Rate Calculated in GA4?
You’re probably wondering how this seemingly vital metric is calculated. While GA4 works it out for you, for those who are curious, the equation is rather simple:
Engagement Rate = (Engaged Sessions / Total Sessions) * 100%While this is an easy equation, it raises a few more questions, like what is an engaged session? Luckily this is rather easy to answer.
An engaged session is any session where a visitor or user does any of these:
- Stayed on the page for 10 seconds or more (you can easily change the time under the admin section)
- Viewed at least 2 pages
- Triggered at least 1 conversion event
If any of the above is done by a visitor, their visit is considered to have been an engaged one.
Now you’re probably left with one more question – is this data that important?
As mentioned, this data doesn’t just allow you to see how engaging your website is.
Bounce Rate vs Engagement Rate?
While they seem very similar, there are several differences between the two.
The biggest difference between Bounce Rate and Engagement Rate is the data that they show. Both show you when users visit your site, but that’s where their similarities end.
Engagement Rate is far more in-depth than Bounce Rate, giving you a clearer picture of your analytics and how well your website is doing. Bounce Rate used to include anyone who visited your website or app, no matter how long they stayed on it. It also didn’t indicate whether or not these visitors were interacting with your app or webpage.
Bounce Rate in GA4, though, is slightly different. It acts as the inverse of the Engagement Rate, showcasing the percentage of sessions that weren’t engaged sessions.
Bounce Rate = 1 - Engagement RateWhat are the Engagement Metrics?
As mentioned, GA4 shows you several other important engagement metrics.
They are:
- Engaged Sessions – discussed previously in the article
- Engaged Sessions Per User – the number of engaged sessions / by the total users on the website or app
- Engagement Time – the total engagement time on the website or mobile apps
Engagement time in Google Analytics 4 is vital. It details where a user goes when exploring your website. But you should note that this time may vary depending on your website and business.
Where to Find the Engagement Rate
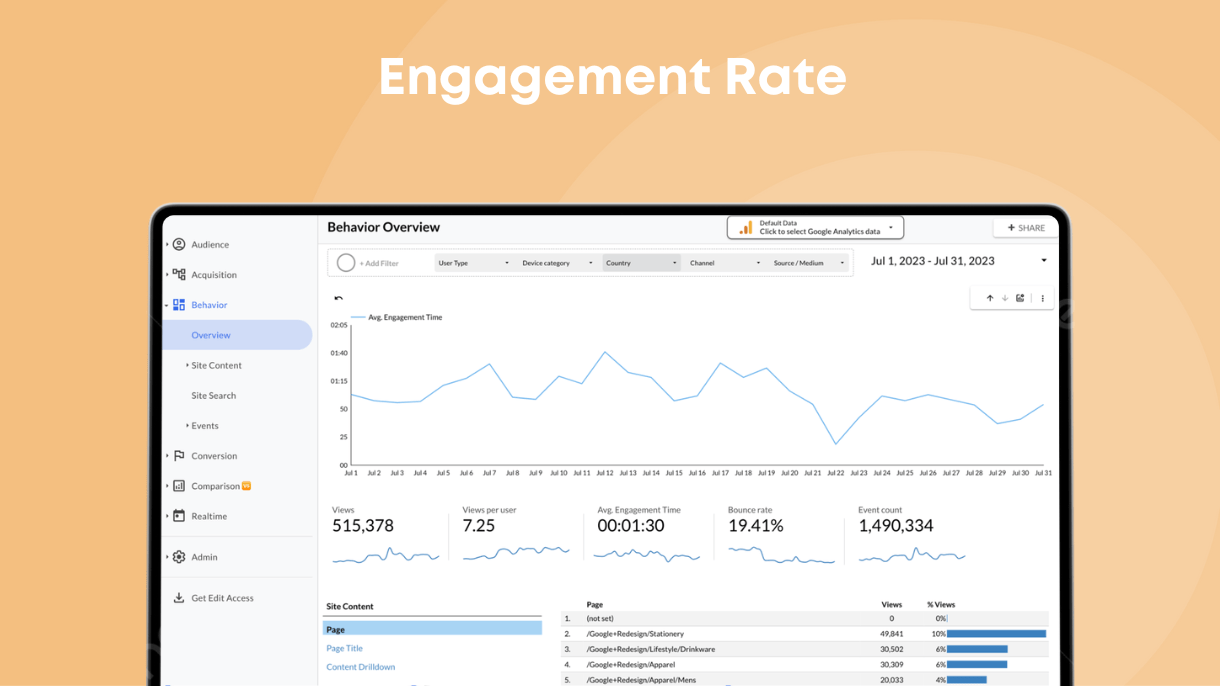
Luckily, accessing this data is easy in GA4. All you have to do is head over to Reports on the left-hand side of the page. From there, click on Acquisition, followed by view user acquisition.
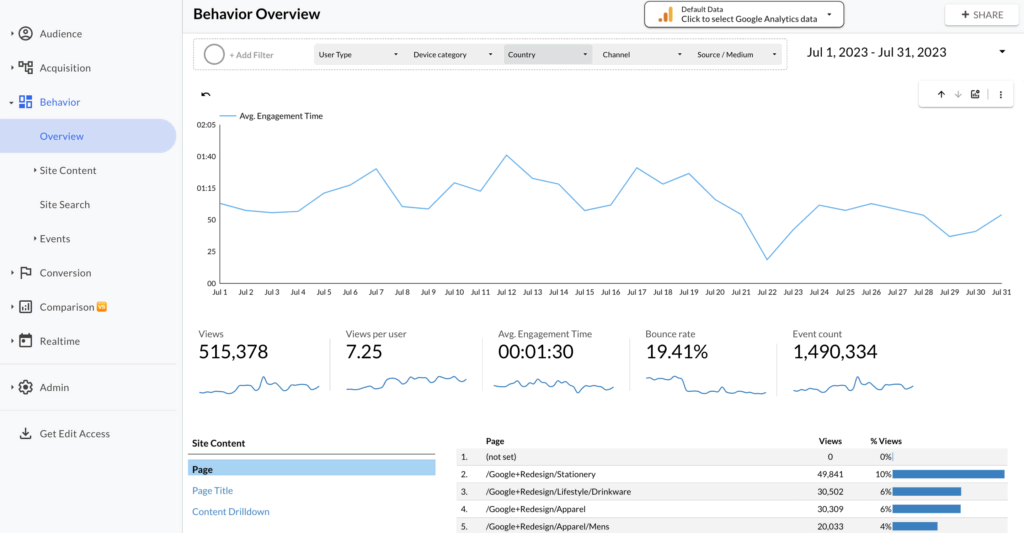
Now you’ll be able to see your engagement rate and all your other engagement data. GA4 shows all your analytics in various ways, including graphs and table sets.
Apart from the GA4 data, you can also use Analytics4now. It helps you get the most out of GA4. Analytics4now is an easy-to-use Looker Studio report that combines your GA4 data with the Universal Analytics interface, showcasing in-depth analysis of your audience, acquisition, behavior, conversion, and comparison reports.
How to Use the Engagement Rate
The engagement rate data is particularly useful when setting up your customer segments to see how people are arriving at your site. Essentially, the engagement rate in Google Analytics 4 helps you determine the top acquisition channels for your visitors and how this traffic engages with your app or website. For instance, you can easily check if a specific marketing campaign delivers higher quality traffic vs. your organic content. With all this data, you and your marketing team can focus on the best-performing marketing sources. Further, the engagement and bounce rates give you an insight into the quality of your website’s or app’s content.
Engage, Engage, Engage
Engaging users is extremely important. And with GA4’s Engagement Rate, it’s much easier to see how to better engage with users of your website or app. Engagement rate in Google Analytics 4 also gives you a true insight into how well your various marketing campaigns can be for you.
Now that you know all about Engagement Rate, it’s time to start using it to properly engage with your audience.
Are you a GA4 user? Then head over to our website to check out our website to view our easy-to-read Looker Studio Templates.