Table of Contents
WooCommerce analytics is a powerful reporting module built into the WooCommerce WordPress plugin.
It lets you make smarter, data-driven decisions about your e-commerce store by presenting store performance data and other valuable e-commerce metrics in intuitive, easy-to-read reports.
However, there are many sections and settings in WooCommerce analytics that can be overwhelming at first.
Lastly, albeit the versatile, WooCommerce Analytics module has its limits and shortcomings, and we will discuss how to work around them.
Tune in!
What Is WooCommerce Analytics?
WooCommerce Analytics is a built-in collection of reports, dashboard, and boards that display data about your online store performance.
The data varies from basic and primary metrics such as sales, revenue, orders, to more advanced and granular data such as average order value over a given period or items sold in specific countries.
WooCommerce Analytics module is versatile and can be used for different purposes, whether you want a quick overview of your store performance or deep dive into the customer behavior.
Key Sections Of WooCommerce Analytics
WooCommerce Analytics module consists of Overview report and nine (9) additional, more specific reports that display different aspects of e-commerce performance.
Overview Report
When you first open WooCommerce analytics, Overview is the default report, the first one you see entering a WooCommerce console.
As such, it is designed to provide primary data about your store performance using three types of data visualization:
Performance
Displays primary performance data such as Total Sales, Net Sales, Orders, Products sold, and more.
Tip: you can display additional metrics in the Performance section of an Overview report by clicking the three-dotted menu in the right upper corner of the section. Here you can enable or disable displaying metrics such as Returns, Net Sales, Gross Sales, and so on.
Charts
Chars is the section of Overview reports immediately following the Performance section.
It contains data in a visually intuitive way that helps you analyze and spot sales trends over periods of time.
It can also be customized to display charts most useful to your store or hide the ones you don’t need.
Examples of available Charts include: Total sales, Net sales, Orders, Returns, Discounted orders, Average order value, and Items sold.
Leaderboards
Leaderboards is the final section of the Overview reports.
It is designed to provide quick insight into Top performing areas of your stop, such as:
- Top Customers by Total Spend
- Top Coupons by Number of Orders
- Top Categories by Items Sold
- Top Products by Items Sold
——————————————————————————————————————————-
There are 9 more reports that are included in the WooCommerce analytics module. Let’s briefly cover each:
- Products
- Revenue
- Orders
- Variations
- Categories
- Coupons
- Taxes
- Downloads
- Stock
Products Report
Products report provides performance data for individual products in your store with metrics such as sales volume, net revenue, and number of items sold.
Tip: Use Comparison Mode in this report to compare against each other top selling products within the same category to drive marketing insights and inventory decisions.
Revenue Report
Revenue report provides in-depth insights into the revenue composition of your store.
Tip: Make full use of built-in Data Range and Filters settings to analyze your revenue not only compositionally, but historically.
Orders Report
Orders report provides data about your store’s orders and their statuses.
Tip: Use Advanced filters to focus on clusters of orders with the specific status, number of refunds, type of customers.
Variations Report
Variation report is useful for stores that sell multiple variations of products and want in-depth analysis.
Tip: use Compare Mode similar as with Products to compare performance of multiple variations over specific periods of time (e.g. during a seasonal sale, a PR marketing campaign, etc)
Categories Reports
Categories report offers a deeper dive into the categories performance of your store.
Tip: Use the built-in Sort functionality to sort out categories by the number of Items Sold or Net Sales, creating a leaderboard-like graph.
Coupons Report
Loads all coupons for the selected data range.
Taxes Report
Provides data into taxes collected on your store.
Download Report
This report helps you understand the performance of your downloadable products such as, marketing materials, instructions, product specifications etc.
Stock Report
The inventory appraisal of your store, this report is available for stores with stock management features enabled.
Key Metrics Shown In WooCommerce Analytics
The same metrics are shown in different WooCommerce Analytics reports, so it’s especially useful to understand how they are calculated by WooCommerce.
Below are most used, grouped for convenience:
Total sales: Gross Sales – Returns – Coupons + Taxes + Shipping
Gross Sales: Sale price of product(s) multiplied by quantity ordered. Does not include refunds, coupons, taxes, or shipping
Net sales: Gross Sales – Returns – Coupons
Orders: The number of new orders placed for a selected date range
Average order value: Net Sales / Orders
Products sold: The discrete number of items sold.
Items sold: The discrete number of items sold
Refunds: Money returned to the customer via a refund
Discounted orders: The count of orders with a coupon applied.
Gross discounted: Total sum of discounts from coupons.
Net discount amount: Total sum of discounts from coupons.
Total tax: Order Tax + Shipping Tax
Order tax: The total of tax applied to items in an order
Shipping tax: The total of tax applied to shipping in an order
Shipping: The shipping charges associated with an order or refund.
Downloads: Total count of downloaded files
How to Set Up WooCommerce Analytics
You don’t need to set up the WooCommerce Analytics module separately, it’s available as soon as you install a WooCommerce WordPress Plugin 4.0 or higher version.
If you are using an older version of a WooCommerce plugin, you are likely to see the now deprecated version of Reports.
You can update WooCommerce plugins through the dashboard, but make sure to create a backup version of your site in case installation has errors.
You can access all settings via the Settings tab under Analytics for WooCommerce Analytics module.
Optional. If you have any further issues, you can separately install WooCommerce Admin plugin
for debugging and tuning your WooCommerce plugin.
If you want to install 3rd party plugins for WooCommerce Reporting, please refer to our article Ultimate Guide To WooCommerce Reporting
Limitations Of WooCommerce Analytics
Can’t Combine Data From Different Reports
With WooCommerce analytics module, you’re mostly confined to viewing one report at a time. You can’t easily combine data across reports (e.g., linking product performance to coupon usage or customer lifetime value).
To do that, use third party tools such as Databloo (will be covered in more detail below)
No Customer Behavior Data or Advanced Segmentation
WooCommerce Analytics lacks native features to segment customers by behavior, demographics, or lifecycle stage (e.g., first-time buyers vs. repeat customers).
To achieve that, integrate WooCommerce Analytics with Google Analytics or 3rd party customer tracking solutions.
No Funnel or Conversion Tracking
WooCommerce Analytics tells you what happened (e.g., orders placed), but not how users got there or where they dropped off in the purchase funnel.
Solution: Pair WooCommerce with Google Analytics tracking.
Limited Customization of Reports
While you can use filters and sorting features to control what you see in WooCommerce Reports, there’s not much customization beyond that.
This becomes especially crucial if you’re presenting reports to stakeholders, clients, or want to focus on specific performance metrics in detail.
To fix that, you can use 3rd party data reporting solution such as Databloo (comes with free-to-use WooCommerce connector)
What To Pair WooCommerce Analytics With?
WooCommerce Analytics gives you a solid foundation for analytics and reporting — but for deeper insights, pairing it with external tools can unlock powerful customer behavior data and full-funnel visibility.
You can either enrich your data using customer behavior platforms or export WooCommerce data into advanced reporting tools to present it in new, more insightful and useful ways.
Google Analytics (GA4)
Google Analytics allows you to track the full customer journey — from landing on your site to completing a purchase. It fills in the behavioral gaps that WooCommerce Analytics doesn’t cover, such as bounce rate, session time, referral source, and funnel drop-offs. You’ll also get access to multi-channel attribution, ecommerce conversion tracking, and real-time data.
How to integrate WooCommerce with Google Analytics:
- Install a plugin like MonsterInsights or WooCommerce Google Analytics Pro to set up enhanced eCommerce tracking without coding.
- Connect your GA4 Measurement ID in the plugin settings and enable eCommerce tracking in your Google Analytics account.
- Test your setup using Google’s Tag Assistant or real-time reports to ensure data is flowing correctly.
Meta Pixel or Hotjar
Pairing WooCommerce Analytics with tools like MetaPixel or Hotjar gives you a much richer view of how users behave and convert.
Meta Pixel helps track ad performance and retarget visitors based on actions like adding to cart or starting checkout, facilitating smarter ad spend and more advanced audience segmentation.
Meanwhile, Hotjar gives you heatmaps, scroll maps, and session recordings and lets you see more in-depth how users interact with your store. For example you can identify friction points on product pages or checkout flows – something a basic sales report can’t show on its own.
For detailed instructions on connecting Meta Pixel and WooCommerce, refer to the official documentation.
Databloo
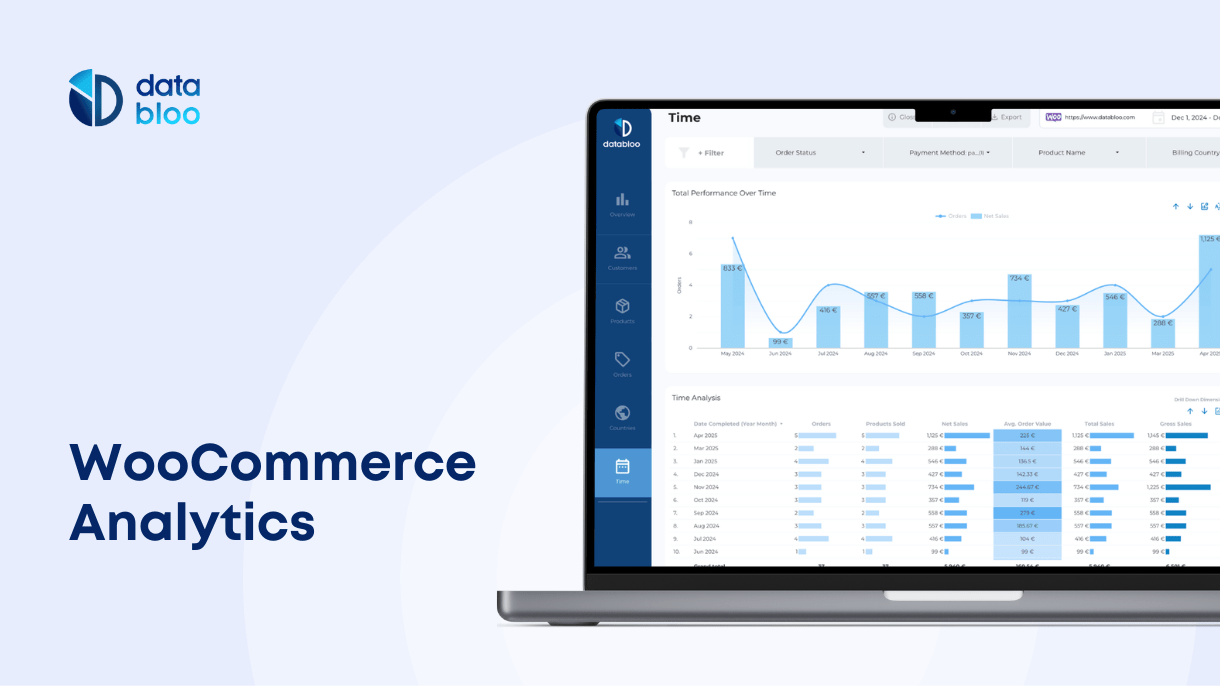
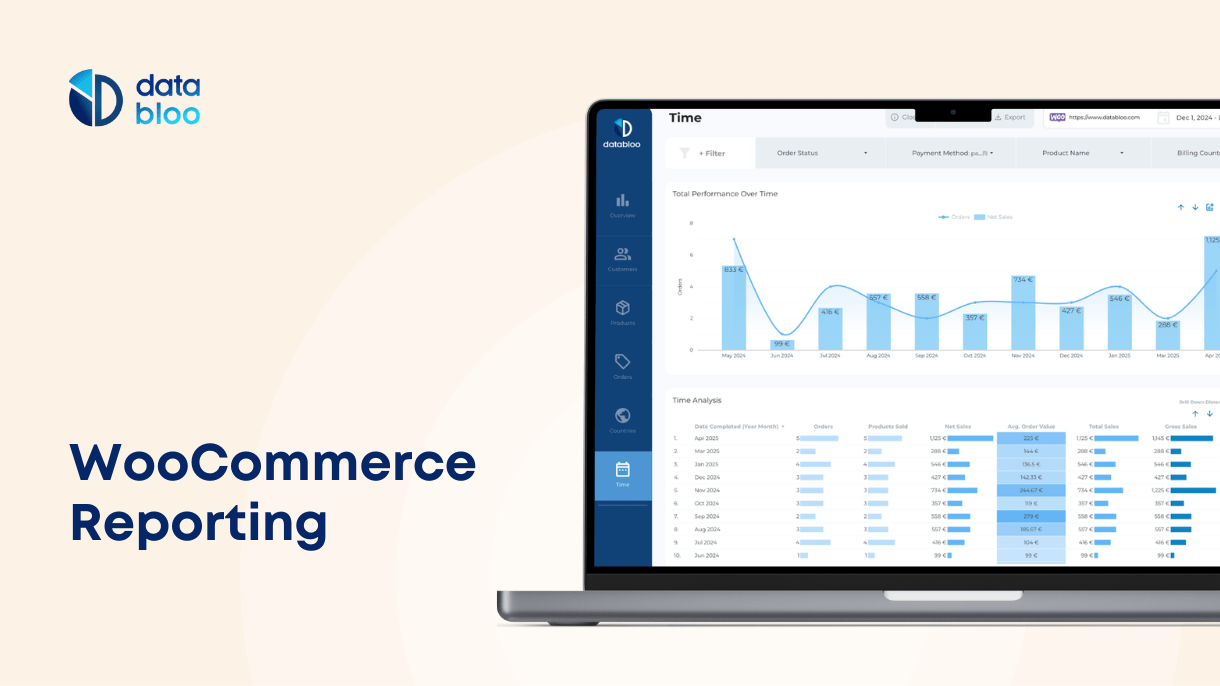
Databloo is a great reporting solution to solve bottlenecks and limitations WooCommerce Analytics have.
To start, simply connect your WooCommerce account to the Databloo template, and it will be automatically filled with your performance data in real-time.
Unlike default WooCommerce Analytics reports, Databloo reports are completely customizable: you can rearrange fields, add graphs, or even add white labeling elements to your reports, such as logo or fonts, if required.
Here are just a fraction of the questions Databloo’s WooCommerce Reports can cover:
- How is my WooCommerce store performing over time?
- What are my total sales, refunds, and returns?
- Which products and categories are driving the most revenue?
- Who are my top customers and what is their average order value?
- Are discounts and coupons increasing or reducing revenue?
- What countries, states, and cities are most profitable?
- How do payment methods like cards vs PayPal affect total sales?
- What is the overall performance over the last 12 months?
- When do people buy the most during the month or week?
- What is my monthly sales trend?
You can try Databloo for completely free with no string attached: access fully free WooCommerce Databloo demo here.
Important:
Databloo WooCommerce Report comes with a free WooCommerce Looker Studio connector for populating your reports with data automatically and in real-time.
You can learn more about the connector and how to quickly set it up here.
The connector supports 36 fields, letting you explore complete WooCommerce data about orders, sales, discounts, and everything else.
Unlike with other solutions, you don’t need to pay a dime for the connector – it comes as part of the Databloo template and is always updated to ensure smooth work.


