Table of Contents
Users in the modern digital world generate about 3.5 quintillion bytes of data every day. But data itself isn’t useful unless we sort it out to derive meaningful insights. The insights are usually in the form of a dashboard or a more complex report.
Business intelligence (BI) tools are gaining popularity as the go-to tools that help convert raw data into information. Google Looker Studio is a good example of a BI tool. It can connect to data from multiple sources like BigQuery. The BigQuery Looker Studio connection makes it easier to convert data into high-quality reports with raw-level data.
In this guide, we discuss how to connect Bigquery to Looker Studio for efficient data analysis. Let’s get into the details below.
Connecting Looker Studio to BigQuery
Looker Studio can connect to a single BigQuery view or table through a BigQuery connector. To connect BigQuery to Looker Studio, proceed as follows:
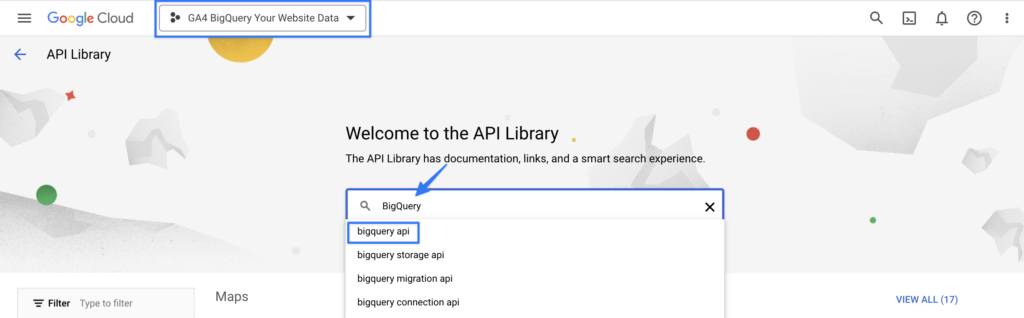
- Set up a BigQuery project. If you haven’t done it already, create a project in Google Cloud Console, and then enable the BigQuery API for your project. In case you need more details on how to complete this process, we have created a step-by-step guide for GA4 connection with BigQuery.
- Sign in to Looker Studio. Click Create in the top left and then Select the Report option. The report editor will appear and the report panel that allows you to add data will open. Alternatively, you can open an existing report and click “Add data” on the top menu.
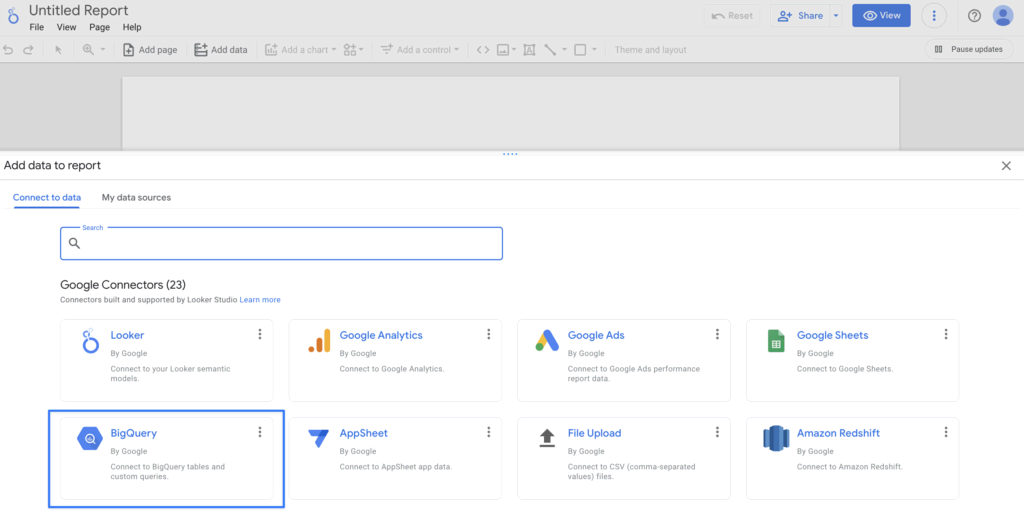
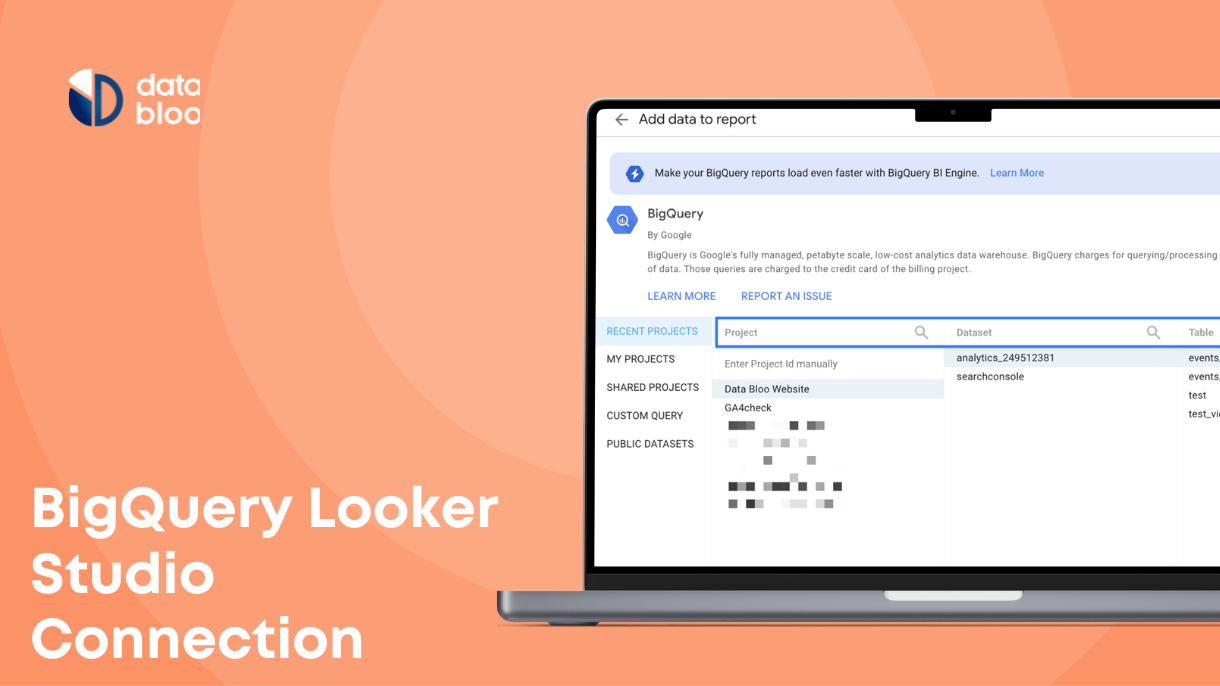
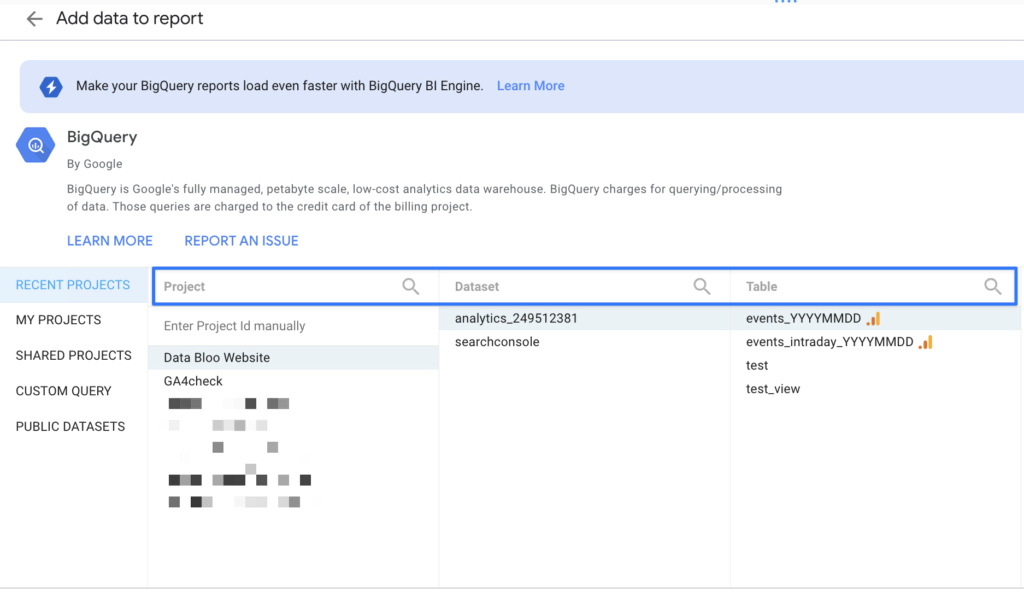
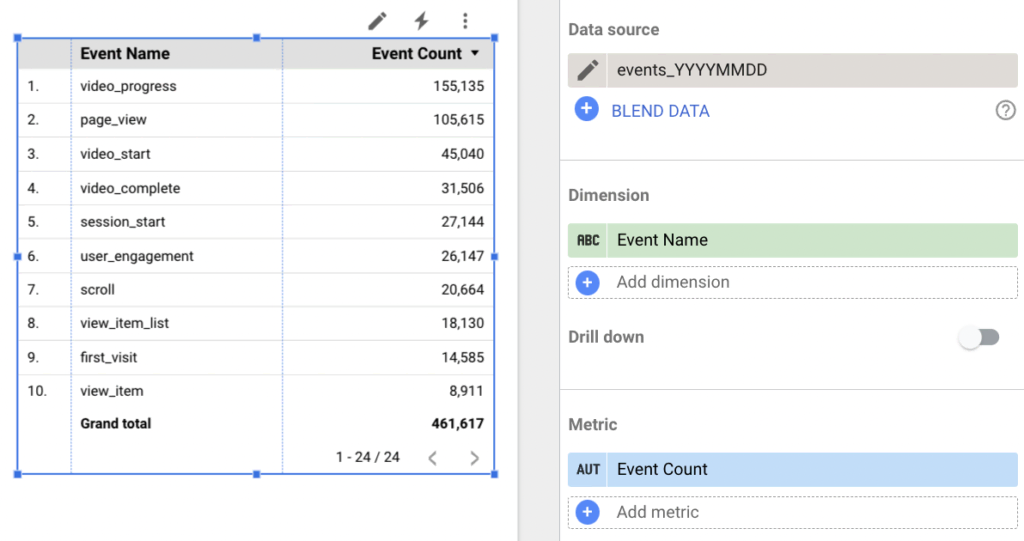
- Click on the BigQuery connector to create a new data source. Select the BigQuery Project that you have already created, then choose the right dataset and the table for your data.
- After a few seconds, you will see a table appearing on the report canvas. The table will contain fields from the chosen data source. To change the style and data of the table, turn to the properties panel (on the right side of the canvas). The toolbar above the canvas can help you choose from a variety of Looker Studio charts.
Options for the BigQuery Connection
Three different options are at your disposal when you want to select a project. These options include:
- Projects: Recent Projects, My Projects, and Shared Projects
- Custom Query
- Public Datasets
Projects
As mentioned above, to configure the BigQuery connection, you could select a project first. Through projects, it’s easier to organize BigQuery resources and get the right billing if the reports go beyond BigQuery’s free quotas.
You can set one project aside for the data as you bill another project or use the same project for both data management and billing.
Use the Recent Projects option to locate a project you recently accessed in your Google Cloud console. The My Projects option will come in handy if you want to choose a project that you have access. Under the Shared Projects option, you will find a project that someone else has shared with you.
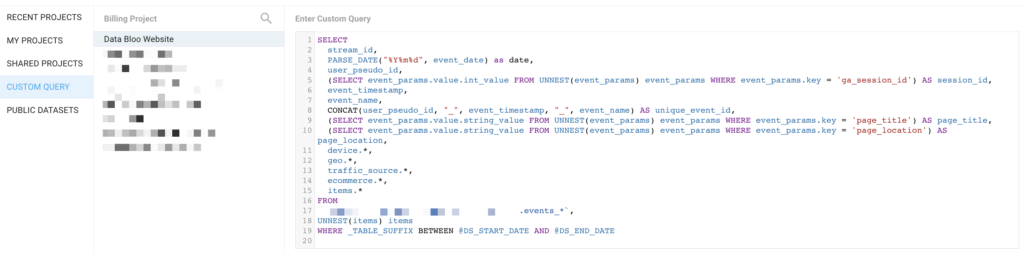
Custom Query
This option allows you to easily query and analyze data from multiple projects within BigQuery, providing you with a versatile and powerful way to retrieve and manipulate your data. Make sure to specify a billing project while creating a custom query. For instance, below you will find a quick way to pull the GA4 item level data in order to create some familiar e-commerce reports.
Public Datasets
In case you haven’t created a project yet, and you want to visualize BigQuery data on Looker Studio, then you can play around with the available datasets. Public datasets comprise public samples (with shared datasets) that BigQuery offers.
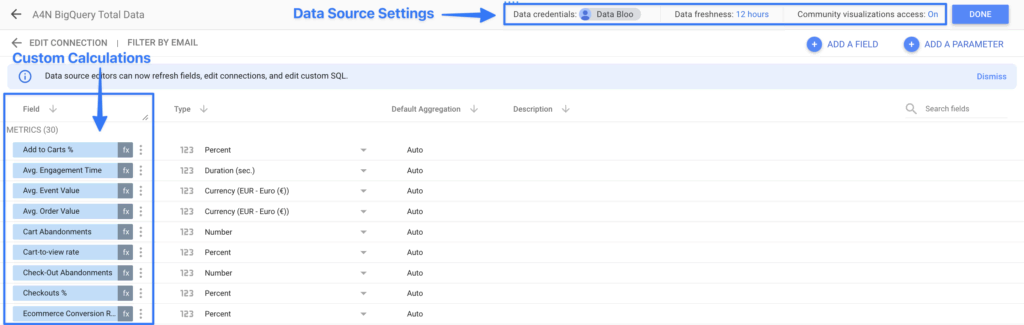
Editing the BigQuery Data Source
By editing the data source, you get to control how often the data can refresh and who can view it. Doing this also allows you to add calculated parameters and fields to the data source.
To edit your report’s data sources, go to the edit mode, then from the main menu select Resource > Manage added data source > Edit data source. Find the data source from the list and click “Edit” (right), then Looker Studio will show up the scheme of the BigQuery data source as shown below. You can easily create calculated fields based on the existing dimensions and metrics of that source.
Visualizing BigQuery Data in Google Looker Studio
Once you establish a Google Looker Studio BigQuery connection (i.e., connect to the data source), create an interactive visualization that can help in your analysis. Doing this in Looker Studio with BigQuery data is quite easy, as you can treat it like any other data source.
To create the visualizations, drag and drop the variables in the setup panel. Here’s an example of interactive visualization in Looker Studio with the steps for executing it:
- Under the chart pane, click the bar chart command. And then, drop the fields from the data source in the dimension and metric portion.
- Add a control by clicking the Add a Control command. Doing this will allow users to filter the report. Remember to include the filters that users will use when scanning the report.
- To style the report, click on the filter or graph and then click on the style pane. Under the style pane, you will find commands for changing the font size and color, among other things. Styling can help make Google Data Studio reports more visually appealing.
Using Analytics4now to Analyze BigQuery Data
For marketers without SQL knowledge or the help of a data engineer, it’s quite difficult to configure data on BigQuery. The process will require you to write queries to extract metrics and dimensions. You will also have to configure the parameters for data queries, such as the filtering parameters, data fields, and time range.
Luckily, through a ready-to-use solution like Analytics4Now, you can easily configure the data. Analytics4Now is built on Looker Studio and relies on GA4 integration with BigQuery to create the familiar report of Universal Analytics.
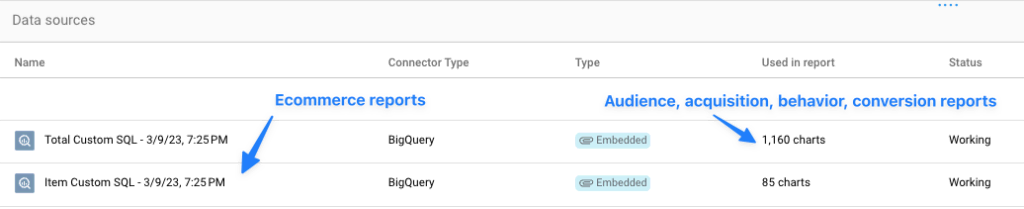
By using our custom queries of Analytics4now, you can utilize the BigQuery connection to process data faster. It can also help you gain valuable insights into customer behavior and website analytics.
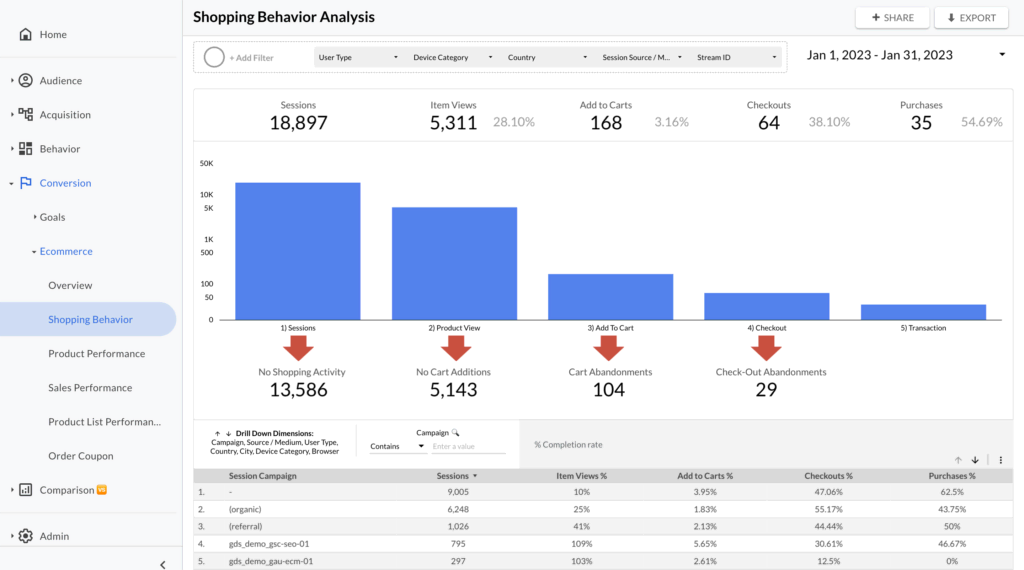
Even more, the report will draw from the views of Universal Analytics, like behavior, acquisition, conversion, and audience, with the data. This way, it will help a business analyst make informed decisions to improve a marketing strategy and attain certain business goals.
Upgrade Your Digital Reporting with Bigquery Looker Studio
A business intelligence tool like Looker Studio can help you make data-driven decisions when you are running out of time. You can also use it to visualize BigQuery data for clearer and more concise interpretations. To get there, you will have to make a BigQuery Looker Studio connection.
Turn to Data Bloo for aesthetically pleasing and interactive templates to make the most out of your data. Our solutions, including Analytics4Now, can have a real impact on the performance of your business. Send us a message today if you have a dashboard in mind.