Table of Contents
Currently, the world produces roughly 2.5 quintillion bytes of data daily. Can you imagine what that amount of data would look like? Neither can we. Fortunately, tools have been developed to help us sort and categorize raw data automatically
In 2016, Google launched Looker Studio to transform your raw data into easily-accessible and informative dashboards and to create reports. Looker Studio filters your data utilizing different ways you can sort through data sources to show or hide certain information.
We can help you organize your data for optimal insights. Keep reading to learn more about how Looker Studio filters work.
How Do Filters Work in Looker Studio?
Google Looker Studio converts data into reports and charts that can be customized using different settings.
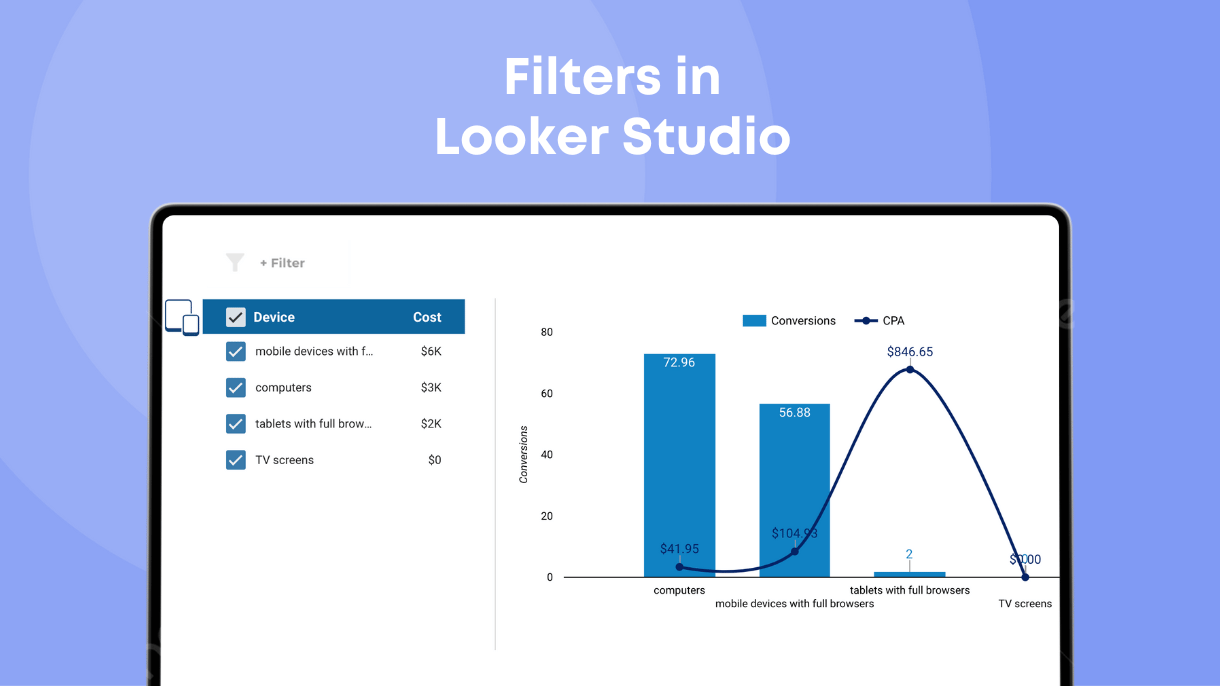
You often rely on reports to compile visualizations using graphs, charts, or pivot tables to display and analyze data. Multiple data filters can be applied using dimensions or metrics, or both.
Data reports implement view filters and data range controls, allowing a flexible template that anybody can use to access specific data.
What Are the Different Filter Settings
Data filters contain the properties assigned to a specific data source. Filters come in two types: include and exclude.
- Include filters set up to show data that matches the set conditions.
- Exclude filters set up to show all the data that does not match the set conditions.
Filtering does not alter or change any data. It only limits what data you see based on set conditions. If you need to exclude a chart from your report, the exclusion filter allows you to be specific with your instructions. Clauses further specify those conditions:
- AND: true for data that meets all the conditions
- OR: true for data that meets any one of the conditions
- BOTH: The data meets any one condition or all conditions
Refine filter properties using more advanced settings following these instructions.
Types of Data Studio Filters
You have many different ways that you can organize your data. Looker Studio offers a variety of filters. You can manage how you contain your information. What type of filter you choose allows you to customize how you present your projects.
Fixed-Size List
A fixed-size list presents your values as an expanded list. This type of filter stays one size. Also, it supports single or multiple selections and search functionality to search for values in the list.
Drop Down List
Whereas the drop-down list creates menus that open into a long list and acts like an interactive menu. Like the fixed-size list, you can set up multiple or single values or use the search box to include specific values. This list is considered one of the most-used filters across Looker Studio reports.
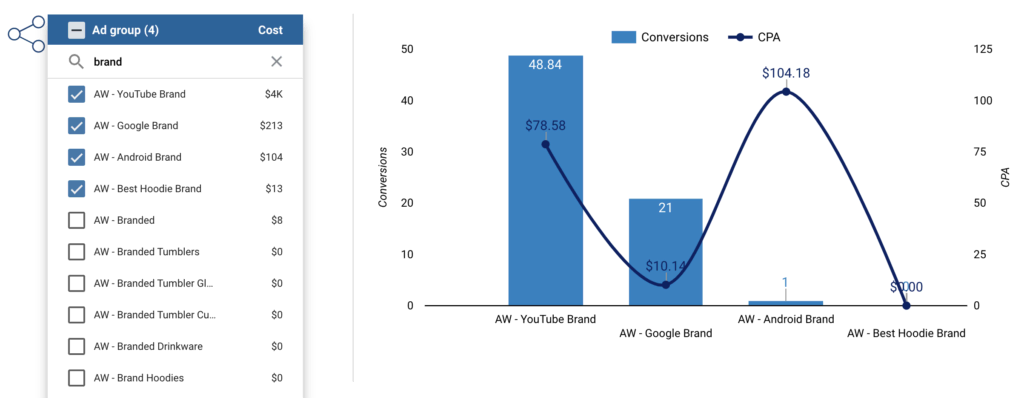
Input Box
With an input box, you essentially create a search bar. This function allows you to narrow your data down to specific values you type in. You can alter the search setting with functions like “contains,” “equals,” “starts with,” and “regex” to organize your search results.
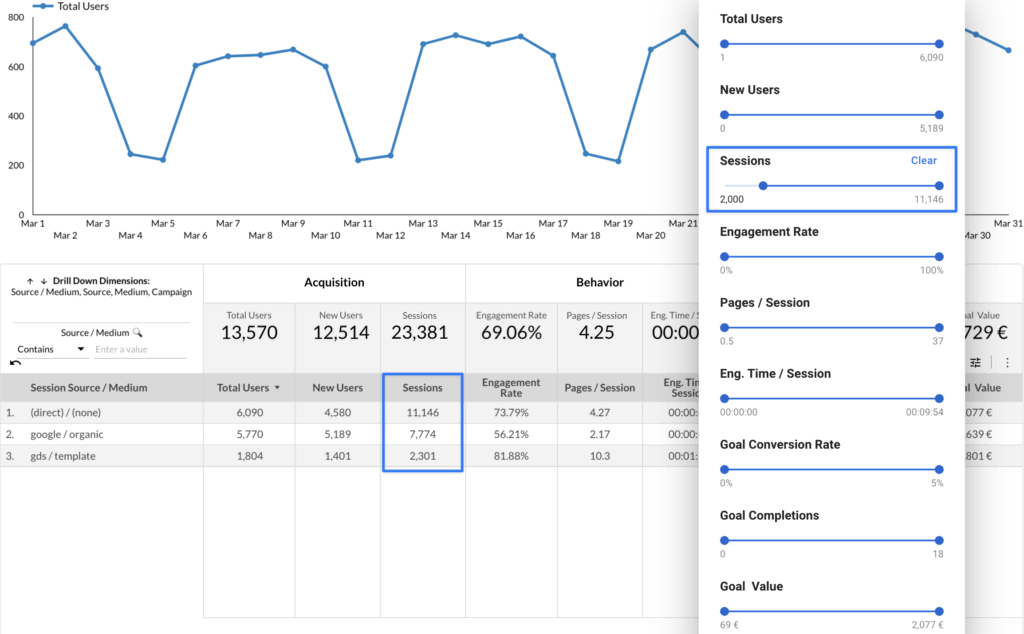
Slider
The slider controls allow users to select a range of values to include in graphs. This way, a report filters based on the specific numeric dimension.
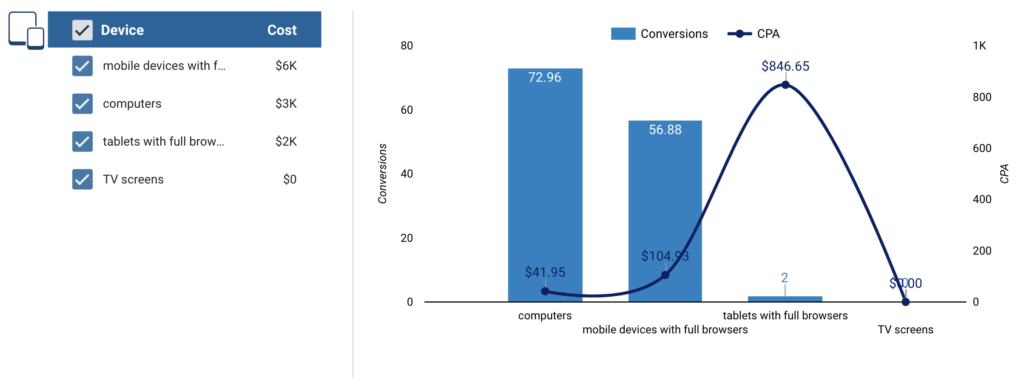
Checkbox
The checkbox filter setting functions like a switch between two sections that don’t overlap. This method filters boolean dimensions. Basically, it creates a setting where you jump back and forth between two binary settings.
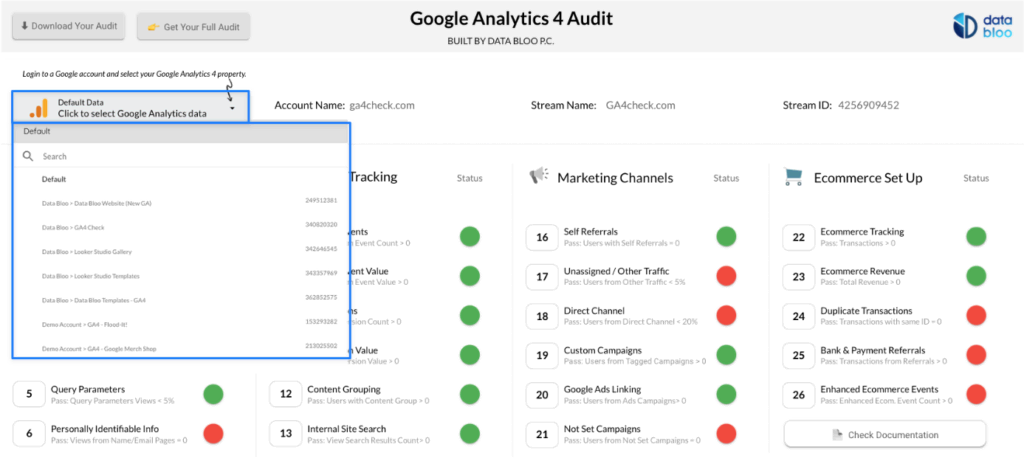
Data Control
One of the most powerful filters in Looker Studio is the data control that allows viewers to select the data source used in a report in a view mode. This filter simplifies the sharing of reports with others who may want to use the report but without having edit access to it. For instance, anyone can select his/her property to quickly audit the GA4 using our own report.
The Difference Between Report Filters vs Page Filters
Implementing filters in an entire report depends on whether you set up report filters, page filters, or chart filters.
Report filters apply to all the charts in the entire report across different pages, meaning that the report focuses on a particular subset of data. All the report filters have a purple layout while selecting them.
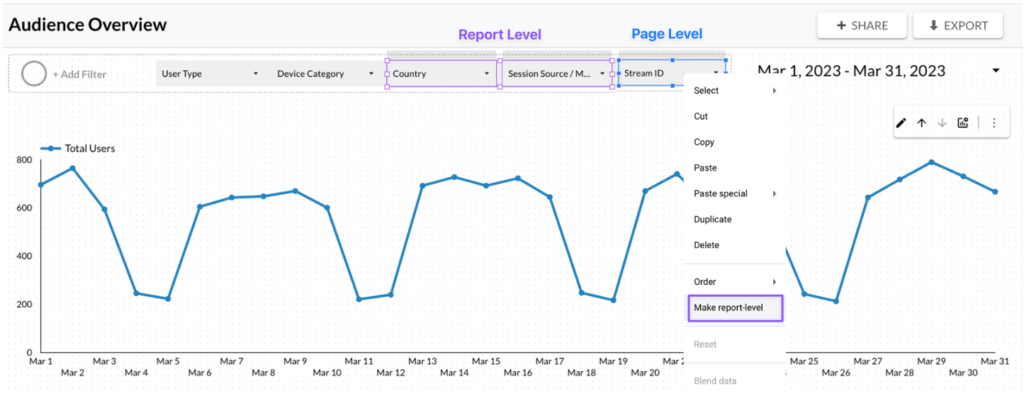
This limits the effectiveness of report-level filters, which can only apply to components that utilize the default data source and cannot include charts from a different data source. Incorporating other data sources in a default setting requires creating a chart-level filter.
Page filters (in blue layout) apply to all the charts on that particular report page. Different pages can be filtered to contain different subsets of the data. Each page filter sets different conditions specific to that page.
Differentiating Between Filter Level Settings
Setting Looker Studio filters at the highest level component, the report setting, apply the filter conditions to all the components beneath them. Thus, report-level filters will affect the data sets throughout the entire report. Lower-level components inherit filter settings from the top down in this order:
Report level >> Page level >> Chart level
If you want filter conditions to apply to only one report page, then create page-level settings. All charts on that page feature data sets based on those settings. Also, you can create different filter conditions on each page.
Components with multiple filters automatically function as an AND clause.
Feel free to check out more detailed instructions on all filter features using Google Looker Studio’s Help Page.
We Can Help You Create Epic Data Visualizations
While Google has set up its user-friendly interface to curate high-quality reports and effectively sort through and organize complex data sets, navigating that on your own can be challenging.
Not everyone has an eye for design. Our professionally-tailored customizable templates help you stand out. We make using Google Looker Studio filters more approachable.
Our team has created a gallery of templates for you to access, custom-made to fit multiple types of reporting while displaying advanced design features and interactive visuals.
Check out a free demo of the Keyword Ranking Report Template. These layouts use design features to direct the eye along a specific path, producing optimal insights and business solutions.
Contact us to learn more about the features we offer to enhance your experience by mining data using Google’s systems. We have designed systems to simplify Google Looker Studio with your needs in mind.