Table of Contents
Data visualizations use elements of design to do what our brain does naturally: create order.
Instinctively, we seek to find the most obvious patterns taking the quickest way to get there. Our brains like to find shortcuts. While interpretation remains subjective, our ability to make sense of things helps us process information.
Google Looker Studio dimension vs metric offers different ways to make sense of raw data.
If we have large data sets in front of us, we want to make sense of those, too. Generating dimensions and metrics for reports make data sets more comprehensible. This, in turn, helps analysts find answers more quickly and more easily.
Keep reading to learn more about how to set up metrics and dimensions for your reports.
Explaining Google Looker Studio Dimension vs Metric
Analysts organize and format data in specific ways so it can be read in the way they want it to. This process of manipulating data is known as “data modeling”. By doing this, you take data, which in its raw form doesn’t mean much, and model it to demonstrate growth or analysis.
Modeling data involves working with different fields which make sense of the various properties of data. The types of fields discussed here include dimensions and metrics.
Dimensions in Looker Studio
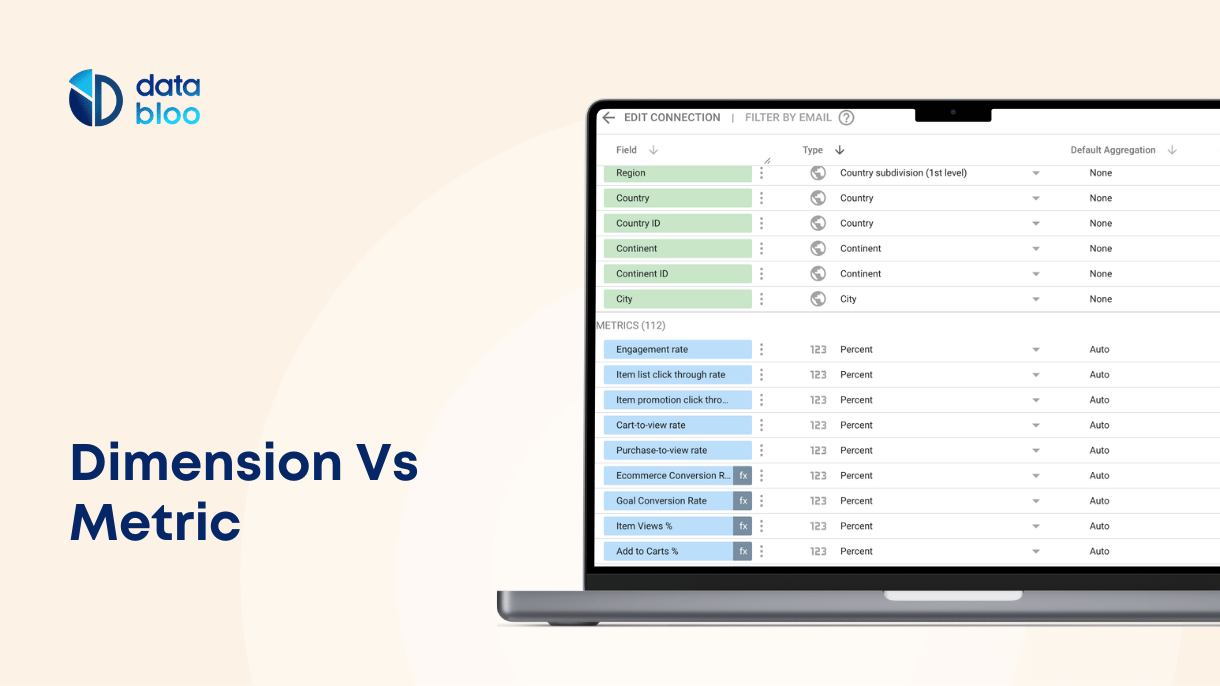
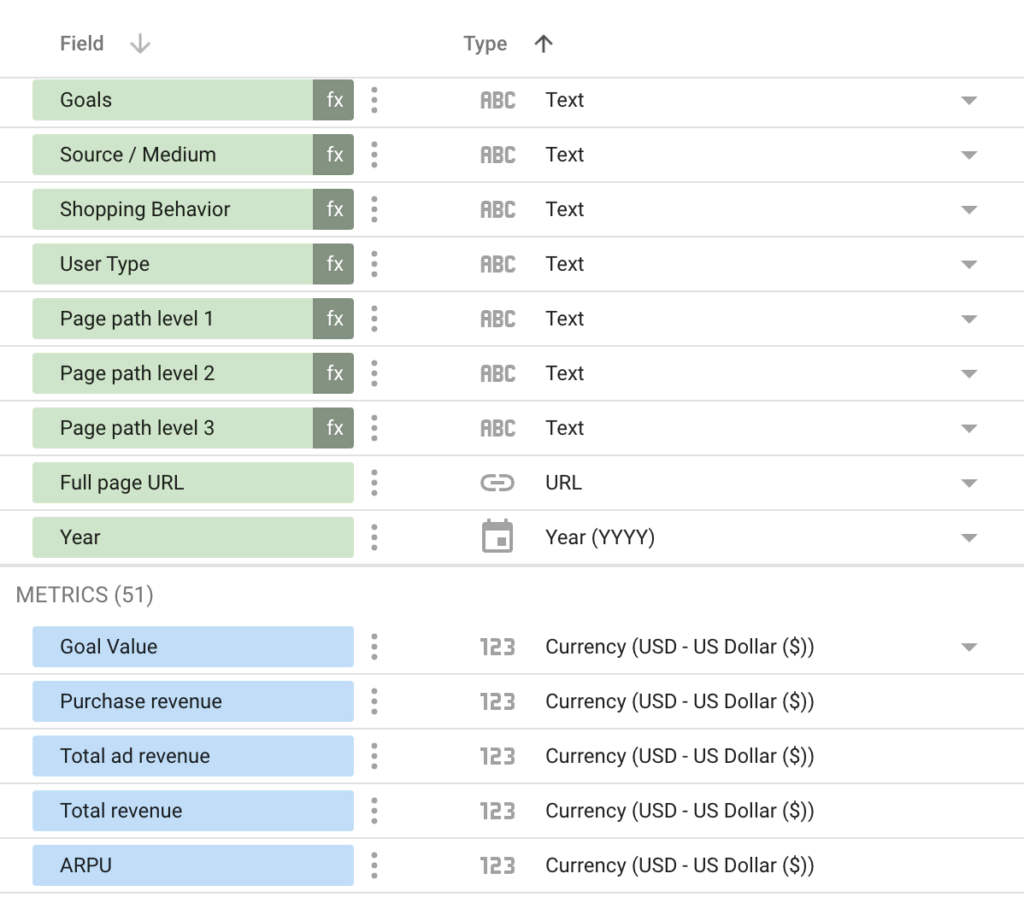
In Looker Studio, a dimension is a field or attribute in a dataset that is used to organize, group, or filter your data and is labeled with green background. Each category contains unaggregated data, or data before it’s been put together cohesively.
Dimensions provide the descriptions for data. For example, some well know dimensions in Google Analytics are Product, Month, Source / Medium, Page Title, User Type, Country, or anything that can be placed into a category.
Metrics in Looker Studio
In Looker Studio, a metric is a numerical value ascribed to a dimension and provides quantitative insights, allowing you to measure the performance and trends of your data. When you create metrics, you form the data into aggregated groups. All the metrics are labeled with blue background in their data sources.
You can derive metrics values from already existing sets of data. You also can manually create metrics with specific functions, which can include:
- COUNT () or the number of
- SUM () adding values together
- AVG () average of a group of values
The Difference
Metrics function as the calculation of values within a specific dimension set. These values, called data metrics, quantify what exactly happens in the larger data sets.
Whereas, dimensions refer to the categories of data. These data points have not yet been aggregated into special groups or values. They simply exist within categories as raw data.
How Is a Data Source Schema Structured?
A data schema describes the specific blueprint for the construction of a database. This means the way data gets divided into different database tables, making up the structure of the database.
The data source schema defines in specific terms how data gets organized within fields. Most schemas exist in the form of data visualizations. They serve as a visualization of the structures into which data sets fall.
The data source schema means the structure explicitly. It does not describe the data itself. Designing the data schema also falls under what encompasses data modeling.
You can design a data source schema in Google Looker Studio using certain functions, including the following:
- Creating new calculated fields
- Creating new functions
- Changing specific types of data
- Adding custom-made parameters
You can learn more about structuring a data source schema in one of our other articles, Google Looker Studio Data Sources.
How to Use Dimensions and Metrics?
The following steps enable you to customize field properties in your report and add dimensions and metrics. These steps allow you a range of options for data modeling. Select the features that will set up how the visualizations in your report are designed.
Setting Up the Data Fields
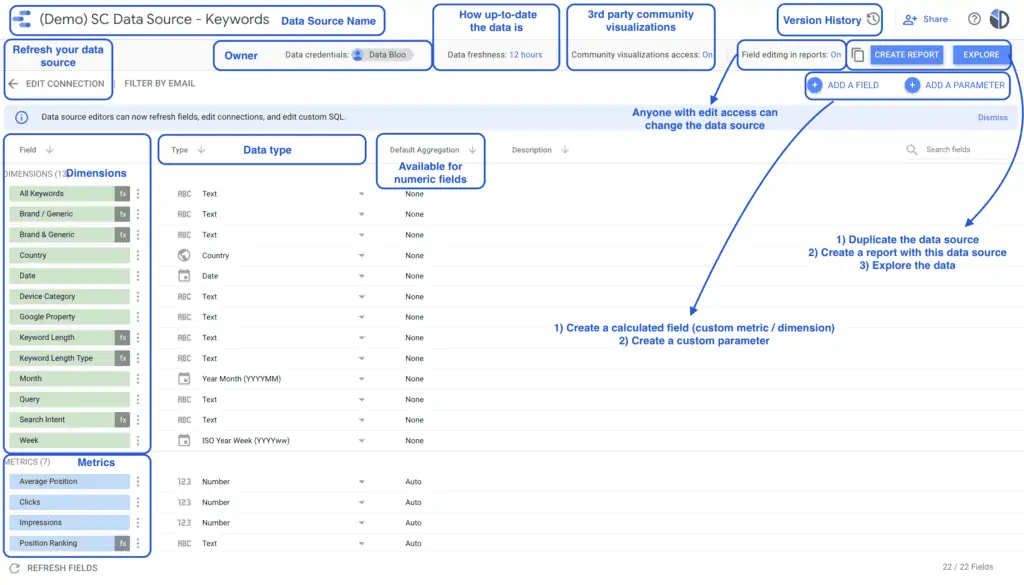
In Google Looker Studio, you obtain the following field properties from data sets:
- Name
- Data type
- Description
You can change the name of the field by clicking on it and typing in a new name.
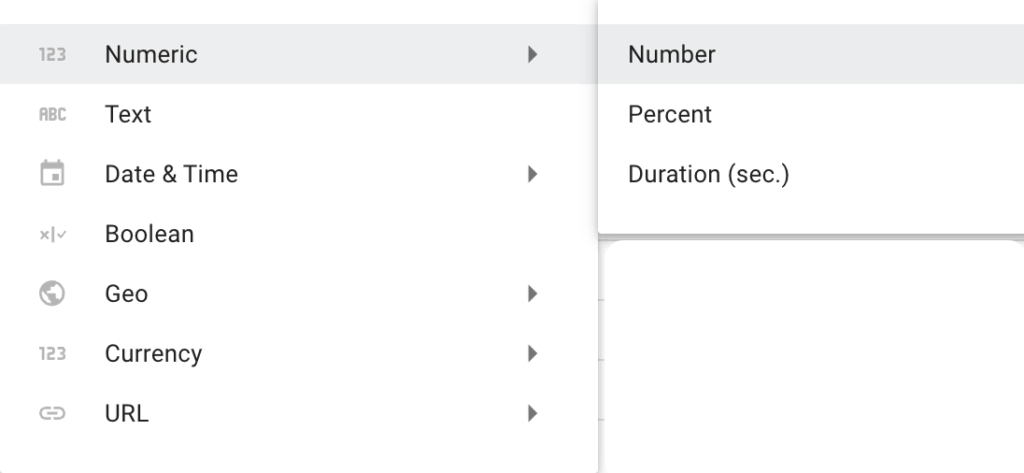
To change the field’s data type, select the data type you want from the drop-down menu. The data types include:
- Numeric: (Number, Percent, Duration)
- Text
- Date: (Date, Date & Time, Year, Year Quarter, Year Month, ISO Year Week, Date Hour, Date Hour Minute)
- Currency (Dollar, Euro, etc.)
- Boolean
- Geo (Continent, Subcontinent, Country, Designated market area, City, Postal Code, Address, Latitude / Longitude)
- URL (URL, Image)
The data types also set which functions can be performed in each field. The fields in Looker Studio will only allow the types of functions appropriate for that data set to work.
The description refers to the annotations provided for the data source. These descriptions can only be seen in the data source, not the report. Clicking on the description allows you to make edits.
Aggregating Data Sets
A field applies the default aggregation method when it contains metrics in a chart. The three aggregations that exist in Google Looker Studio include:
- None for non-numbers
- Sum as default for numbers not aggregated
- The auto includes data coming from a connector, data set, or calculated field
Fields will contain aggregated sums when transferring columns from specific programs like Google Sheets or BigQuery tables.
There is also a way to set up metrics using dimensions in a chart. To do this, you can manually type in certain functions. For example, you can type in COUNT(ProductName) and text-based data shows up in the field.
Setting Dimensions and Metrics in Reports
First, you add data sources to the field so that anyone with access to the report has access to building charts and creating controls with the data. Setting up dimensions determines how you want to group the data sets. Each dimension hones in on increasing detail in the chart.
Metrics, which we’ve discussed as the values in the chart, get determined by the dimensions they fall under. As the dimensions narrow in specific detail, the metrics will reflect those categories.
You can override the default settings for aggregation and data types with these two processes.
In the first method, you enter a dimension as a metric. When you add a non-numeric dimension as a metrics value, you apply the Count Distinct Aggregation or CTD. When you add numbered dimensions, it defaults to the aggregation set up in that data source.
The second method involves manually editing the data fields. You click on the field’s edit pencil to make edits. For example, you can change the aggregation method or data type. You can also run calculations and run comparisons between data sets.
Introduction to GA4 Data Source and Metrics & Dimensions
Within the Google Analytics 4 (GA4) ecosystem, metrics, and dimensions are essential components for understanding and analyzing user behavior and website/app performance.
Metrics in GA4 are numerical values that offer quantitative insights into specific user interactions like page views, sessions, conversions, and revenue.
On the other hand, dimensions in GA4 provide contextual information and help categorize collected data. They enable segmenting and filtering metrics based on attributes such as traffic sources, user demographics, device types, and content categories.
Google recently introduced a significant update to its Google Analytics 4 (GA4) native connector, adding a plethora of new metrics and dimensions. More specifically Google added more than 170 fields to its connector, including important information such as landing page, bounce rate, average session duration, user conversion rate, first user campaign/source/medium data, and session campaign/source/medium data. These additions provide analysts with a broader range of data points to work with, enabling deeper analysis and insights.
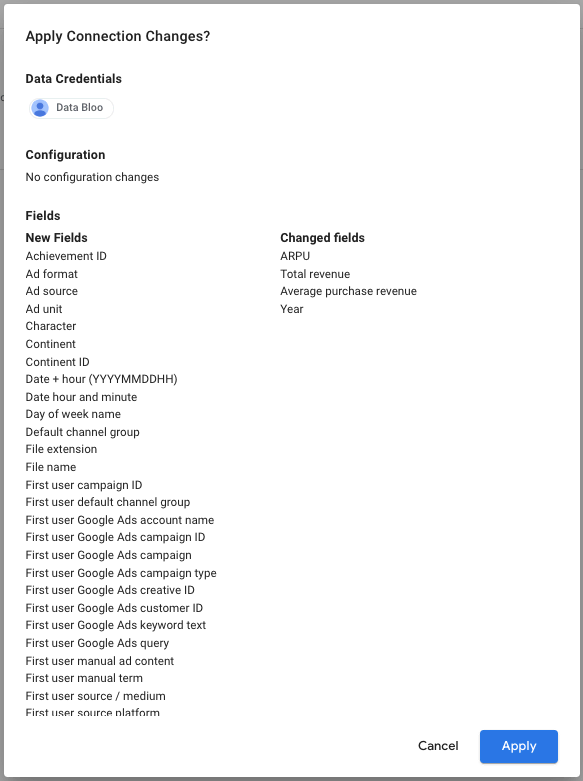
The update is backward compatible, ensuring seamless integration with the previous version of the connector. You can easily get access to all the available GA4 fields if you refresh an existing GA4 data source or create a new one from your Looker Studio interface.
Using Google Looker Studio to Present the Right Conclusions
When generating reports, you have control over how the audience sees patterns and answers in the data. You present the questions which get answered by the data as you organize it.
Dimensions vs. metrics in Google Data Studio present different ways to modify the dimensional fields of your data once you added data sources to your report.
Check out Data Bloo to access well-designed templates for data analysis and visualization.