Table of Contents
At the 2022 Google Cloud Next virtual conference, Google announced something big. Just three years after acquiring the data and analytics platform, Looker, it has finally merged all its business intelligence features and tools under one product: Google Looker Studio.
Among its many features, Looker Studio Conditional Formatting can help you upgrade your simplify your reporting. In this article, we will explore how to use conditional formatting effectively in Looker Studio and provide practical examples to help you make the most of this great feature.

What is Conditional Formatting?
Conditional formatting is a powerful feature that allows you to present your data based on specific rulesets that you define. This functionality can help you improve the visualization aspect of your report, by changing styles, colors, texts, and more to the available charts. More specifically, you can highlight crucial data for your business, identify outliers that impact your performance, and draw attention to specific trends in your data. This can result in faster and easier data analysis and better decision-making. Don’t forget about the age-old saying: a picture is worth a thousand words.
Available Conditions in Looker Studio
Clearly, this is an incredibly powerful functionality. But, which are the conditions that can be formatted?
Starting with the most important piece of information, the options available to be formatted are both rows and individual fields. As for what the formatting looks like, that tends to be color. Whether it be a single background color, single text color, a color scale, or different colors depending on different rules, that all depends on how you set up your conditional formatting (see the next section).
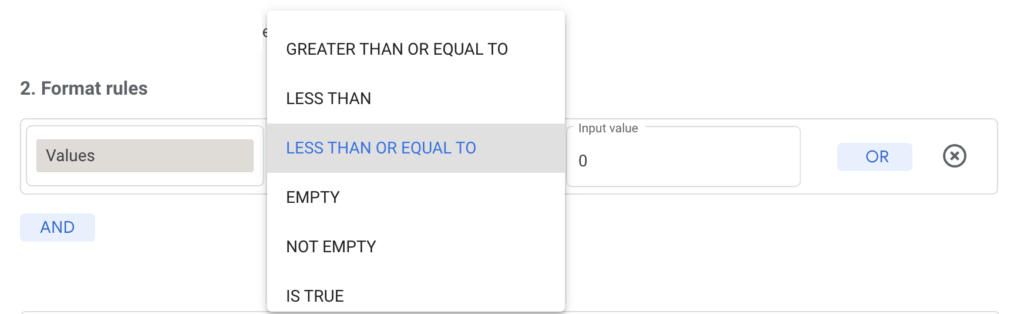
As you might imagine, this all works by using the numbers or texts within the fields or rows. It might be that you’d like to use conditional formatting to change the color of a field if it includes a number greater than 50 or a text that contains “cpc”. Another option would be to do this with percentages or decimals. It all depends on the rules you’ve put in place. Below you will find all the available conditions that you can use for conditional formatting.
- EQUAL TO / NOT EQUAL TO
- GREATER THAN / LESS THAN
- GREATER THAN OR EQUAL TO / LESS THAN OR EQUAL TO
- EMPTY / NOT EMPTY
- IS TRUE / IS FALSE
- CONTAINS / DOES NOT CONTAIN
- STARTS WITH
- REGEX
It’s also worth noting that rules can be simple or complex. For example, AND or OR statements can be used to ensure the rule fits your needs exactly.
How to Use Conditional Formatting
Here are the 3 steps on how to use conditional formatting in Looker Studio:
Step 1: Create a chart
To use conditional formatting in Looker Studio, you first need to create a visualization. For instance, you can create a new chart such as a regular table, a pivot table, or a scorecard.
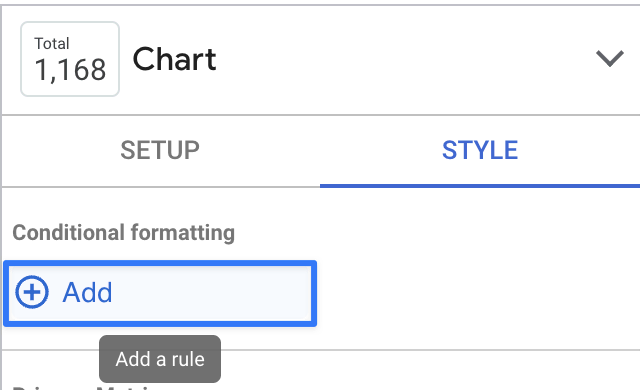
Step 2: Add a rule
Once you create a new chart, go to the “Style” tab and click “Add” under the Conditional Formatting section.
Step 3: Create the rule
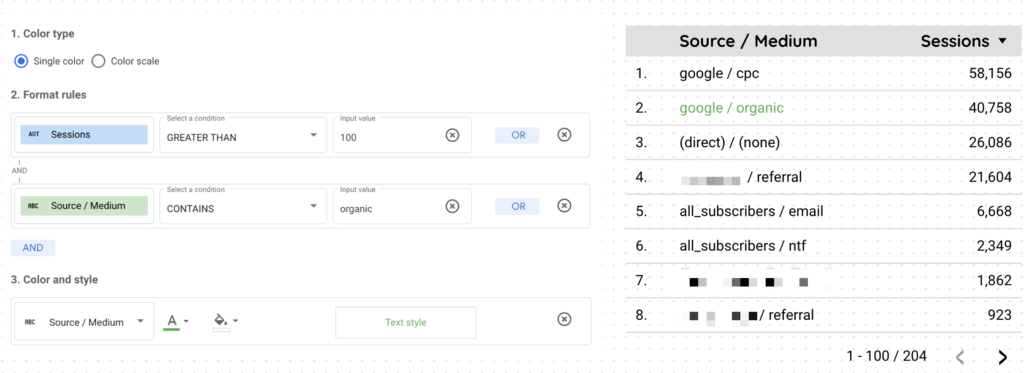
In the new window, you need to specify the conditions under which the formatting should be applied. Looker Studio offers several options for defining conditions, including thresholds, color scales, and styling. In order to create the rule you should:
- pick the color type (single color or color scale). For example, you could use a red-to-green color scale to highlight high and low values for a particular metric.
- add the conditional formatting rules. In this section, you can define the values and the conditions for a particular metric or dimension. For example, you could set a threshold of 100 sessions from organic sources and apply a green text to this dimension in a table where this condition is true. Another good example is to use custom expressions to apply different formatting to different countries, or channels in case they meet specific criteria.
- choose the right color and style for your rules that could be applied in the entire row, in metric or dimension level.
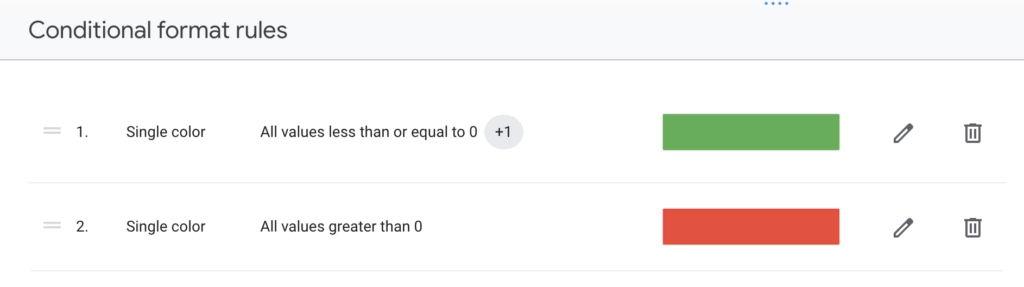
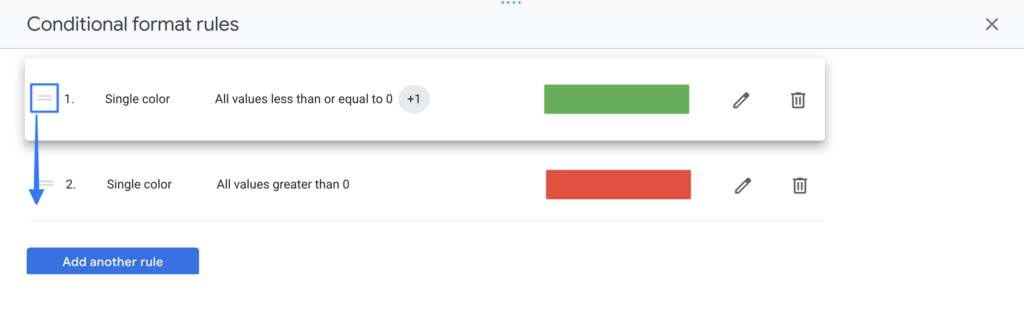
Step 4: Order your rules
In case you need to create more than 1 rule for a specific chart, you should have in mind that order matters to the final result. More specifically you can create multiple conditions (up to 10) for a specific chart and then drag and drop them in a certain order. The rule that is located further down the list will supersede the earlier rule.
When to Use Conditional Formatting
If you’re first starting out using Google Looker Studio, using conditional formatting can be very fun and satisfying. You might be tempted to use it on everything and accidentally spend hours longer than intended just making your reports look pretty.
While we’re never going to look down on that, there are some situations in that conditional formatting will be better suited than others.
First, if you’re noticing that your colleagues or clients aren’t reading your reports properly, that is a great indication that conditional formatting should be utilized. Sometimes reports could be boring or challenging for the viewers. If they’re packed with data and it’s all black and white on the screen, it’s easy to zone out.
To properly utilize conditional formatting, you want to use it to make the most important information pop and stand out. More specifically, you can use it to:
- present the most important KPIs vs the target. This is a pretty straightforward example where you can set a green background when the revenue or transactions are above your target.
- highlight key performance drivers of your business. For example, you may want to identify products that are significantly underperforming relative to the rest of your product line. To do this, you could use a color scale to highlight products with sales that are below a certain threshold.
- flag potential issues. For instance, you can set a rule when the bounce rate is less than 10% or above 90% to be flagged with red (see below the audit).
- underline trends over time. For example, you may want to identify products or regions where sales are increasing or decreasing over time. To do this, you could use a color scale to highlight products or regions where sales have increased or decreased over a particular time period.
In general, the report viewer shouldn’t have to search for the main points; they should be drawn to them automatically. That’s when to use conditional formatting.
Conditional Formatting Example
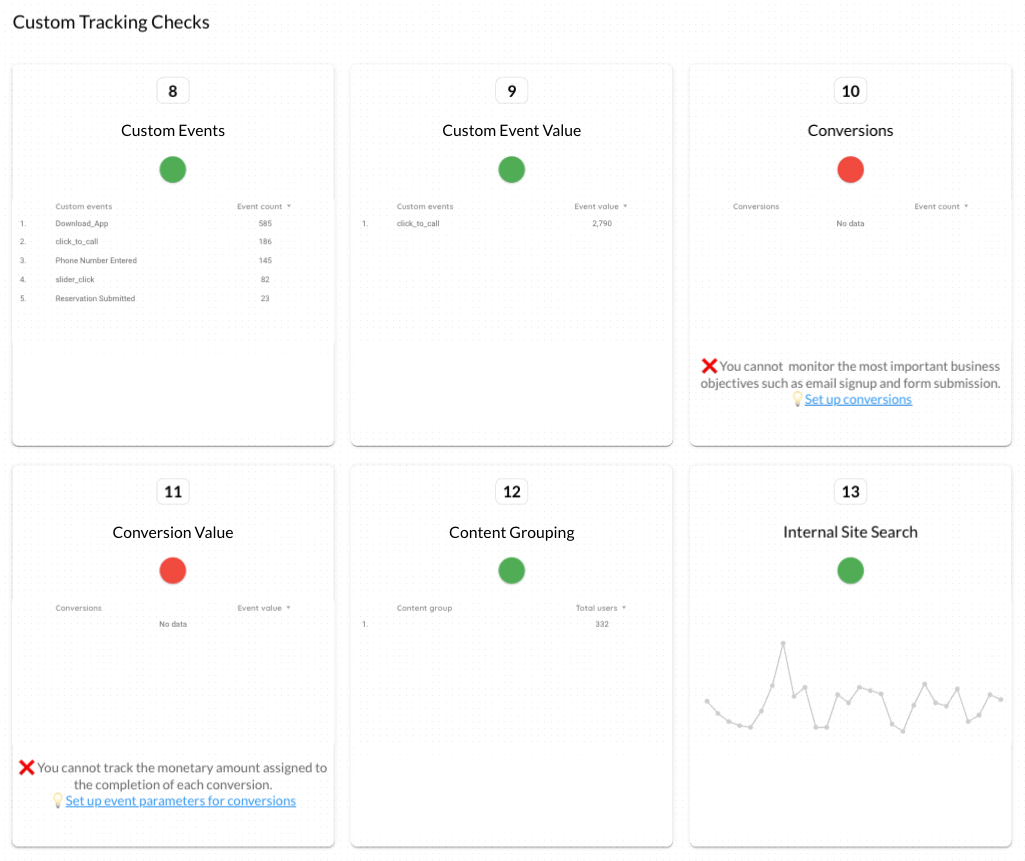
A great example of conditional formatting in Google Looker Studio is the free GA4 Audit. As you can see, we have utilized conditional formatting to show whether each check passes or fails. Doing so and using the traditional color scheme of green for pass and red for fail means that a user can immediately see if the checks are ready to go or if they still need work.
Because the color is used sparingly, your eyes are automatically taken to the important pass or fail section immediately. Also with the full audit, the user gets actionable insights when a check fails, so he can easily find a solution to the issues. And all of that thanks to conditional formatting.
Start Using Looker Studio Conditional Formatting
So, to get the most out of Looker Studio, it’s important to make sure to utilize conditional formatting. In fact, Looker Studio conditional formatting can actually be the difference between your colleagues and clients reading and understanding your reports… or not.
If you’re unsure of where to start, a great idea is to use templates. That way, you can be sure you’re using tried and tested methods of analysis and optimization. If you want to grow your business, effectively utilize Google Looker Studio, and use templates that are proven to work, get in contact with us now!