Table of Contents
Data visualization is a critical component for business success, allowing you to get actionable insights and make better decisions for your company. One feature that significantly impacts your data analysis capabilities is the date range control. This guide will walk you through what date range control is, how it works, and how to use it in Looker Studio to optimize your reports. By the end, you’ll be able to utilize date range control to pull performance insights over time.
What is Date Range Control
Date range control is a feature in Looker Studio that allows users to filter their data based on specific time periods. This means you can set the timeframe for which you want to view the data, making it easier to analyze trends, compare periods, and get insights from various data sources. Whether you need to look at data for a day, week, month, quarter, year or custom period, date range control offers the flexibility to customize your data view.

How Date Range Control Works
Date range control functions by dynamically filtering the data in your report to display only the period that falls within the specified date range. This control can be applied at various levels:
- Report Level: Applying the date range to all the elements of the report, ensuring a consistent timeframe across all pages and visualizations.
- Page Level: Setting different date ranges for each page, allowing each page to display data for different timeframes.
- Chart Level: Applying the date range to specific charts on a page, enabling a focused analysis of particular data points.

When you set a date range, Looker Studio automatically updates all connected visualizations to reflect the selected timeframe. This ensures that all data representations in your report are synchronized and consistent with the chosen date parameters, making it easier to analyze and compare data across different periods.
How to Use Date Range Control in Looker Studio
Using date range control in Looker Studio is straightforward. Follow these steps to add and configure date range control in your reports:
Step 1: Open your report
Open your Looker Studio and select an existing report or create a new one. Double check that your report is connected with a data source like Google Analytics.
Step 2: Add date range control
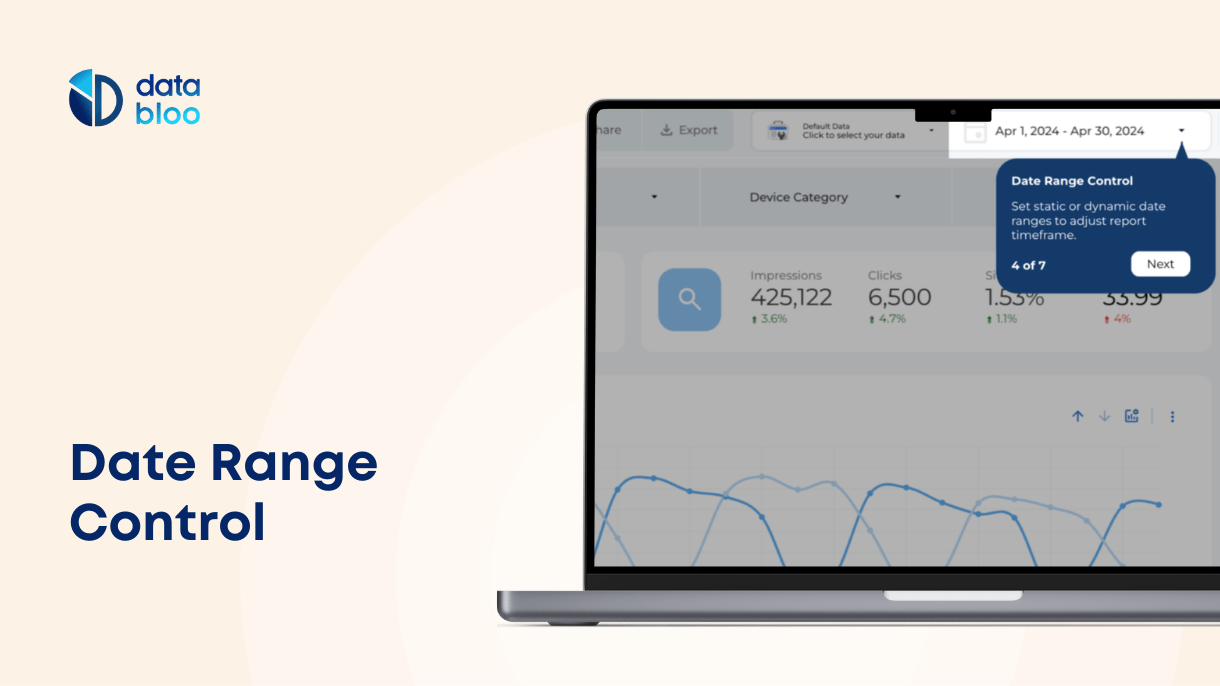
Go to the edit mode, navigate to the top toolbar and click on the “Add a control” button. From the dropdown menu, select “Date range control.” Drag and drop the date range control widget to your report, usually at the top right of the page.

Step 3: Configure date range control
Once the date range control is added, you need to set the right configurations. Select the date range control widget to open its settings panel. Here, you can define the default date range i.e. last month of fixed/advanced period.
Step 4: Customize design
In the style tab, you can edit the size, font, color, background, border and padding like any other Looker Studio chart.
Date Range Options: Fixed vs. Advanced
Looker Studio provides various options for setting date ranges, allowing you to choose between fixed and advanced date ranges depending on your reporting needs.
Fixed Date Range
A fixed date range is set to specific start and end dates. This option is useful for analyzing data within a predefined period, such as a specific a product launch or a marketing campaign duration. To set a fixed date range:
- Click on the date range control widget.
- Select “Fixed range” from the options.
- Enter the start and end dates manually and click apply.
Dynamic Date Range
A dynamic date range allows for more flexible date selections. This option is ideal for regular analysis, where you want the date range to update automatically. Looker Studio provides the following preset examples:
- Last 7 days
- Last 14 days
- Last 28 days
- Last 30 days
- This week (starts Sunday)
- This week to date (starts Sunday)
- Last week (starts Sunday)
- This week (starts Monday)
- This week to date (starts Monday)
- Last week (starts Monday)
- This month
- Last month
- This quarter
- This quarter to date
- Last quarter
- This year
- This year to date
- Last year
To set an advanced date range:
- Click on the date range control widget.
- Select one from the above options and apply.
Advanced Date Range
An advanced date range is similar to a dynamic date range, but it allows for more precise customization of the time period. For instance, you can configure the start and end dates by setting specific parameters, such as:
- Today minus X period (where the period could be days, weeks, months, or years).
To set an advanced date range:
- Click on the date range control widget.
- Select “Advanced range” from the options.
- Enter the desired parameters to define your custom date range.

These options provide the flexibility needed to tailor your data analysis to specific timeframes, enhancing the depth and relevance of your reports.
Comparison for Date Range
Date range comparison is a feature that enables you to compare data from different time periods within the same chart. This is particularly useful for identifying trends and comparing data Year-on-Year (YoY) or Period-on-Period (PoP). To enable date range comparison:
- Select the chart: Choose the chart you want to add the comparison to.
- Open the settings panel: In the settings panel, scroll down to find the “Comparison Date Range.”
- Select comparison period: Select the period you want to compare against. The available options are Fixed, Previous period, Previous Year, and advanced date range.
The comparison feature will update your visualizations to display the comparison periods side by side, allowing for easy analysis of changes and trends.
Comparison Toggle
One of the easiest ways to switch comparison periods is to include a toggle in your reports. In all our templates, we always include a toggle at the bottom left of the navigation, so users can easily compare YoY and PoP data with just a click. This allows you to have the exact same view in both comparison periods for easier analysis. For instance, if you set the date to last month and it’s May 2022, you can easily compare it with May 2021 (YoY) and April 2022 (PoP).

By incorporating the comparison toggle, you ensure that your reports are not only dynamic but also user-friendly, enabling quick and effective data comparisons to drive insights and decision-making.
Best Practices for Using Date Range Control in Looker Studio
To make the most out of date range control in Looker Studio, follow these best practices:
- Choose relevant date ranges: Select date ranges that are relevant to your analysis. For example, if you’re analyzing monthly or quarterly sales trends, choose monthly or quarterly date ranges. Avoid using overly broad or narrow date ranges.
- Make control visible: Ensure that your control is visible and the date ranges are clearly labeled. This helps users understand what data they are viewing and makes your report more user-friendly. For example, place your control at the top right of your report with the right text size.
- Use comparison properly: Comparing multiple periods in one page can be challenging for the user to interpret the data. Focus on the most relevant comparisons that provide meaningful insights and use toggles to separate YoY and PoP performance.
Enhance Your Data Presentation
The date range control feature in Looker Studio is a powerful tool for dynamic and insightful data analysis. By allowing users to filter data based on specific timeframes, it enhances the flexibility and depth of your reports. Whether you are analyzing sales, website traffic, or campaign performance, date range control is the key to pull the right insights from your data.
For those looking to further explore the capabilities of Looker Studio, consider checking out our ready-to-use reports. These templates are designed to help you make the most out of Looker Studio’s features, including date range control. Visit our gallery to discover a range of customizable templates tailored to your needs.