Table of Contents
Data analytics plays a huge role in business success. They allow you to assess your business strategy, personalize your customer experience, and streamline your operations. This all saves you time and money, so your business works as efficiently as possible.
This is why Google Looker Studio became incredibly popular when it first launched back in 2016.
Understanding how to optimize your reports with Looker Studio optional metrics will help you make the most of your data and perform in-depth analysis for your business.
Not sure where to start? Then you’ve come to the right place. Read on to find out everything you need to know about using Google Looker Studio optional metrics.

What Are Looker Studio Optional Metrics?
Optional metrics allow you to create flexible, user-friendly visualizations for your Looker Studio reports. This makes it easier to find specific data and explore specific metrics without reconfiguring the whole thing.
Adding optional metrics to a chart, for example, means that you can choose which columns you want to see within it. So the report will display specific data points that you’re interested in viewing.
This is a great way of decluttering your data visualizations. It also means that you don’t have to generate individual charts for each and every metric separately.
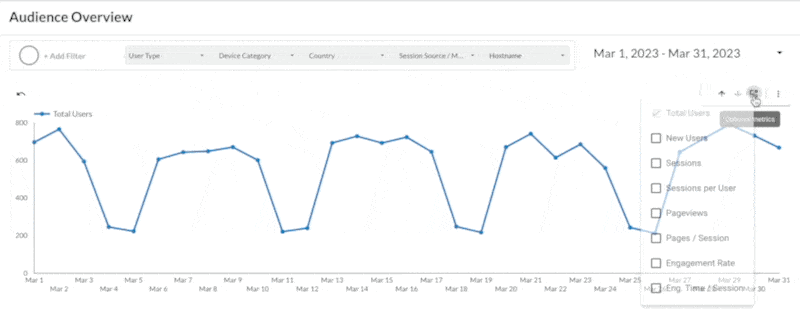
In fact, you can turn optional metrics on and off easily in view mode. So you can focus on specific areas of the report and then turn off optional metrics to view more or fewer fields. This is a great way to make a large data chart or even a template feel uncluttered and easy to navigate.
How to Add Optional Metrics in Looker Studio
To access Google Looker Studio, you need to sign into your Google account on the site’s data studio. From there, you’ll be able to create a new report or edit an existing one that you’ve already created.
Once you have created a new chart, you can add up to 10 optional metrics (per chart). Do this:
- Click on the report and select “Edit”
- Select the area you want to apply optional metrics to or click on “Add a chart”
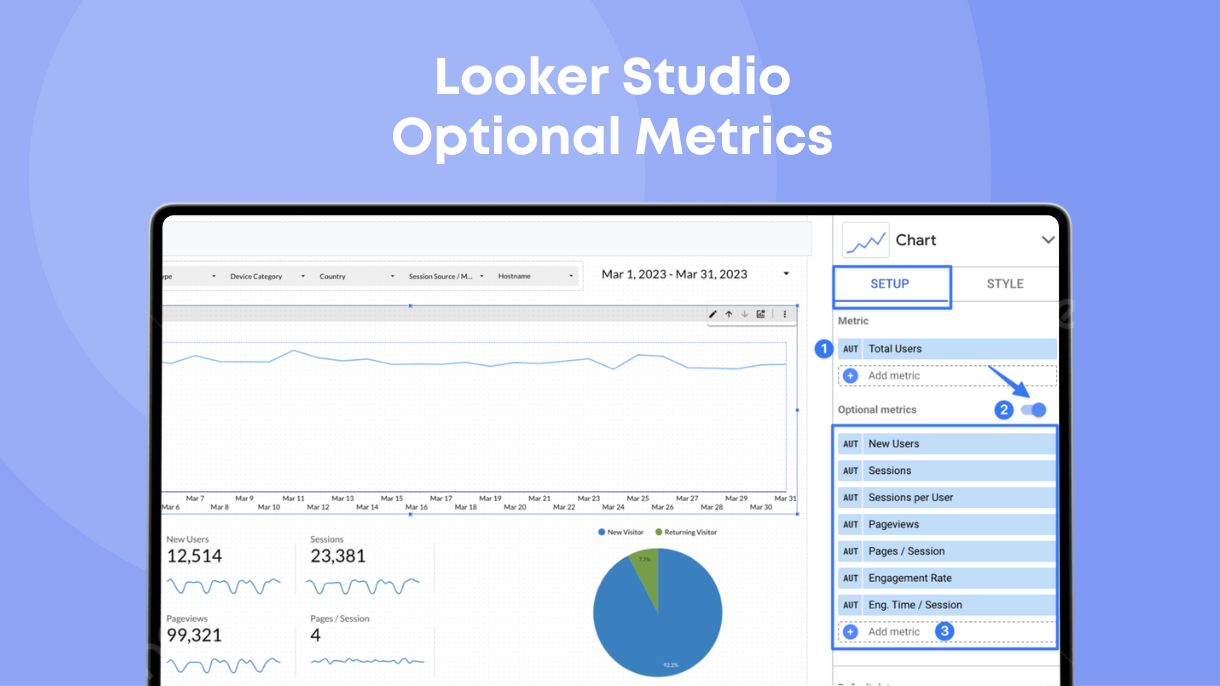
- Once you’ve created a chart, select the “SETUP” tab in the properties panel
- Turn on “Optional Metrics” (below the “Metric” header)
- Drag the metrics you want from the “Available fields” panel or click “+Add metric”
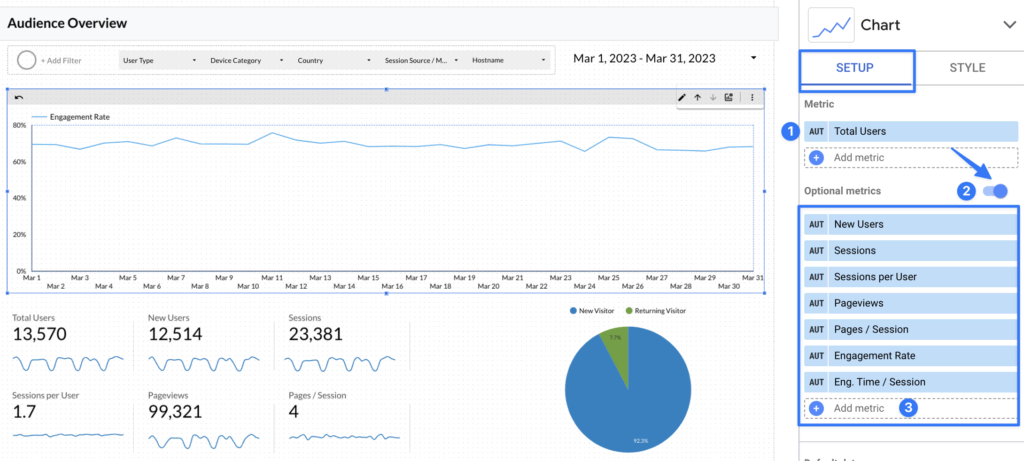
You can also add optional metrics to a chart by hovering your cursor and selecting the specific element, then the SETUP tab will appear. From here, you can choose which optional metrics you want to include.
Using Metric Sliders in Looker Studio Charts
You may also be interested in specific areas of data analysis. You can also use metric sliders to find this data quickly for more targeted analysis and insights.
A metric slider is an interactive filter that allows you to adjust the values of a metric on a chart. For example, you can set the range of the data (transactions more than 10) that you want to see in a chart and it will filter the chart based on that condition automatically. So you can find and compare different data points within a single metric easily. The metric slider is a useful functionality for exploring data and gaining a deeper understanding of trends and patterns.
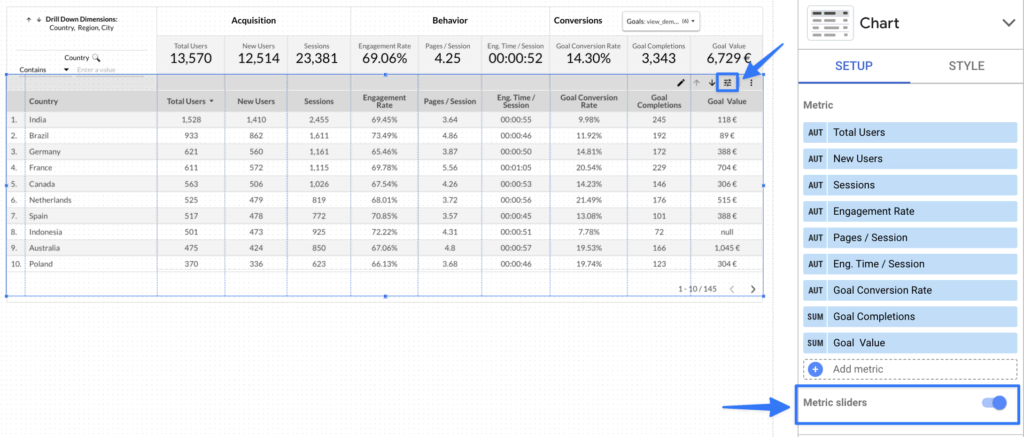
To install a metric slider on your chart, follow the first three steps above to reach the metrics “SETUP” tab. You will be able to turn on metric sliders under the “Metric” header.
You can adjust the slider settings on a chart by hovering your cursor over it. Then all you need to do is click on the slider icon and adjust your slider boundaries to view specific data.
However, it is important to note that you cannot use metric sliders and optional metrics on the same chart. So you should think carefully about which tool will be more useful for you.
4 Looker Studio Optional Metrics Examples
Data reports can provide invaluable feedback for a business. However, comprehensive data reports contain a lot of information.
Trawling through this to find what you’re looking for can take a long time and means that your data reports aren’t very user-friendly. This is where optional metrics and drill-down functionalities can help.
However, you can also make your data analysis easier by using a prebuilt report like Analytics4now that integrates the Universal Analytics reports with GA4 data from BigQuery and utilizes these functionalities across different charts and visualizations. Below you will find some optional metrics examples.
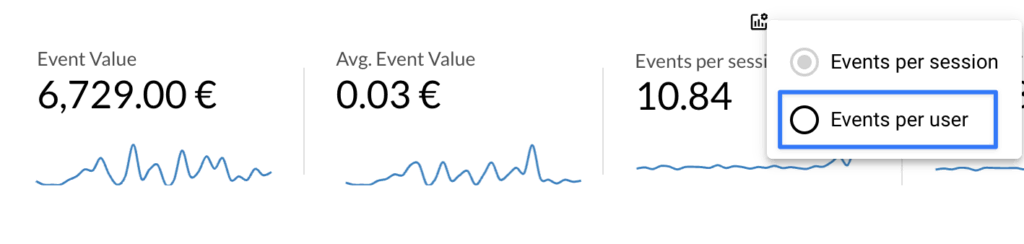
Scorecards
You can present specific KPIs as scorecards and add similar optional metrics under the same place.
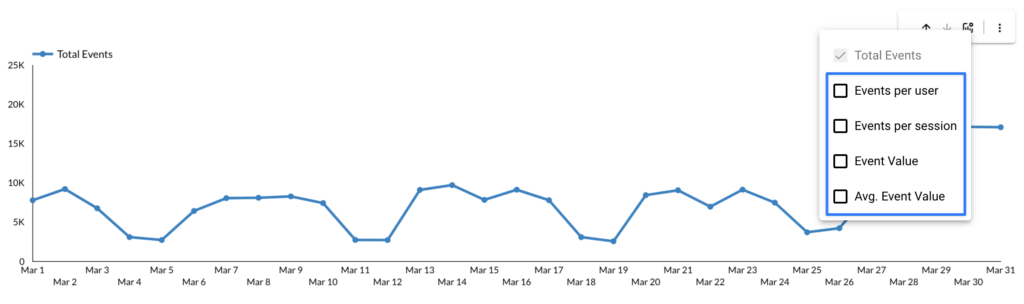
Line Charts
In case you want to spot specific trends over time, you can use optional metrics in a line chart.
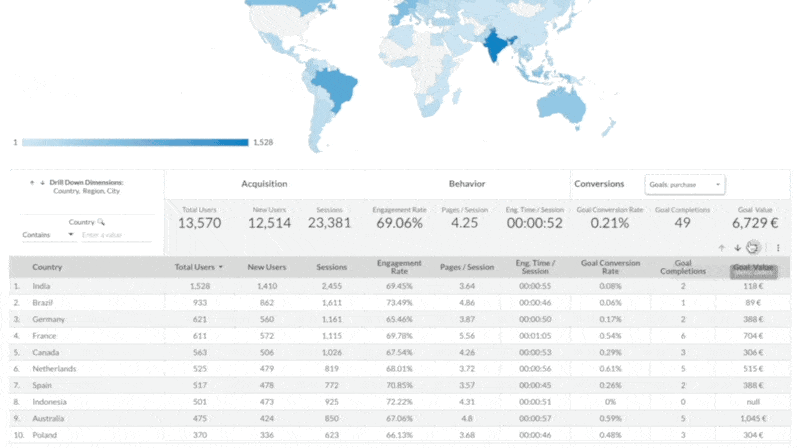
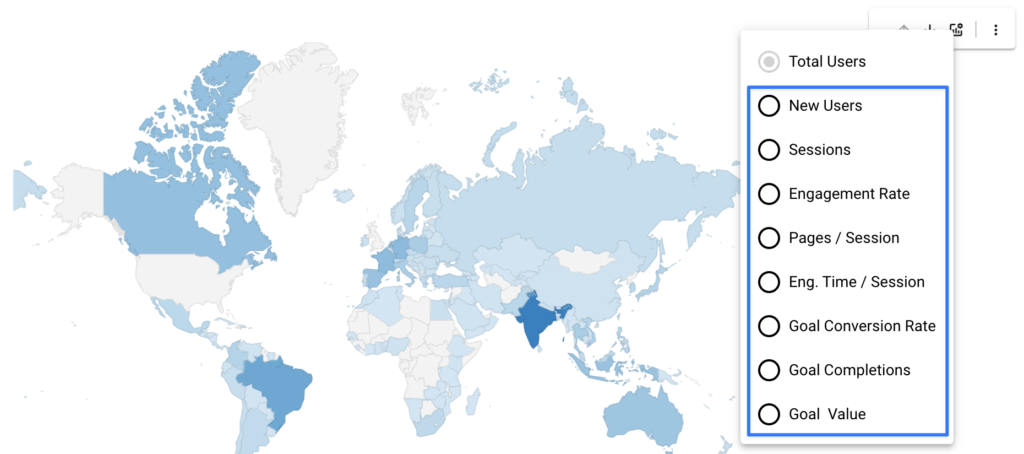
Geo Map
Optional metrics in geo maps let you compare specific metrics by country or even city, so you can identify areas that you are reaching and others that you may need to target.
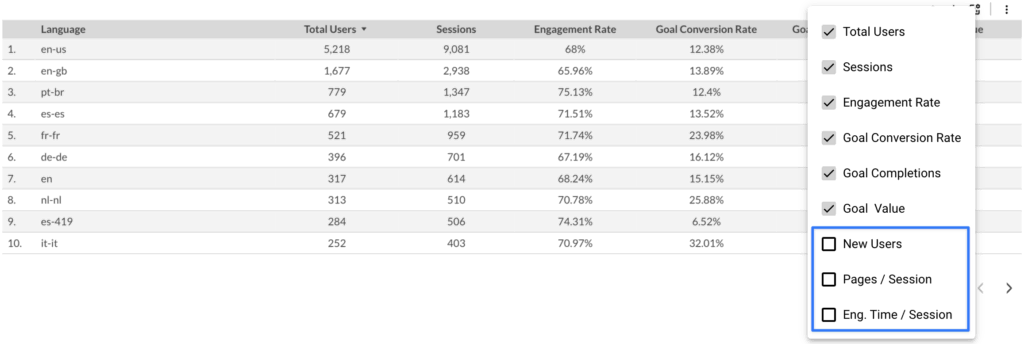
Tables
By using optional metrics in tables you can easily expand your data analysis including also some secondary metrics for your business.
Start Making the Most of Optional Metrics Today
Understanding how to use the data you have collected about your business is vital if you are really going to make the most of it.
Using optional metrics in Looker Studio is a great way to do this. This allows you to explore your business data more thoroughly and isolate specific data points for analysis. So that you can understand it and utilize it effectively.
Do you need help using Google Looker Studio optional metrics and understanding your business data? Then get in touch with Data Bloo now to find out more about our ready-to-use templates. We’re happy to help!