Table of Contents
Whether you’re tracking SEO, paid ads, ecommerce sales, or social media, Looker Studio dashboards help you visualize performance in real time — all in one place.
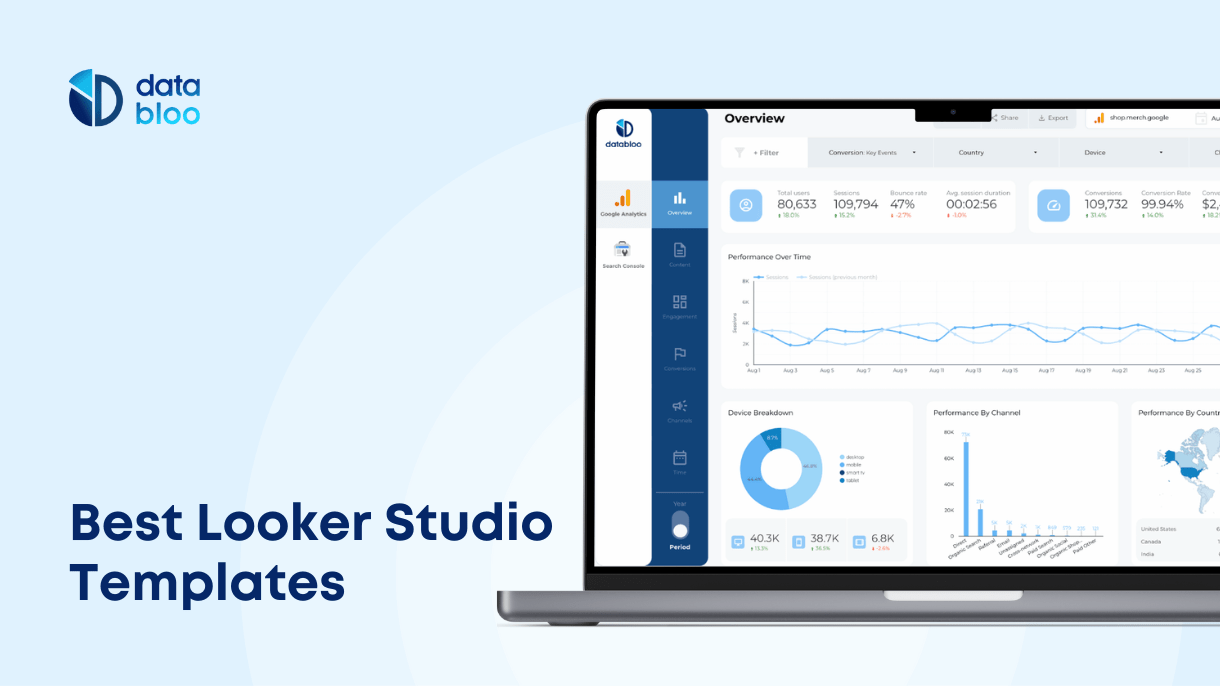
In this article, we’ll explore 12 Looker Studio dashboard examples designed to save you time, improve analysis, and inspire your next report layout. Each includes a live demo so you can preview the design, layout, and metrics in action.
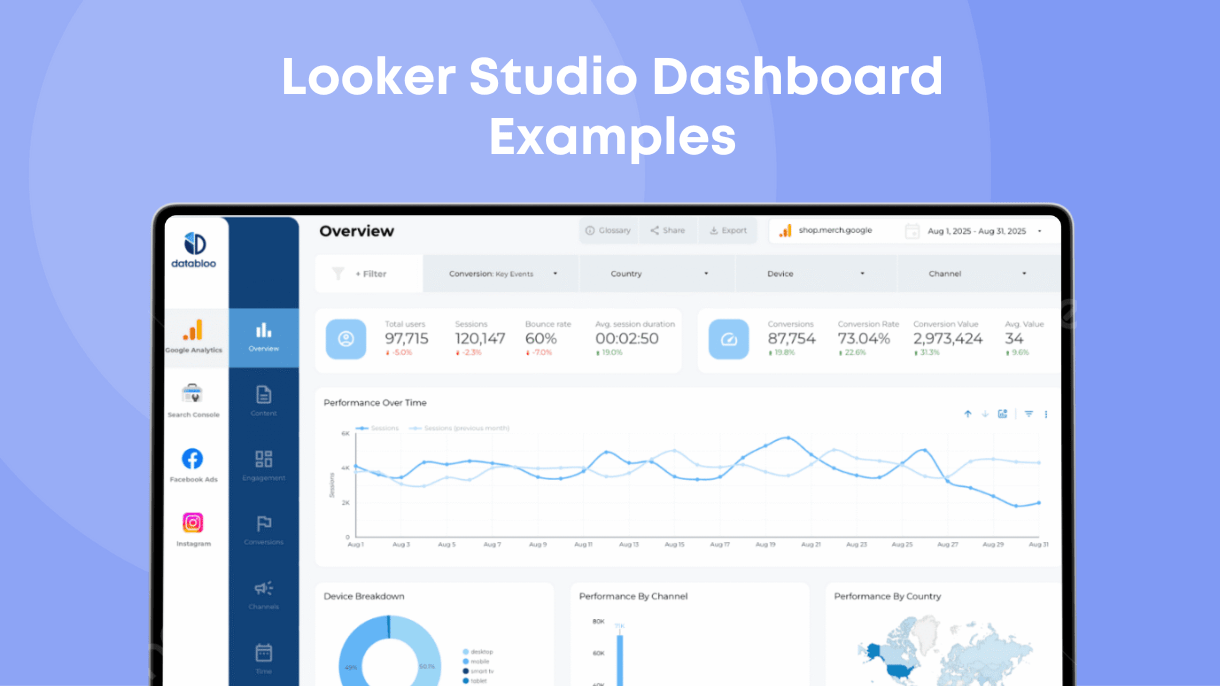
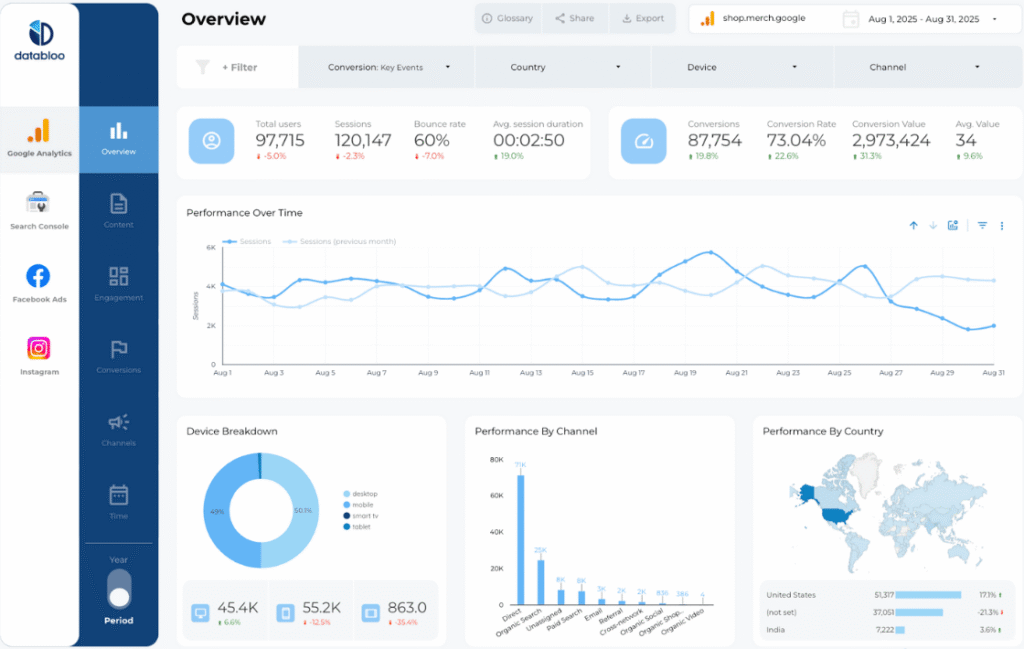
1) Google Analytics 4 Dashboard
Source: Google Analytics 4
Setup: Easy – Native Connector for GA4
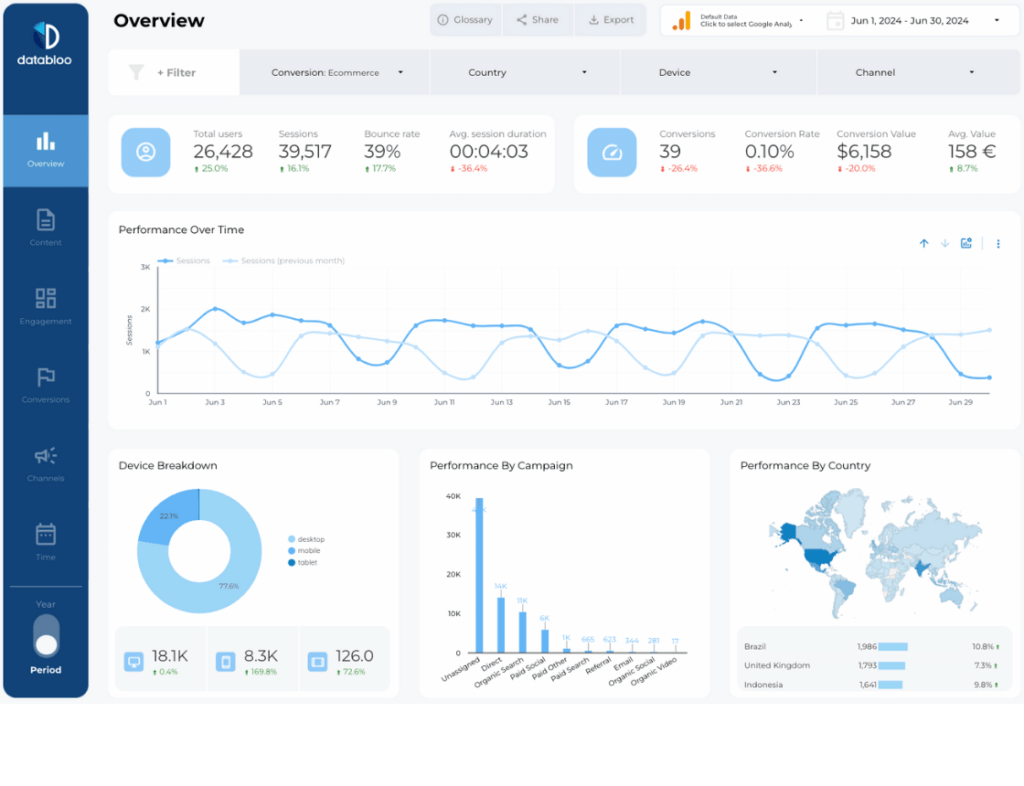
This Looker Studio dashboard connects directly with your GA4 property and provides a complete overview of your website’s performance — from traffic and engagement to conversions and revenue.
Key Features:
- Website performance overview (sessions, users, conversions)
- Content and landing page analysis
- Engagement and device breakdown
- Marketing channels comparison
- Ecommerce and conversion metrics
What You Can Do with This Dashboard:
This GA4 dashboard helps you spot traffic patterns, boost local SEO performance, and reinvent ecommerce KPIs. Easily track how traffic changes over time, identify which content or pages drive engagement, and detect underperforming areas to improve. You can analyze top-selling products, monitor conversion discrepancies between devices, and customize the design to fit your brand — all within minutes.
2) WooCommerce Dashboard
Source: WooCommerce
Setup: Easy – Data Bloo Free Connector for WooCommerce
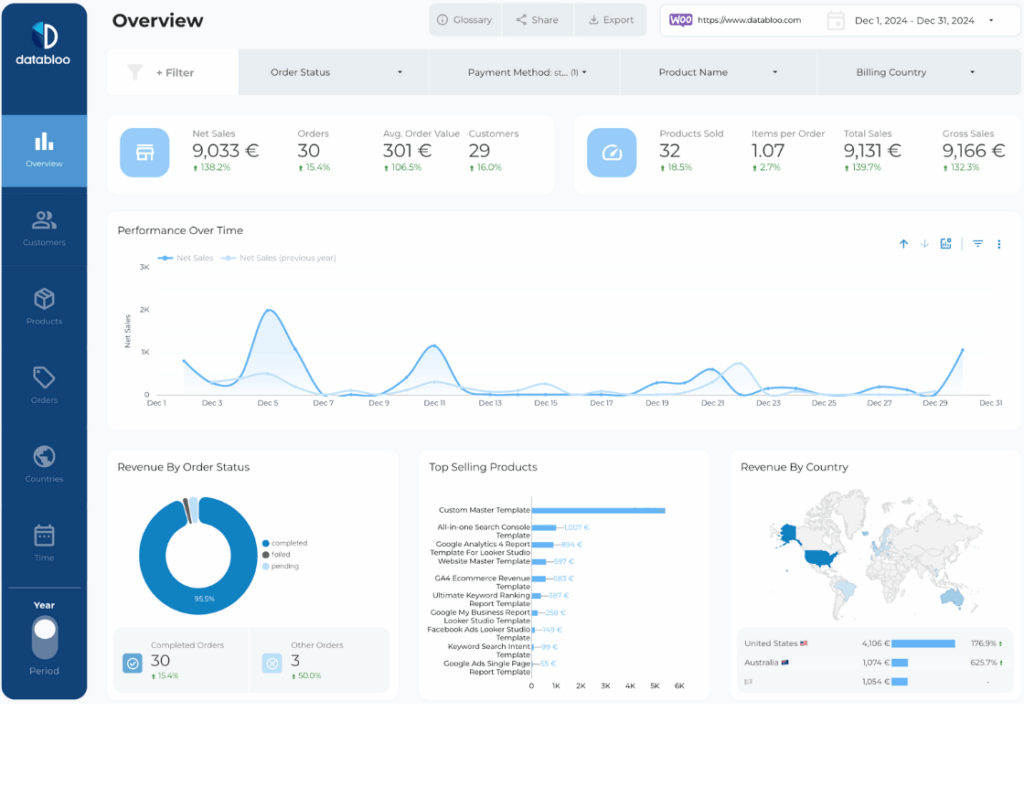
This ecommerce dashboard helps WooCommerce store owners monitor sales, orders, and product performance in real time. It combines data from customers and products to coupons and countries to provide an integrated view of your online store.
Key Features:
- Real-time sales and revenue overview
- Order tracking and customer insights (new vs returning)
- Top selling products and categories
- Top countries by revenue
- Payment methods and marketing coupons
What You Can Do with This Dashboard:
This dashboard gives you a complete overview of your store performance, letting you identify top-performing products, track order trends, and discover what drives conversions. You can easily detect location insights, refine your product strategy, and align marketing campaigns (coupon codes) with purchase behavior.
3) All-in-One Search Console Dashboard
Source: Google Search Console
Setup: Easy – Native Connector for GSC
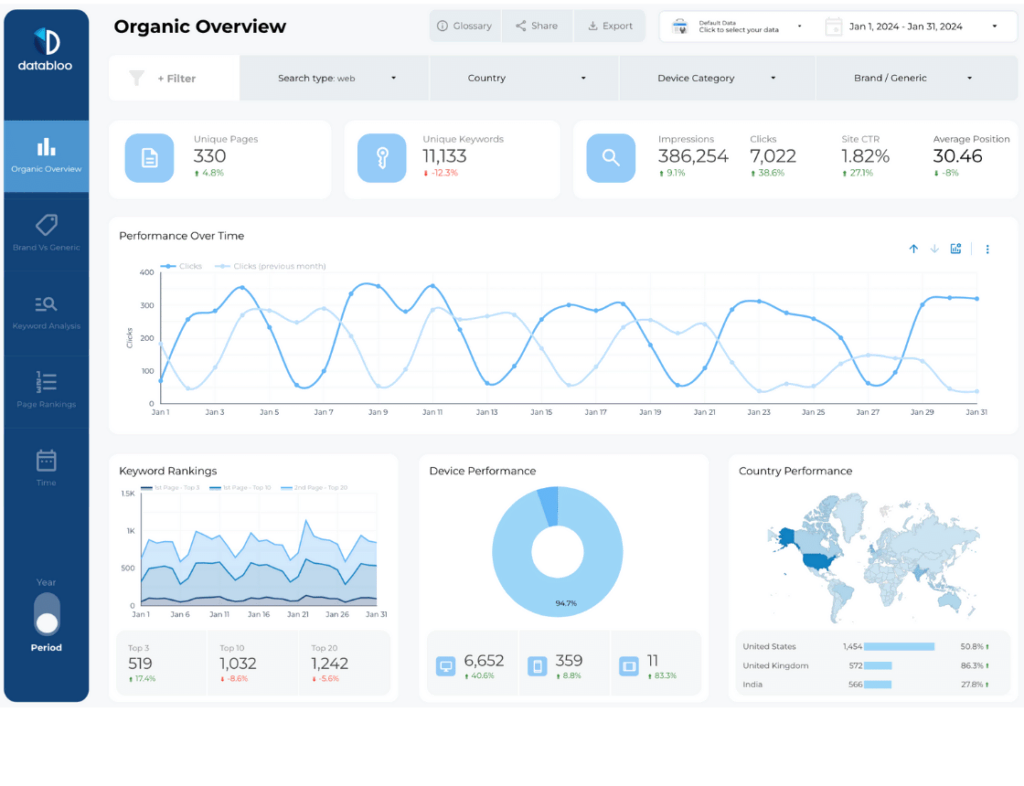
Analyze your organic search performance with this detailed dashboard that brings all key SEO metrics together — impressions, clicks, CTR, and average position.
Key Features:
- Keyword-level ranking distribution (Top 3, Top 10, Top 20)
- Brand vs. non-brand segmentation
- Landing page and device breakdowns
- Short vs Long tail analysis
- Year-over-year & period-over-period insights
What You Can Do with This Dashboard:
This dashboard helps you uncover keyword opportunities and track SEO visibility trends at scale. Discover which search queries bring the most traffic, which landing pages need optimization, and how rankings shift over time. Perfect for identifying high-potential keywords and improving your organic strategy.
4) Semrush Dashboard
Source: Semrush
Setup: Medium – Semrush Connector (only available to users on the Semrush Guru or Business plans)
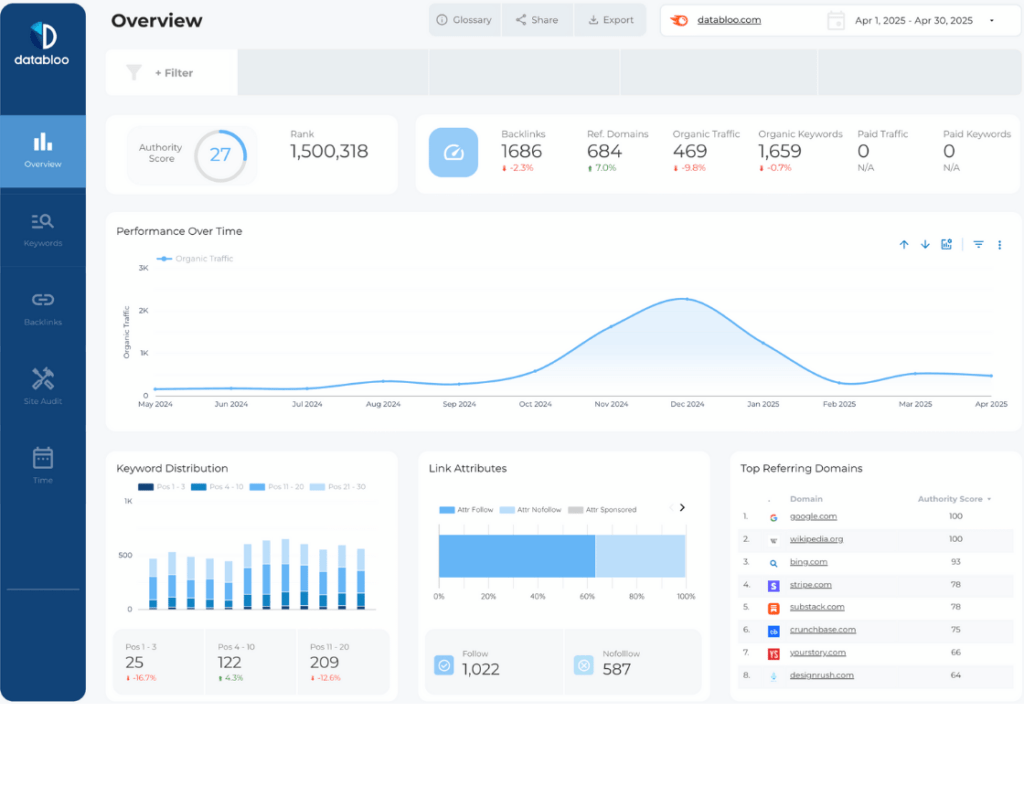
The Semrush Looker Studio dashboard visualizes your SEO data directly from Semrush, helping you monitor organic visibility, backlinks, and keyword performance in one unified report.
Key Features:
- Domain visibility and organic traffic trends
- Keyword rankings and difficulty
- Backlink overview and authority score
- Competitor performance comparison
- Top-performing pages
What You Can Do with This Dashboard:
This dashboard lets you analyze visibility trends and backlink performance while keeping tabs on competitors. It’s a perfect companion for content strategists and SEO professionals who need actionable insights about ranking shifts, keyword opportunities, and link growth without manually exporting data.
5) Ahrefs Dashboard
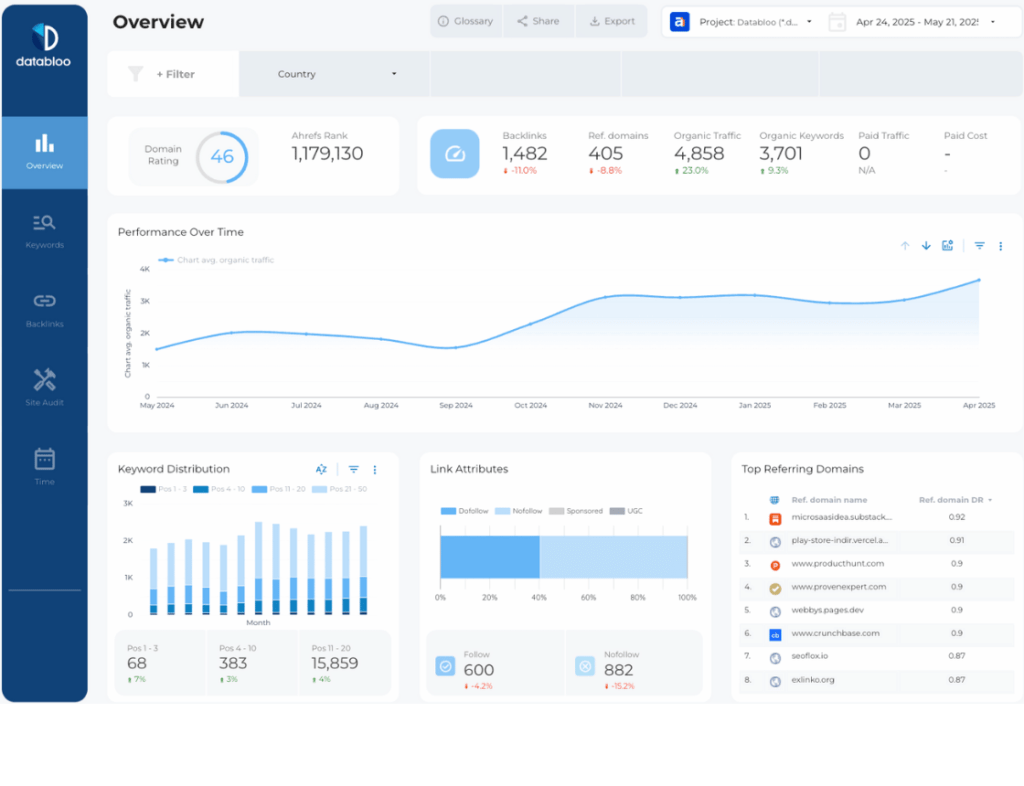
Source: Ahrefs
Setup: Medium – Ahrefs Connector (only available to users on the Ahrefs Advanced and Enterprise plans.)
Get a full overview of your organic visibility, backlinks, and keyword clusters with this Ahrefs Looker Studio dashboard. It connects your Ahrefs data directly for organic search tracking and backlink and domain analysis.
Key Features:
- Keyword grouping by position and SERP features
- Backlink and referring domain analysis
- Technical Site Audit
- Domain rating and anchors
- Historical performance tracking
What You Can Do with This Dashboard:
Use this dashboard to monitor your backlink profile, discover ranking opportunities, and evaluate keyword competitiveness. It’s ideal for content and outreach teams aiming to strengthen authority, track link-building progress, and refine their organic growth strategy.
6) Google My Business Dashboard
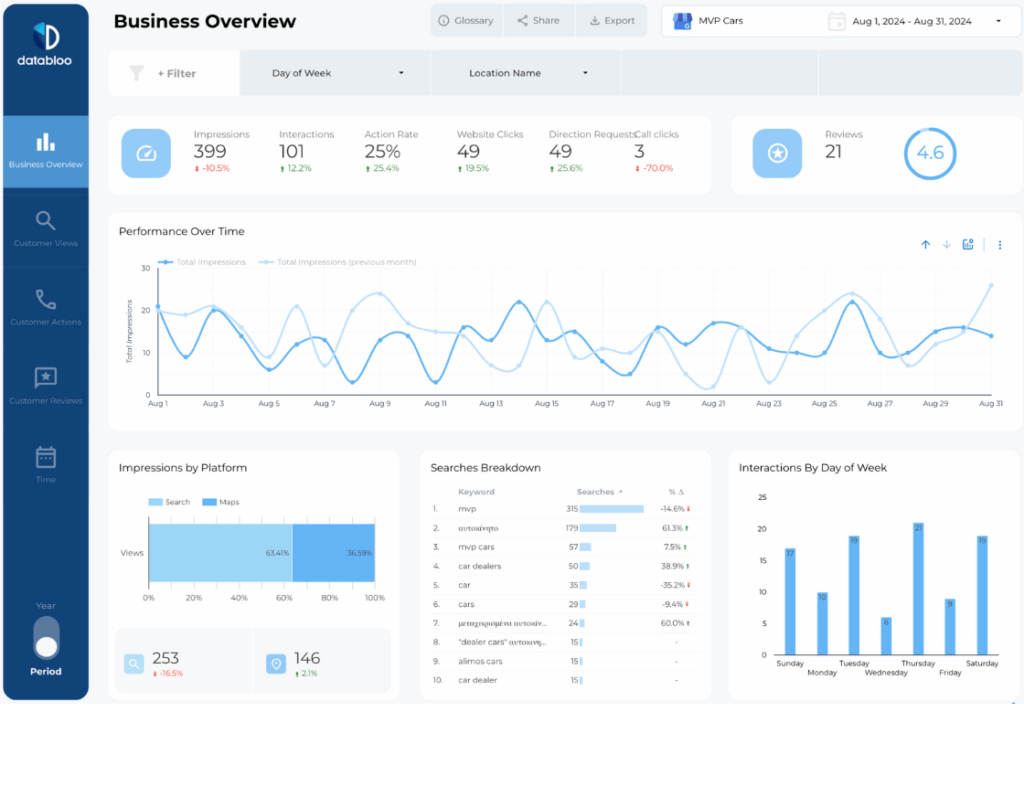
Source: Google My Business
Setup: Easy – Data Bloo Free Connector for GMB
Monitor your local business visibility on Google Search and Maps with this dashboard that tracks how customers discover, interact with your business. Also the dashboard monitors reviews and ratings, to help you gain and retain high-value customers.
Key Features:
- Total searches and views (Maps + Search)
- Customer actions (calls, directions, website clicks)
- Review trends and average ratings
- Top-performing locations
- User searches and volumes
What You Can Do with This Dashboard:
This dashboard helps you understand how your local audience interacts with your business listing. Track engagement trends, measure visibility across regions, and identify which locations or keywords drive the most interactions to optimize your local SEO strategy.
7) Google Ads Dashboard
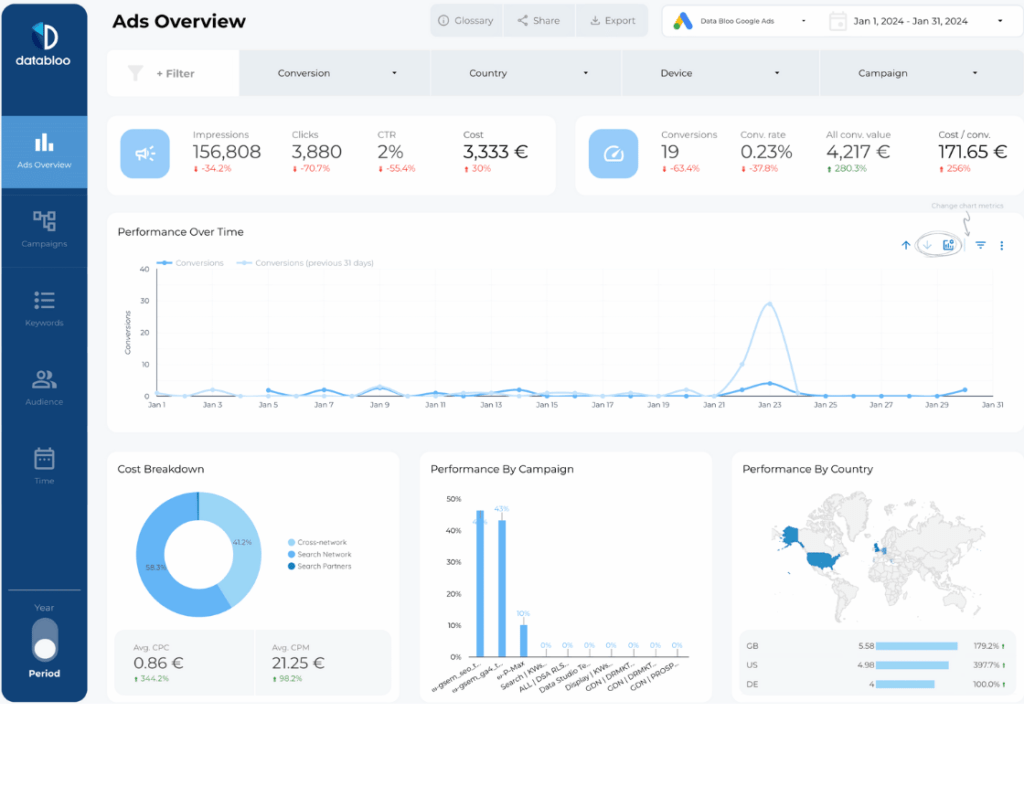
Source: Google Ads
Setup: Easy – Native Connector for Google Ads
This performance-focused dashboard visualizes your paid search and display campaigns in a clear, actionable way, helping you track results, ROI, and audience insights.
Key Features:
- Campaign, keyword, and landing page reporting
- Audience segmentation (audience type, demographics, location)
- Budget and cost tracking
- Conversion and ROI analysis
- Search and display campaigns breakdown
What You Can Do with This Dashboard:
This dashboard lets you evaluate ad performance and spending efficiency. You can track top-performing keywords, understand conversion costs by campaign or audience, and quickly adjust bidding or targeting to maximize ROI.
8) Facebook Ads Dashboard
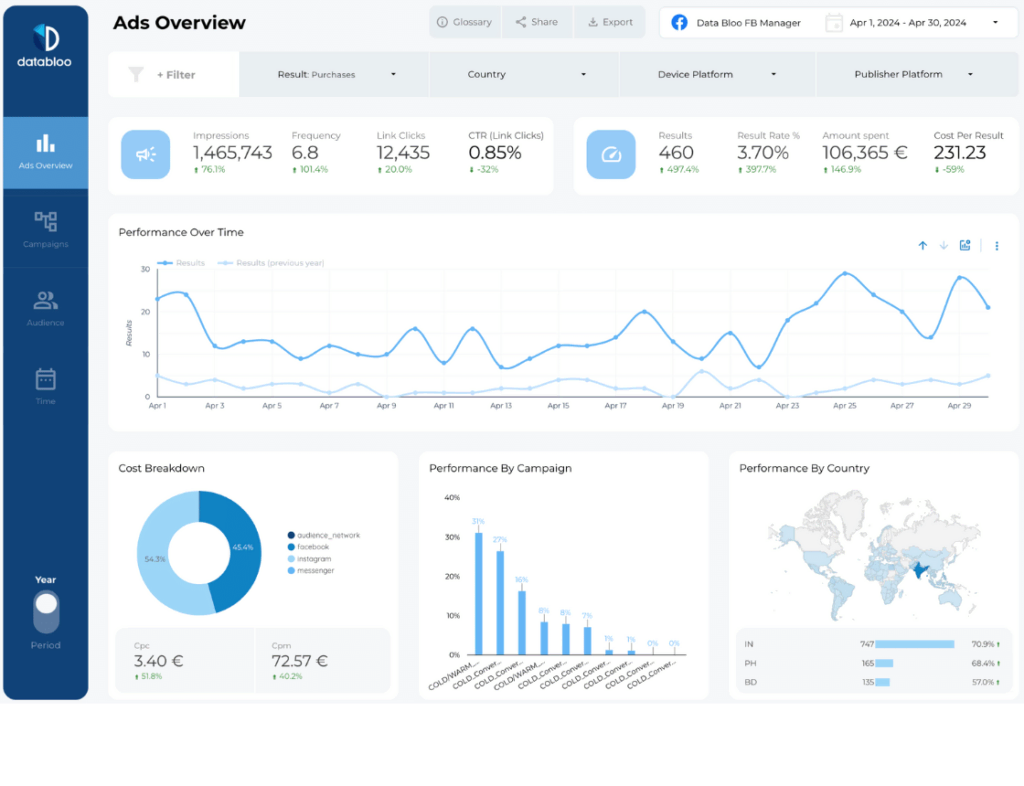
Source: Meta (Facebook & Instagram Ads)
Setup: Easy – Data Bloo Free Connector for Meta
Easily monitor Facebook and Instagram campaign results using this ready-to-use dashboard. It consolidates ad performance across all platforms for fast analysis.
Key Features:
- Campaign and ad set results
- Results by location and region
- Ad spend and cost per result
- Platform-level breakdown (Facebook, Instagram)
- Audience demographics
What You Can Do with This Dashboard:
This dashboard helps you measure paid social ROI and creative performance. You can compare how campaigns perform across Meta platforms, detect underperforming ads, and optimize budget allocation based on cost and conversion data.
9) Instagram Insights Dashboard
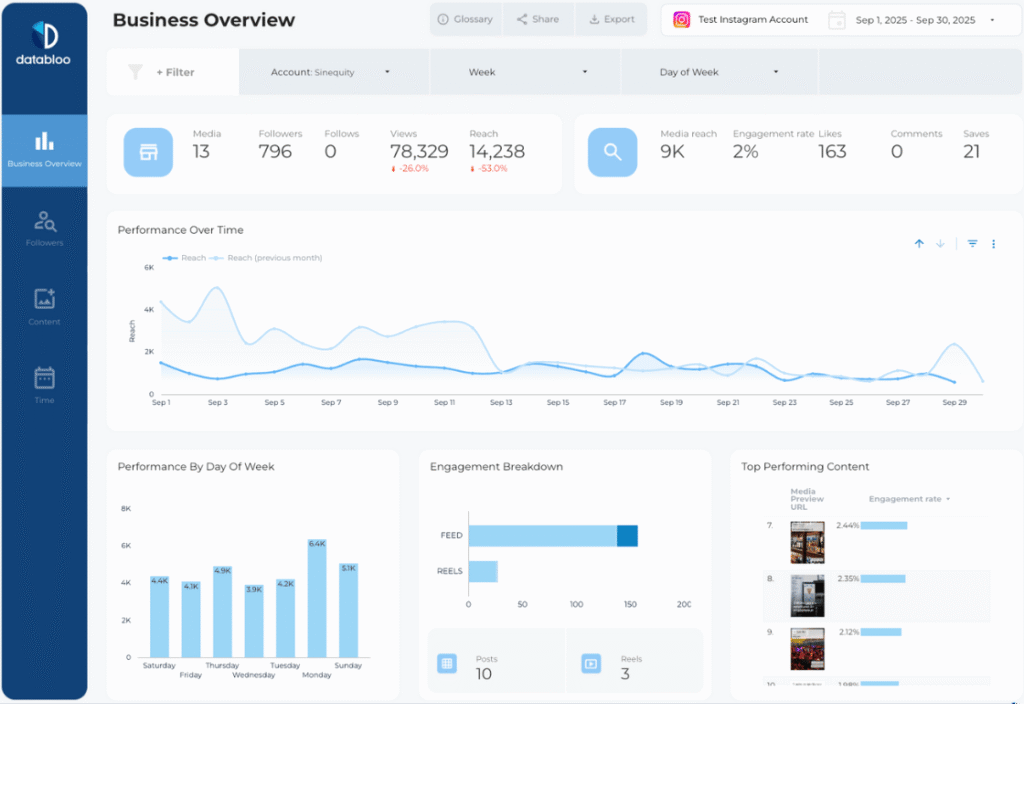
Source: Instagram Insights
Setup: Easy – Data Bloo Free Connector for Instagram
Track your Instagram account performance in Looker Studio with real-time metrics on content, followers, and engagement trends.
Key Features:
- Follower growth and engagement rate
- Performance by content type (Reels, Posts, Stories)
- Follower demographics and top locations
- Reach, impressions, and saved posts
- Most engaging content
What You Can Do with This Dashboard:
This dashboard helps you understand what drives engagement on your account. Identify which content types perform best, analyze when your audience is most active, and refine your posting strategy to boost reach and follower growth.
10) LinkedIn Company Page Dashboard
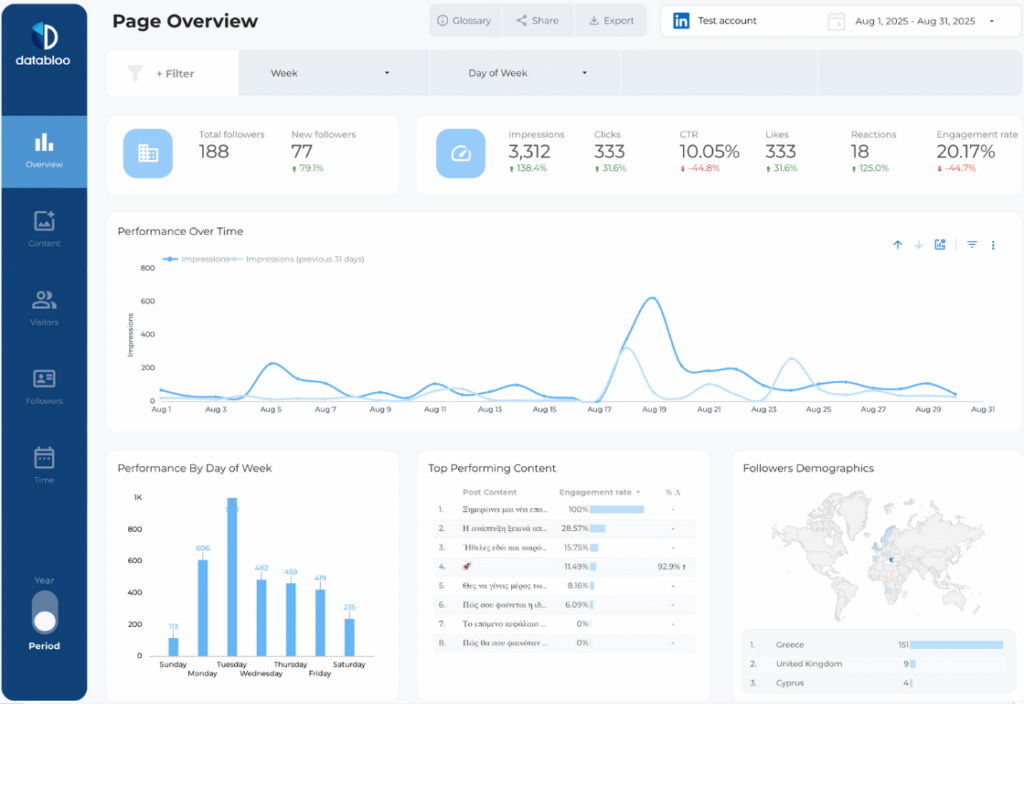
Source: LinkedIn Company Pages
Setup: Easy – Data Bloo Free Connector for LinkedIn
Get a clear picture of your company’s LinkedIn activity, including post performance, follower demographics, and page engagement trends.
Key Features:
- Page views, impressions, and engagement metrics
- Post-level analytics
- Follower growth over time
- Demographic breakdown (location, industry, job title)
- Organic vs paid post comparison
What You Can Do with This Dashboard:
Use this dashboard to track audience growth and engagement trends on LinkedIn. You can measure how your content performs with different audience segments, evaluate which post types drive interaction, and refine your B2B social strategy.
11) All-in-One Custom Master Template
Source: Multiple Sources (GA4, GSC, Ads, Social, Ecommerce)
Setup: Easy – Combine Your Own Data Sources
The Custom Master Template lets you combine all your key data sources into one multi-channel dashboard, creating a complete performance overview across marketing, SEO, ecommerce, and social media.
Key Features:
- Multi-source integration (GA4, GSC, Ads, Facebook, Instagram)
- Fully customizable layout and navigation
- YoY and PoP comparison toggle
- Branding and white-label design options
- One-click setup and easy sharing
What You Can Do with This Dashboard:
This dashboard helps you see the big picture by bringing all your performance metrics into one place. You can analyze how different channels interact, identify cross-channel trends, and share an all-in-one report that aligns your team around data-driven goals.
12) AI & LLM Report Template
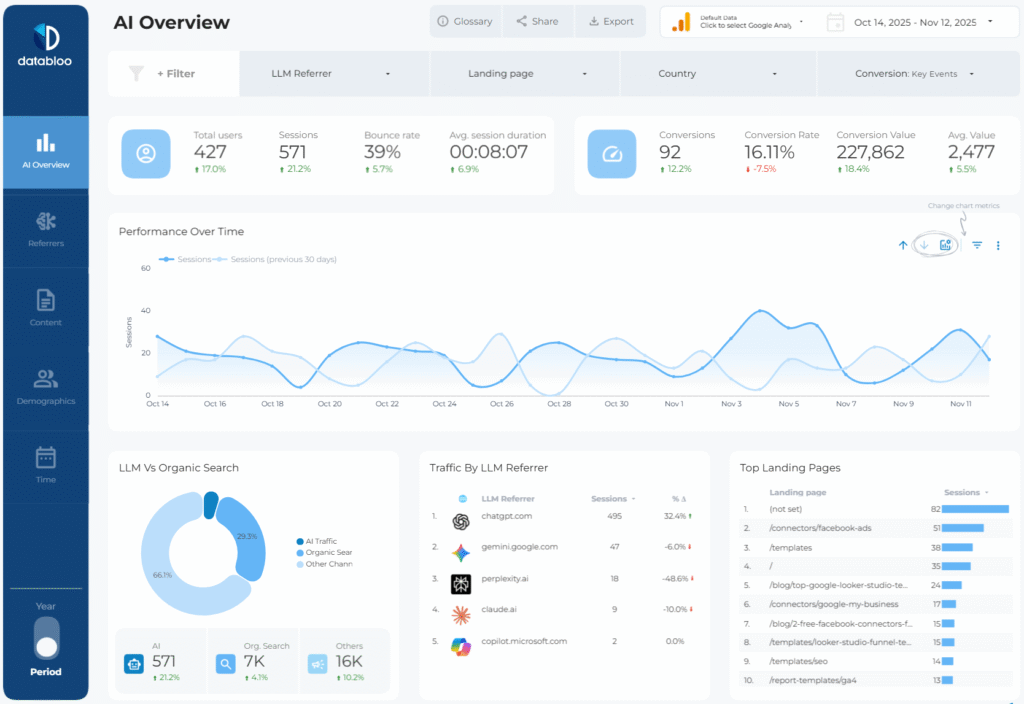
Source: Google Analytics (AI Traffic + User Behavior)
Setup: Easy — One-click GA4 connection
Key Features:
- AI User Acquisition Metrics
- LLM Referrer Breakdown (ChatGPT, Claude, Perplexity & more)
- Content-Level Insights (AI-Surfaced Pages)
- Conversions & Revenue From AI Traffic
- Device & Location Trends for AI Visitors
- AI vs Organic Search Comparison
What You Can Do with This Dashboard:
This dashboard allows you to understand how AI assistants discover, reference, and send visitors to your website. You can identify the pages most frequently surfaced in AI-generated answers, compare engagement across different AI tools, and track whether AI-driven visibility is increasing over time.
Build Your Own Looker Studio Dashboard
These dashboard examples show what’s possible when design meets data. Whether you’re tracking SEO rankings, ad performance, or ecommerce revenue, Looker Studio gives you full control over layout, branding, and automation.
Explore more templates in our gallery and start building your own dashboard in minutes — no coding or design skills needed.