Table of Contents
Is there a perfect content marketing dashboard?
You want to track the most valuable content metrics, from page views and sessions to conversions, yet all your data is scattered across different charts, hard to make sense of, and even confuses people when you try and share your content reports up the chain.
A perfect dashboard should give you actionable data at the right moment, while being easy to navigate and understand for different stakeholders.
In this article, we’ll look at what you should have for a perfect content marketing dashboard, the basic metrics and advanced KPIs that give you more granular data.
What Makes Up a Good Content Marketing Dashboard?
In marketing, a dashboard that gives you a comprehensive snapshot of your key performance indicators (KPIs) is crucial to demonstrate the impact of your content marketing efforts on business.
A good content marketing dashboard should complement your content marketing strategy by giving you data-driven insights into the effectiveness of your content efforts.
Essentially the dashboard should include audience metrics like traffic sources, content performance such as page views, SEO metrics such as keyword rankings, and conversion metrics such as leads generated.
Here are the pros of a good content marketing dashboard:
- Easy to understand for various stakeholders. An intuitive content marketing dashboard offers a visual representation of complex data, making it easier to understand and interpret with clarity for colleagues from other departments and C-level managers alike.
- Real-time insights. You can track your content performance in real-time and make adjustments based on trends and data.
- Single source of truth. A properly compiled content marketing dashboard consolidates data from various sources into a centralized location for quick decision-making.
- Deep insights into audience behavior. Combining content metrics from different channels in a smart way lets you get deep insights into audience behavior that you otherwise would not notice. Track multiple KPIs to understand your audience behavior and measure ROI of your content.
A badly designed content marketing dashboard can make it hard to get the right insights. When selecting a dashboard, look out for these flaws:
- Cluttered interface with too many elements that are hard to read which can overwhelm users.
- Limited integration and customization. It should integrate with relevant tools and platforms like GA4 and GSC.
- Tracks vanity metrics like number of articles published, content length and follower count while leaving out engagement and conversion.
Ideally, the content marketing dashboard you select should be customizable, easy to use and show the latest data for a clear picture.
Most Important Sections to Include in a Content Marketing Dashboard
A content marketing dashboard is your digital command center for understanding your marketing metrics.
And, a 2022 State of Marketing Report by Salesforce revealed that 72% of high-performing marketers rely on real-time analysis to determine their marketing performance.
Let’s look at what you should include in your content marketing dashboard:
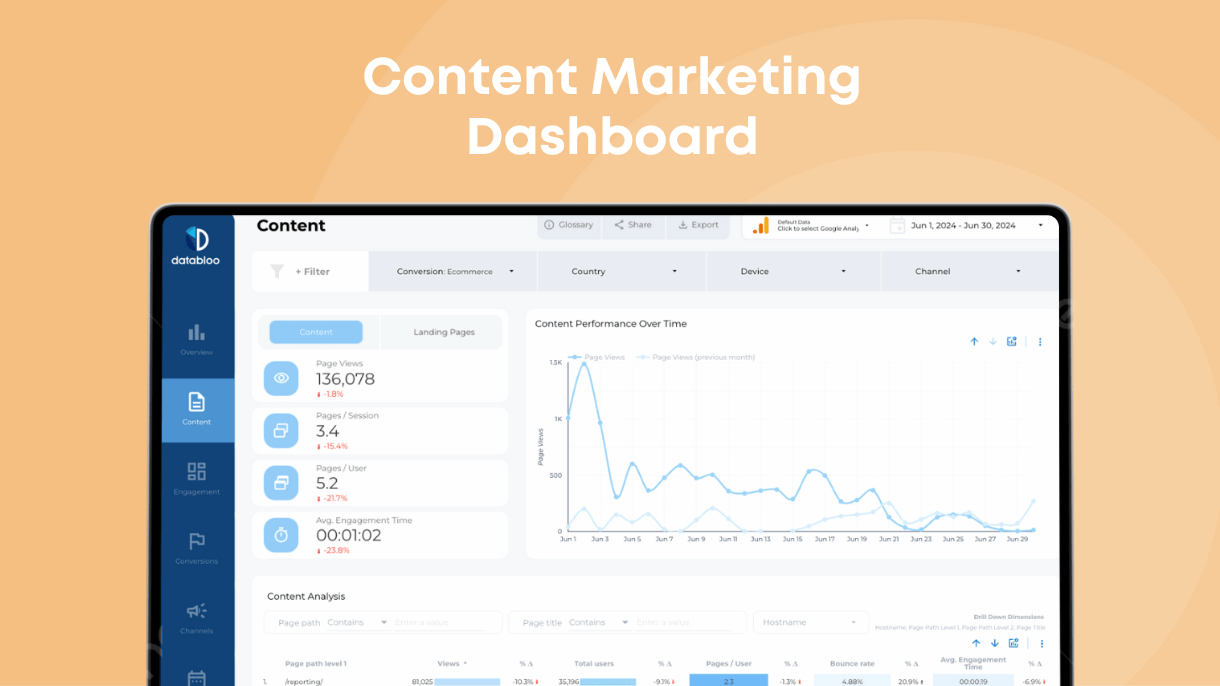
Page Views
Page Views are the total number of times users view a particular page. This metric indicates the popularity, level of interest and engagement of a certain piece of content or page.
By tracking your Page Views, you can determine the effectiveness of your content formats, styles, individual content writers and entire content production pipelines.
Page Views show you patterns of audience preference and engagement. For instance, if a particular writer consistently generates higher page views than others, it indicates that the audience resonates with that writer’s style or their approach to topic research lands more organic rankings in search engines. You can also contrast page views across various content formats (such as articles, videos) to learn what your audience prefers.
By using page view data, you can experiment with different styles, adjust your content production pipeline and deliver the most relevant content to your audience.
Page views also correlate to other metrics. For instance:
- Time on page. High page views with low time on page may indicate a lack of engagement.
- Scroll depth. High page views combined with deep scrolls show engaging content.
- Bounce rate. High page views with low bounce rates show content resonance.
- Click-through rate (CTR). Higher page views and low CTR indicate a need for better conversion optimization.
You can also use page views for the historical analysis of your content marketing efforts.
Plotting the data for an extended period allows you to identify sudden spikes or drops to understand the seasonality and external influence on your content. For instance, promotional activities can create a spike in page views for individual pages or entire content clusters.
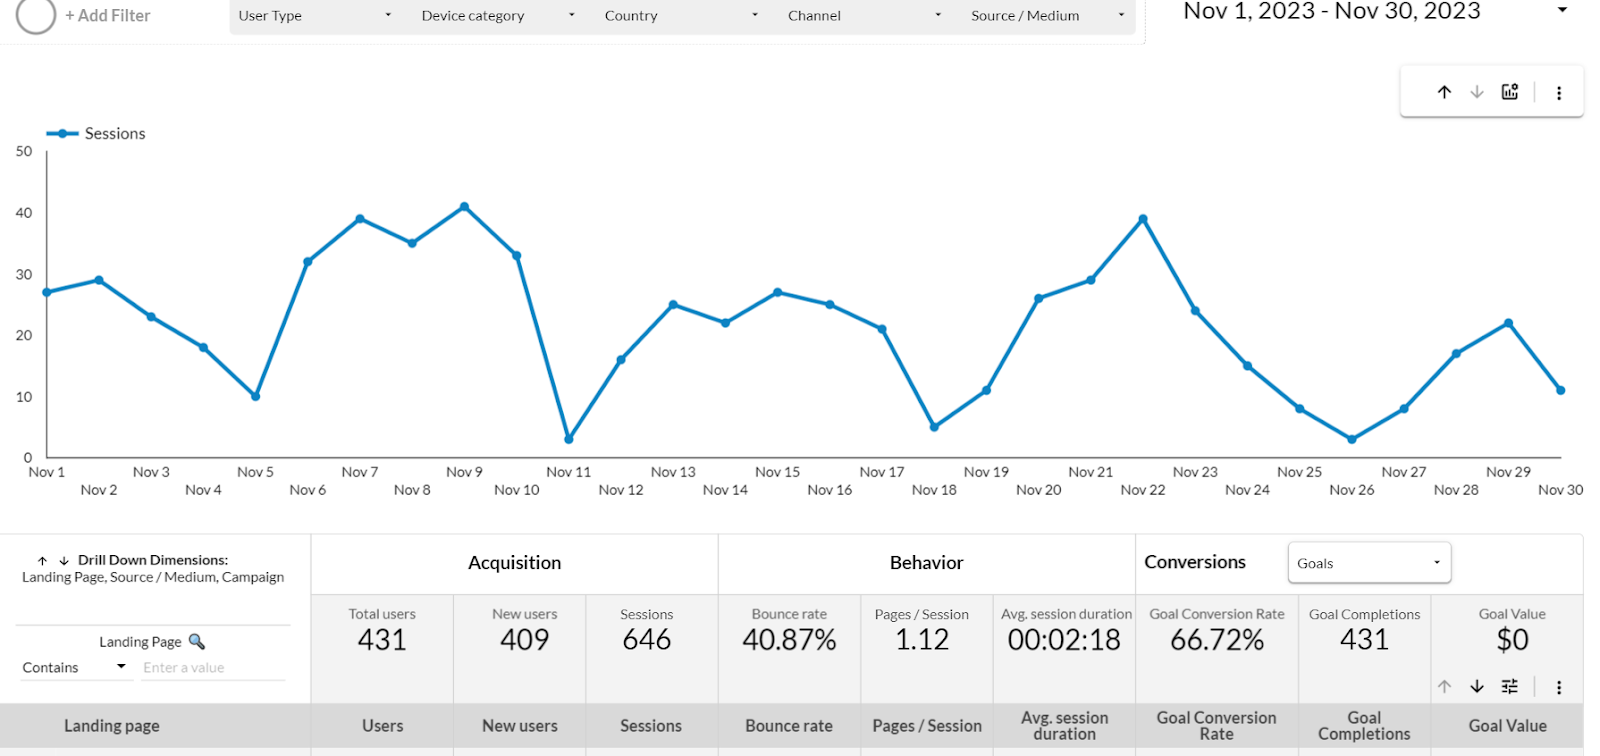
Sessions
Sessions are the period of time a user is actively engaged with your website or app.
Sessions show how users engage with your content, including how frequently they return. You can know the level of interest, identify peak engagement periods, and overall success and performance of your content.
If you’re using Universal Analytics (UA), Google uses a user-centric time-based model to determine sessions. Typically, a session ends after 30 minutes of user inactivity, with a focus on pageviews and interactions within the sessions.
With Google Analytics 4 (GA4), Google adopts an event-centric model to determine a session. A session begins at the first user engagement and persists until there are 30 minutes of inactivity or a new day begins.
With enhanced features like native user-ID tracking, scrolls, outbound clicks, etc., GA4 Sessions make it easier to understand user journeys across different platforms and devices.
You can migrate from UA to GA4 easily and track your sessions with precision. Here’s an example of a content marketing dashboard with data extracted from GA4.
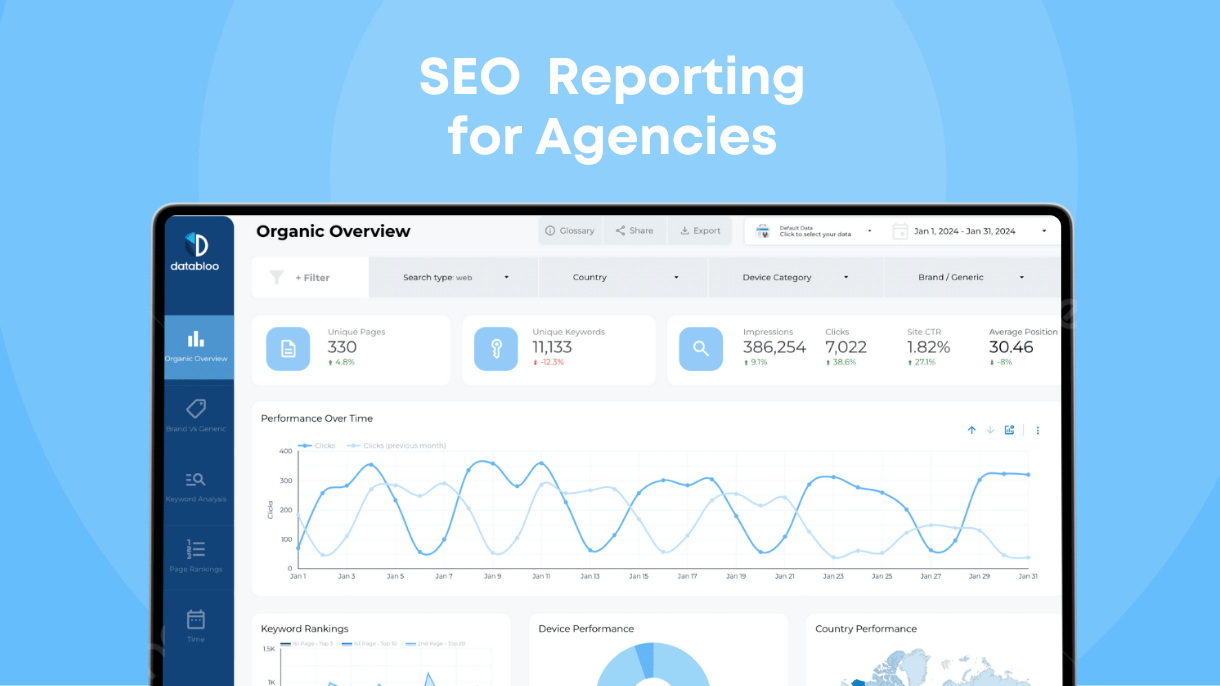
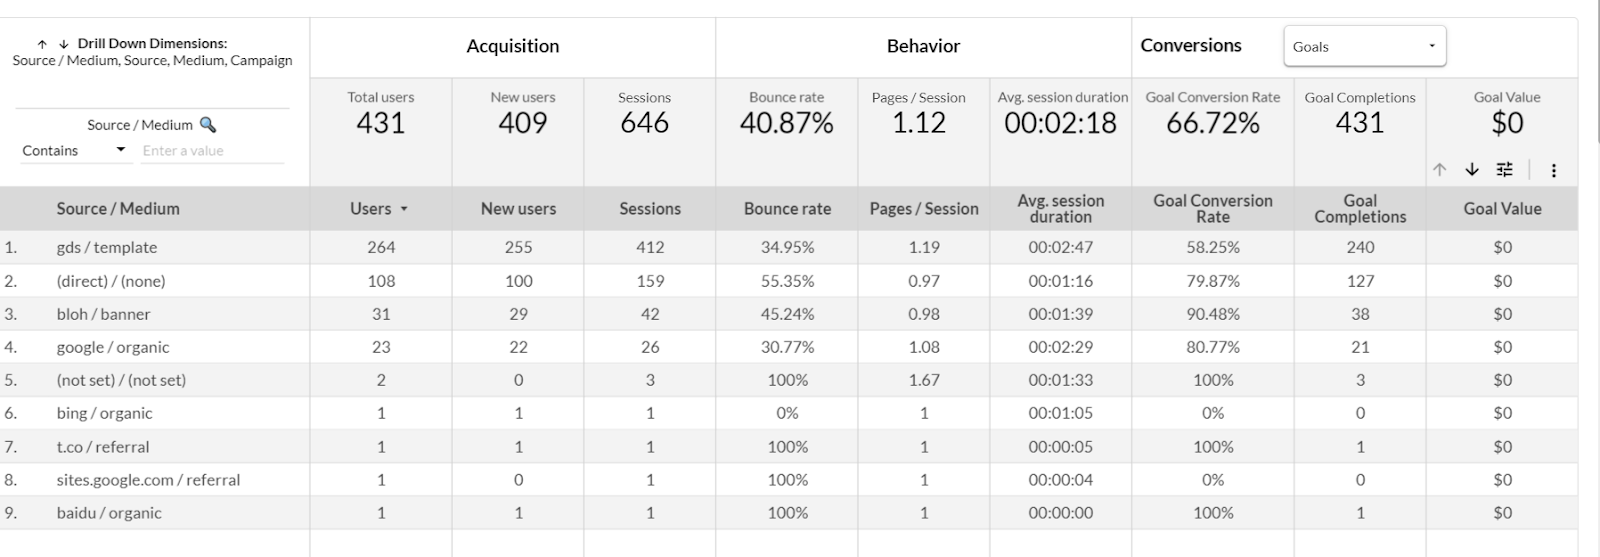
Traffic Sources
For most websites, the goal is to generate traffic that can be converted into a stream of customers.
Understanding where your traffic comes from helps you optimize different channels and allocate resources accordingly. You also know the effectiveness of your content distribution strategy and the overall success of your content marketing efforts.
Different traffic sources include direct traffic, referral traffic, organic search traffic, email traffic, social media traffic and others.
Here are various ways traffic sources are essential in your content marketing dashboard:
- Conversion rate by traffic source. This shows you how efficient different channels are in converting visitors into customers.
- Traffic source trend analysis. Helps you identify emerging patterns for potential growth.
- Device type impact on traffic sources. You can optimize content for user preferences, behavior and overall user experience across various devices.
- Referral quality by traffic source. You can compare high-authority sites with smaller niche sites that give you higher engagement or conversion and know what to focus on.
Here’s a sample of a Content marketing dashboard showing traffic sources.
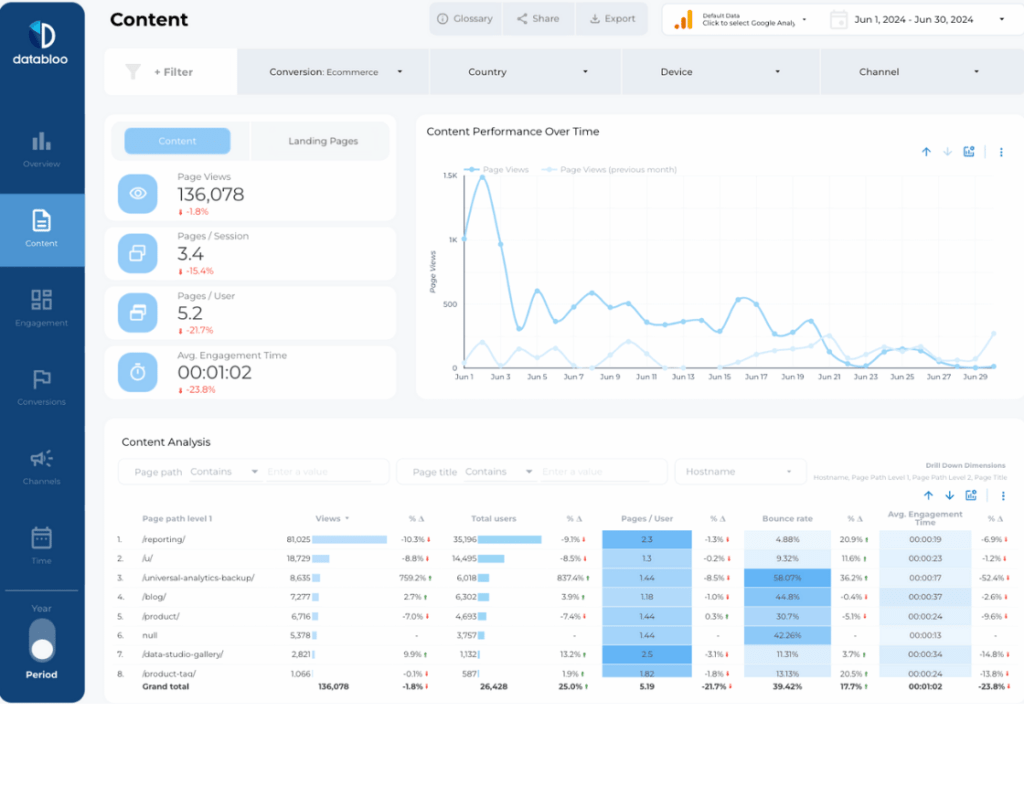
Traffic sources on your content marketing dashboard are a powerful tool for decision marketing.
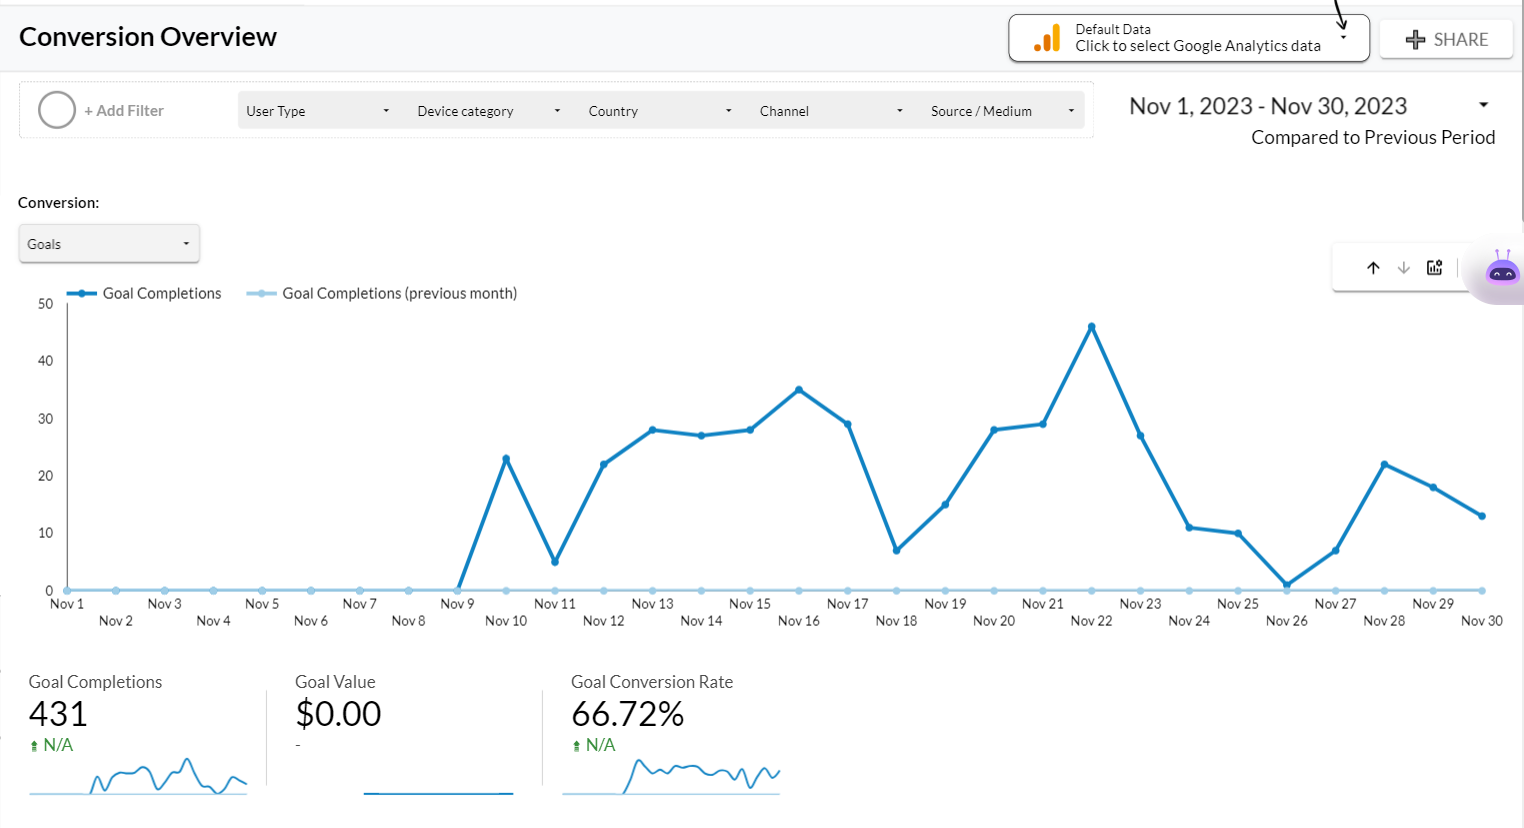
Conversion
What action would you like your user to take after interacting with your content? Buy a product, fill out a form, subscribe to a newsletter, sign up for a demo, etc.
That’s conversion — the desired actions your user takes that align with your content marketing campaigns’ goals.
Conversions directly indicate the success of your content marketing strategy, showing the effectiveness of your content in motivating users to take action.
Tracking conversion rates in your content marketing dashboards helps you:
- Measure the performance of your content qualitatively.
- Access the ROI of your content marketing strategy.
- Pinpoint high-performing content and replicate your successful content strategies.
- Determine the alignment of content to your business goals.
- Easily demonstrate content value to stakeholders.
Let’s look at a conversion dashboard in terms of goal completion.
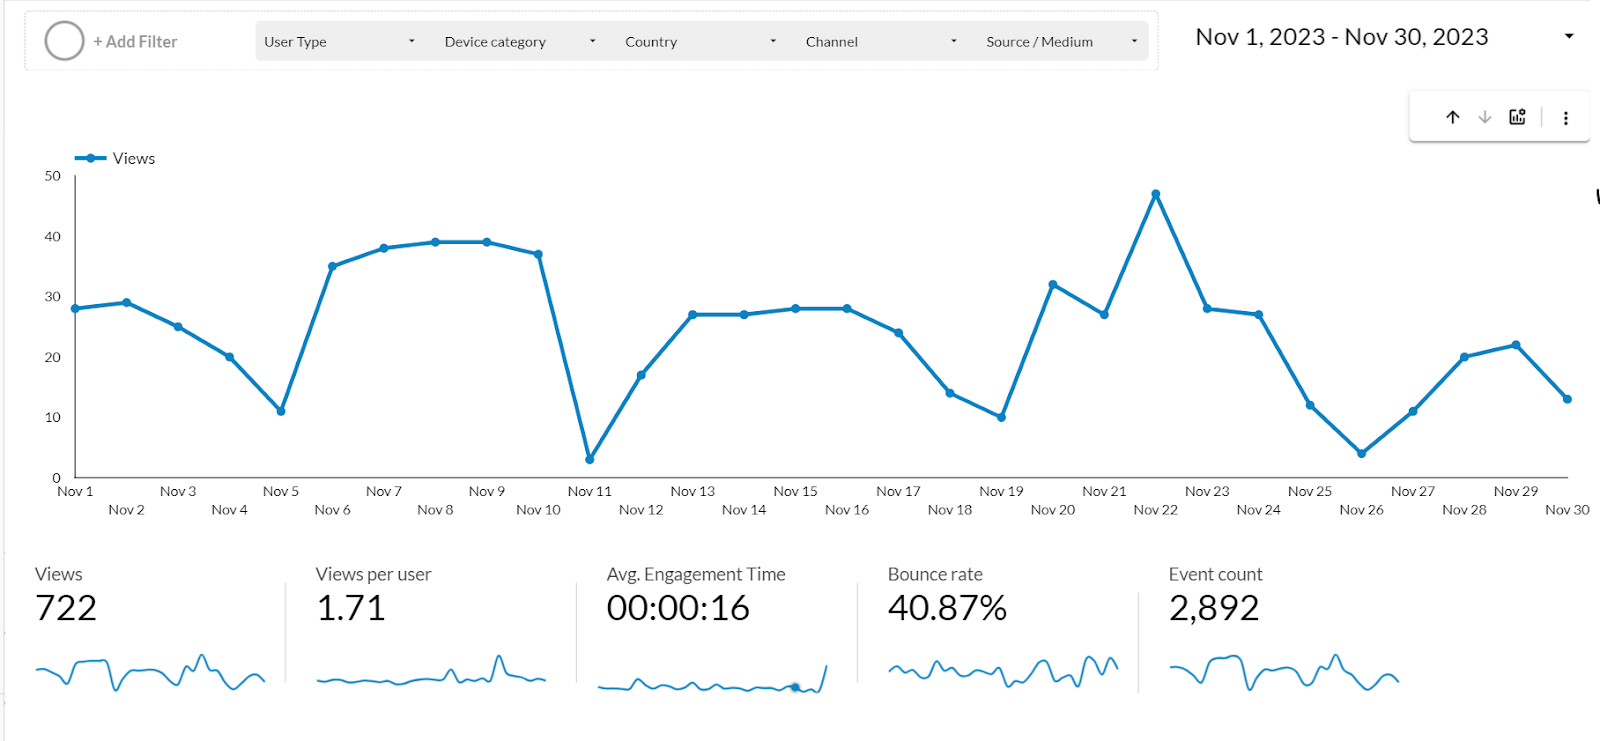
Bounce Rate
Bounce rate is the percentage of visitors who leave your site after viewing only one page or before interacting with the page they landed on.
A high bounce rate may indicate that visitors are not finding what they expected or your content isn’t engaging enough.
Having your bounce rate on your content marketing dashboard helps you evaluate the relevance and appeal of your content or landing pages.
Here’s a dashboard indicating the bounce rate.
Average Session Duration
The average session duration is the average time users spend on your site during a single session. The longer the time users spend on your website, the higher the average session duration.
Adding this metric to your content marketing dashboard helps you know if your content is holding your audience’s attention.
A survey by Databox put the average session duration at 77 seconds for B2B companies and 92 seconds for B2C companies.
Country
The Country metric shows you the geographical location of your visitors. Often displayed as a list of countries, helps you understand your target audience better.
You can come up with localization opportunities by tailoring your content to specific regions and demographics.
You can also optimize your content marketing and advertising strategies for specific regions.
Device
This metric shows you the types of devices (e.g., desktop, mobile, tablet) your visitors use to access your website.
Device metric helps you understand consumption patterns.
You can tailor your content strategy and optimize content for a better user experience by ensuring compatibility and readability across different screen sizes and resolutions.
Advanced Metrics
In addition to having the above metrics on your content marketing dashboard, you can add some advanced metrics that can give you deeper insights into your content performance.
While these metrics are optional, they become crucial in decision-making. Let’s look at some advanced metrics you can add to your content marketing dashboard:
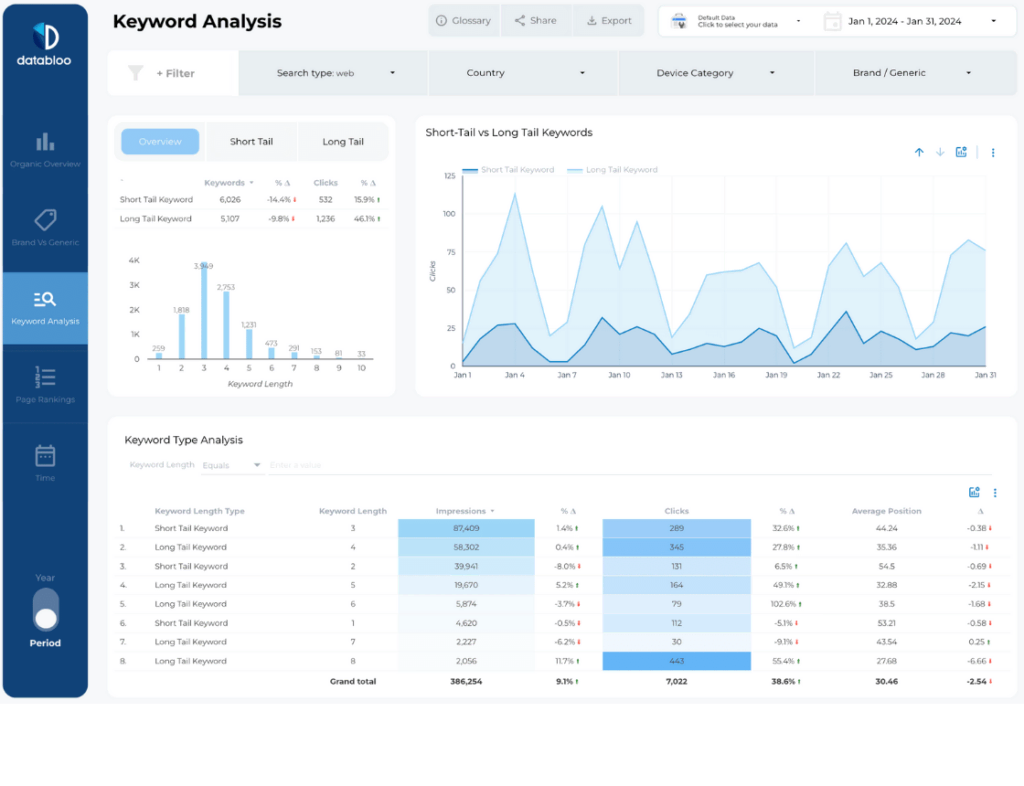
Top Performing Keywords
Displaying the keywords that drive most of your traffic and engagement gives you insights into what your audience is searching for.
Knowing the top-performing keywords is especially important for SEO-focused content strategies. You can optimize your content for better performance by using the terms and phrases that resonate best with your audience.
Here’s an example of a dashboard with the top-performing keywords.
Content Amplification Ratio by Channel
Content amplification is the process of increasing the reach and visibility of your content by using online channels and platforms for content distribution.
When investing time and resources in various distribution channels like social media, email newsletters or partner websites, it’s important to know how each is performing.
Tracking your content amplification ratio gives you a clear picture of your most effective distribution channels for resource allocation.
Bounce Rate by Referral Source
Adding this metric to your content marketing dashboard helps identify the quality of traffic from various channels. It’s a valuable metric when trying to refine your content promotion strategy.
You can segment different referral sources (search engines, social media, direct traffic) and find the traffic source that gives you the most engaged visitors.
Here’s an example of a dashboard comparing the bounce rate from referral sources metric.
Engagement Rate by Content Type
Different types of content resonate differently with audiences, and you can identify the most effective content formats.
This metric groups content by different attributes (listicles, thought leaderships, articles containing videos vs non etc.) and measures the engagement rates (likes, shares, comments), across different content types (articles, videos, infographics).
Create the Perfect Content Marketing Dashboard
As you determine the effectiveness of your content strategy, you want a dashboard that shows accurate data. You also want it to have the most important KPIs like conversions, bounce rate, sessions and time on page.
And, the dashboard should present data in a visually appealing way with a user-friendly design for stakeholder alignment. It should also allow for real-time updates to help you optimize your content strategy effectively.
Click here to view a demo of our content marketing dashboard.