Table of Contents
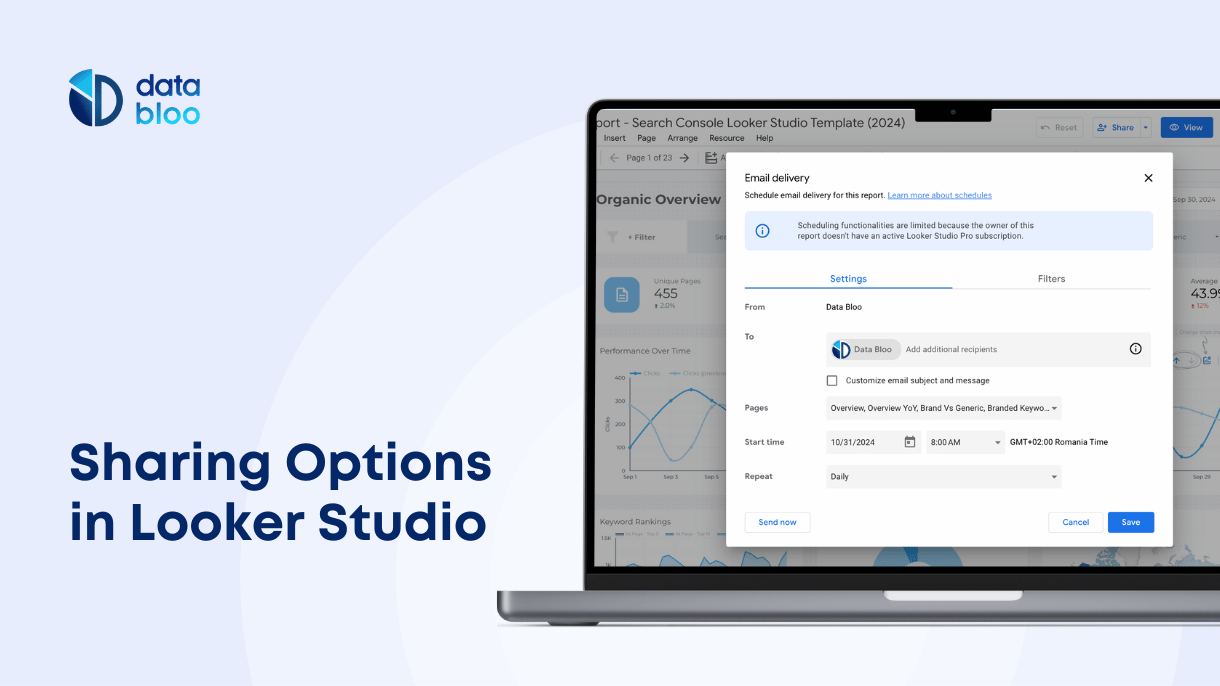
Do you design presentations for your business or team projects? If so, you should check out Google Looker Studio (previously Data Studio) to make custom graphs and charts that stand out.
The key to effective visualizations is consistency and uniformity. Choosing the right format for your visualization may be subjective, but that choice needs to be reflected in all of your spreadsheets and charts.
Google Looker Studio date format makes it so that you can set up the format you want and apply it to your entire graph or chart. It also allows you to hone in on data fields based on certain time frames and date formats, such as years, quarters, weeks, etc.
Keep reading to learn how to properly use the Google Data Studio date format.
Setting the Google Looker Studio Date Format
Looer Studio allows you to compare and visualize data using many different methods. This tool allows you to compare sets of data by groups based on the date and time. Formatted data tables can all be formatted the same way.
You want your date to be formatted correctly to make sense. For better data visualizations, here is some important information you should know.
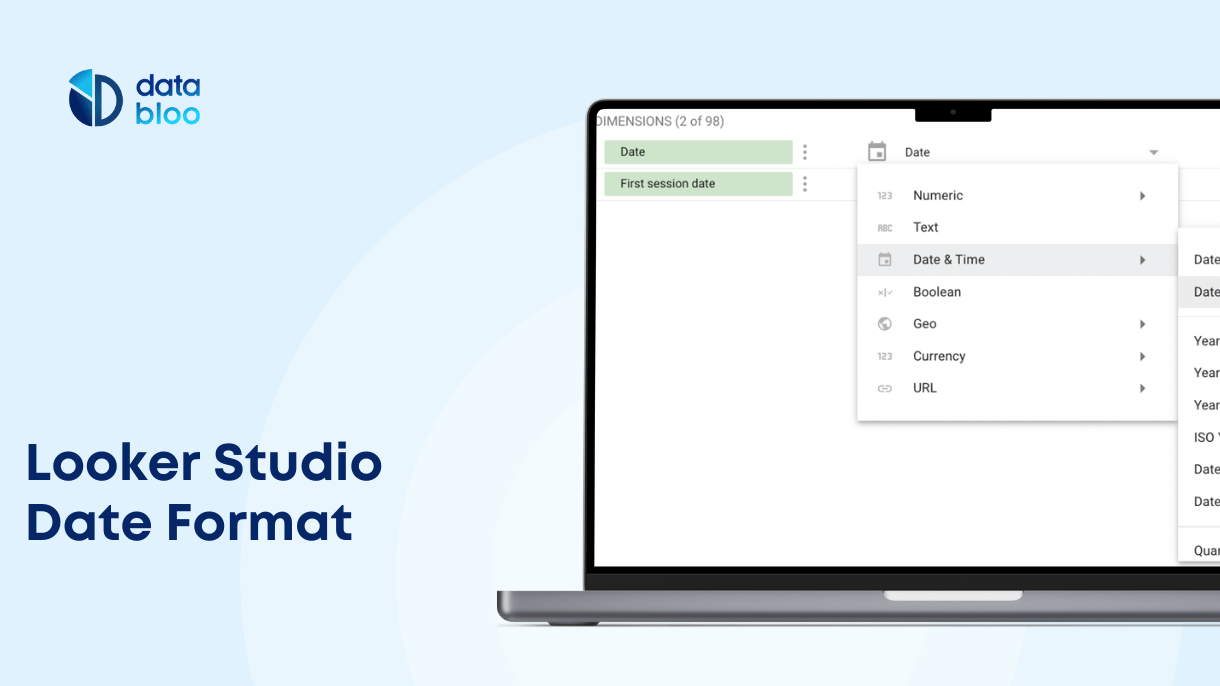
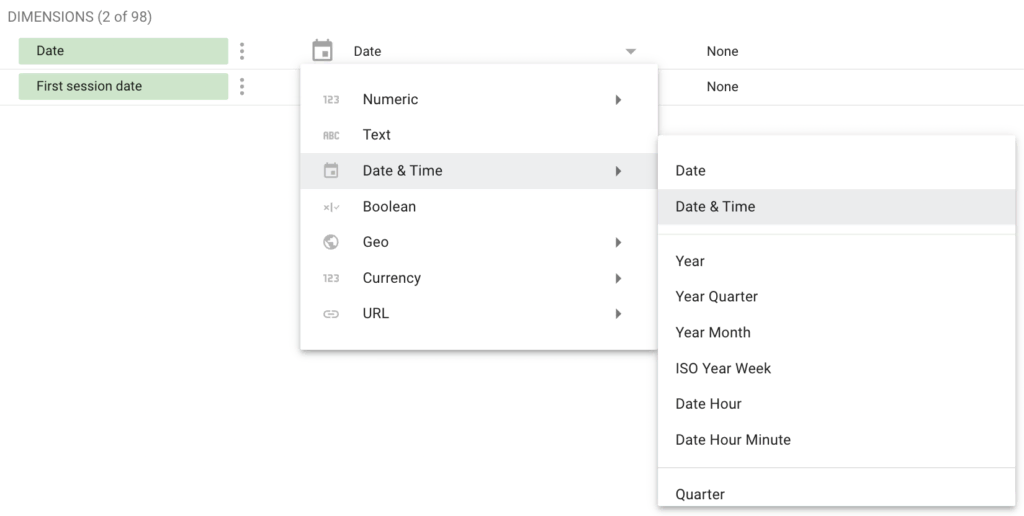
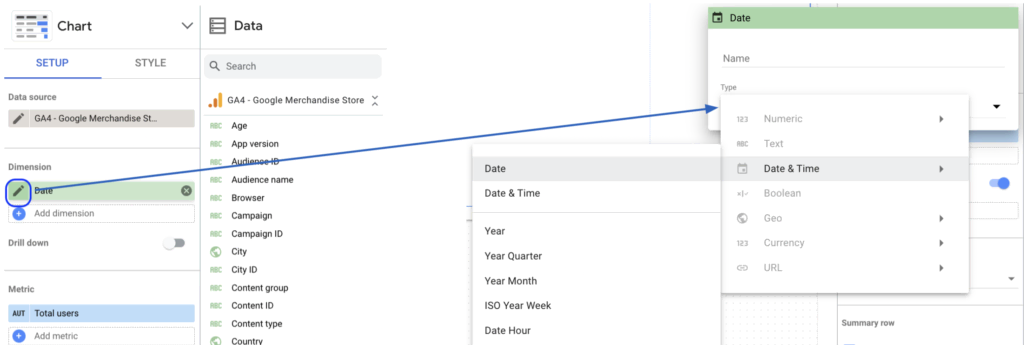
Date and Time Types
Looker Studio supports a variety of different types for formatting the date and time. You can see a detailed table with the available formats below.
| Date & Time Type | Example |
| Year | 2022 |
| Year Quarter | Q3 2022 |
| Quarter | Q3 |
| Year Month | Aug 2022 |
| Month | August |
| ISO Year Week | Aug 29, 2022 to Sep 4, 2022 (Week 36) |
| ISO Week | Week 36 |
| Date | Aug 31, 2022 |
| Month Day | Aug 31 |
| Day of Week | Wednesday |
| Day of Month | 31 |
| Date & Time | Aug 31, 2022, 3:15:39 AM |
| Date Hour | Aug 31, 2022, 3 AM |
| Hour | 3 AM |
| Date Hour Minute | Aug 31, 2022, 3:15 AM |
| Minute | 15 |
These date and time types allow you to be general when comparing times across a wide range. Or you can zoom in on the most specific aspects of the hour or to the minute.
Looker Studio also has several ways that you can display the date or compare data sets by the specific date. You can see some more examples for formatting the date below:
- 2022
- Q3 2022
- Aug 2022
This Looker Studio date format allows you to narrow in even closer to a very specific type of date or categorize your data sets by these date types. You can see these examples below:
- Quarter- Q3
- Month- August
- ISO Week- Week 36
- Month Day- Aug 31
- Day of Week- Wednesday
- Day of Month- 31
Looker Studio offers two ways for changing the date and time type in the data field. You can change the date type by finding those options in the “Data Sources” tab. Also, you can make those changes in the tabs for the specific component.
How to Format Dates in Compatibility Mode
How do you format dates from data sources before a specific date? In Looker Studio, dimensions that measure date and time before the date of September 15, 2020 automatically defer to the Date & Time (Compatibility Mode) data type.
The two options for editing types in compatibility mode are Granularity and Type. You can adjust data groups based on granularity within the date menu.
To adjust compatibility by type, you can update the date & time format so that all data sets match the format. This way you don’t have some data using the compatibility mode (old formatting), mixed in with data using different updated data types.
Once you’ve signed into Looker Studio, the following steps to upgrade your data field go as follows:
- Edit your data source
- Find the compatibility mode date field to convert
- On the Right, click Type
- Then select Date or Date & Time
- Select the type you want
- A dialog box will appear to click Upgrade
You can also upgrade the Looker Studio date formats by adjusting different fields manually. You can type in the functions like DATETIME_ADD, DATETIME_DIFF, and EXTRACT, along with many other options.
How to Display the Current Date Using Calculated Fields
To do this, you want to create an entirely new field to calculate the current date. Start by selecting “Add a Field,” where you then manually type in CURRENT_DATE ().
Then you want to specify which time zone to use, otherwise, the system defaults to the UTC time zone. You can do this in the following two ways:
- Typing in the Time Zone Name CURRENT_DATE (“America/Los Angeles, CA”)
- Using the Zone Offset Method CURRENT_DATE (“+4”)
The zone offset method serves as the option with the highest usability. Report editors find it easier to understand and read more quickly because it’s written in a more direct format.
How to Format Date for Looker Studio in Google Sheets
The data formatting in Google Looker Studio doesn’t automatically transfer over to Google Sheets. Mainly because Google Sheets defaults to the formatting used across the globe. The US format for a date is MM/DD/YYYY, whereas the format outside the US is DD/MM/YYYY.
These steps allow you to format all the dates on a spreadsheet to be compatible with Google Looker Studio.
First, highlight and select all the boxes with the data sets using the American date format. You then click through the following Format menu options:
- Format Menu >> Number >> More Formats >> Custom Date and Time
You then select which year-month-day format you wish to use, and then click “Apply.” Now Google Looker Studio will be able to read the data in your data sources and charts.
Defaulting to the format of YYYY-MM-DD functions as the best standard practice for dates written in Google Looker Studio. Formatting the year first allows the data sets to group more easily.
Improve Readability for Visualizations with Date and Formats
Data analysis runs smoothly when you use the right tools to organize and present your data sets cleanly and in a logical way that the eye can follow. The person reading the report should be able to quickly discern spreadsheets and charts because everything follows a pattern.
Google Looker Studio date formats make all the data sets in the date and time category align together in one format. This also helps perform functions and makes sure the formulas run properly. The best and most efficient visualizations work as automated functions that are easy to edit and add to.
Visit Data Bloo’s site to see how our tools help you with setting up data visualizations.