Table of Contents
What is a Heatmap
Heatmap or Heat Map is an amazing way to discover what your users are clicking and how they are navigating your website. Especially, if you have many elements such as buttons and forms on your website, a heat map solution should be part of your toolset.
There are many great Heatmap tools out there and the most popular are Hotjar and CrazyEgg. But all these tools have monthly subscriptions. Why pay when you can have a heatmap tool using the free products of Google. The good part is that you pay once (much less than the annual subscription fees), only for the Dashboard and the implementation part (Google Tag Manager) or you can create it yourself if you feel comfortable with the setup. Additionally, this solution is applicable to different environments, from online retail stores to blog and news sites.
Heat Map using Google Looker Studio
Google Looker Studio (previous Data Studio) is an excellent tool to help you present and analyze your heatmap data. With this free cloud-based platform you can create nice dashboards showing your users’ clicks across different pages of your website. Connecting your Google Analytics account with Looker Studio, you can create your own Heat Maps that will give you a deep understanding of your users and how they are interacting with the different content of your website.
Heat Map Requirements
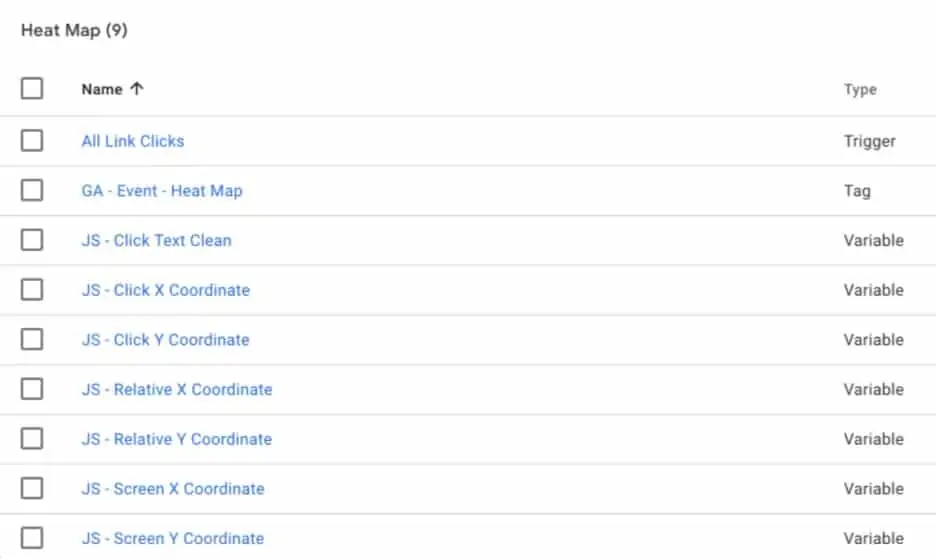
In order to collect and visualize the Heat Map data, you should make the appropriate configuration actions on Google Tag Manager, Google Analytics and Google Looker Studio.
- Google Tag Manager Events – the setup of custom event tracking on Google Tag Manager in order to collect the heatmap clicks.
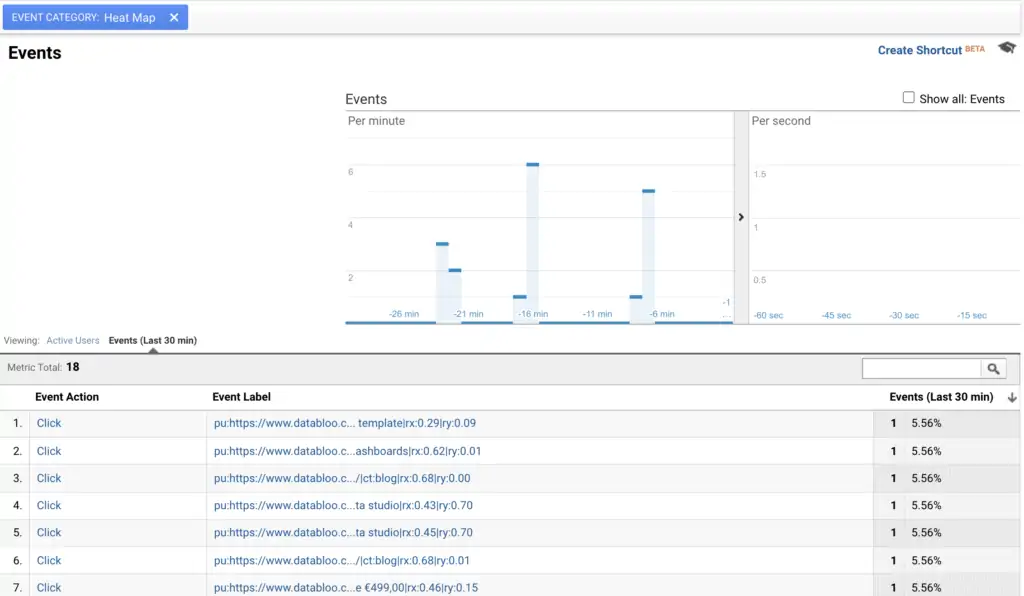
- Google Analytics Check – the tracking of new events in real time report in order to double check the collection of the appropriate heat map data (per click).
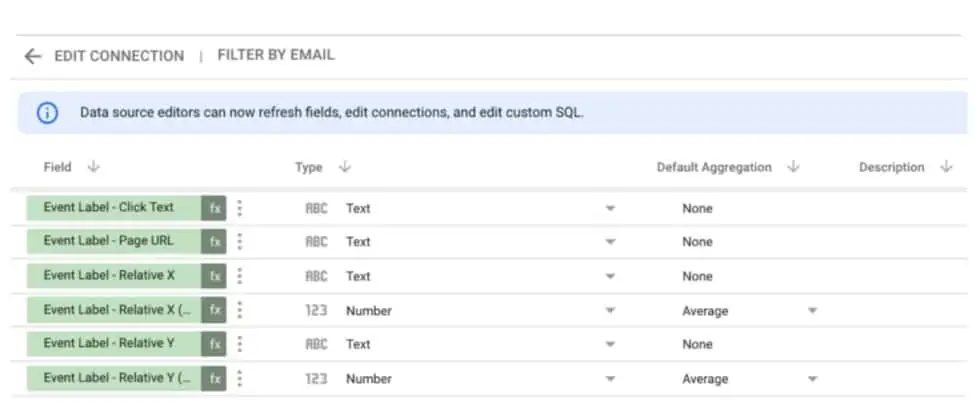
- Looker Studio Dimensions – the creation of custom fields on Looker Studio in order to convert the coordinates of clicks into metrics.
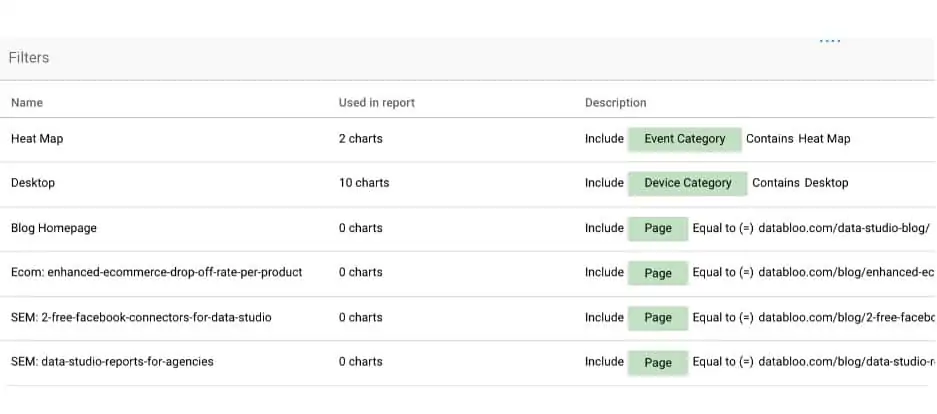
- Looker Studio Filters – the creation of filters on Looker Studio in order to include heatmap data from a specific section of the website.
The Key Elements of a Heat Map
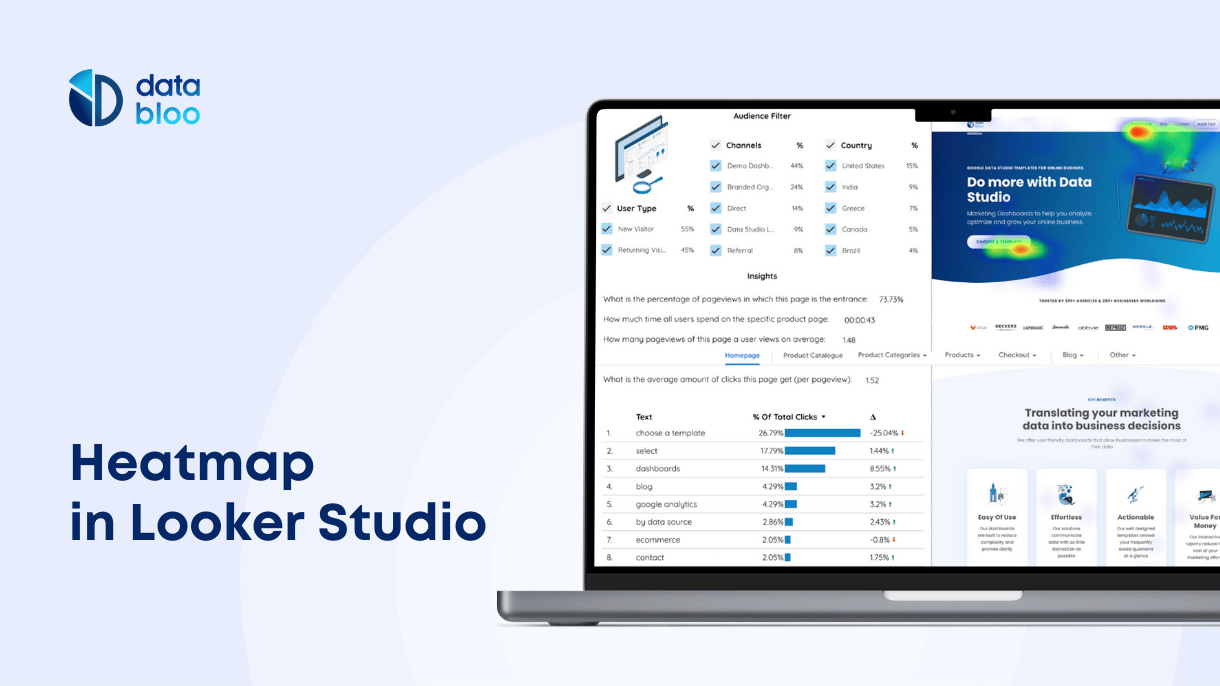
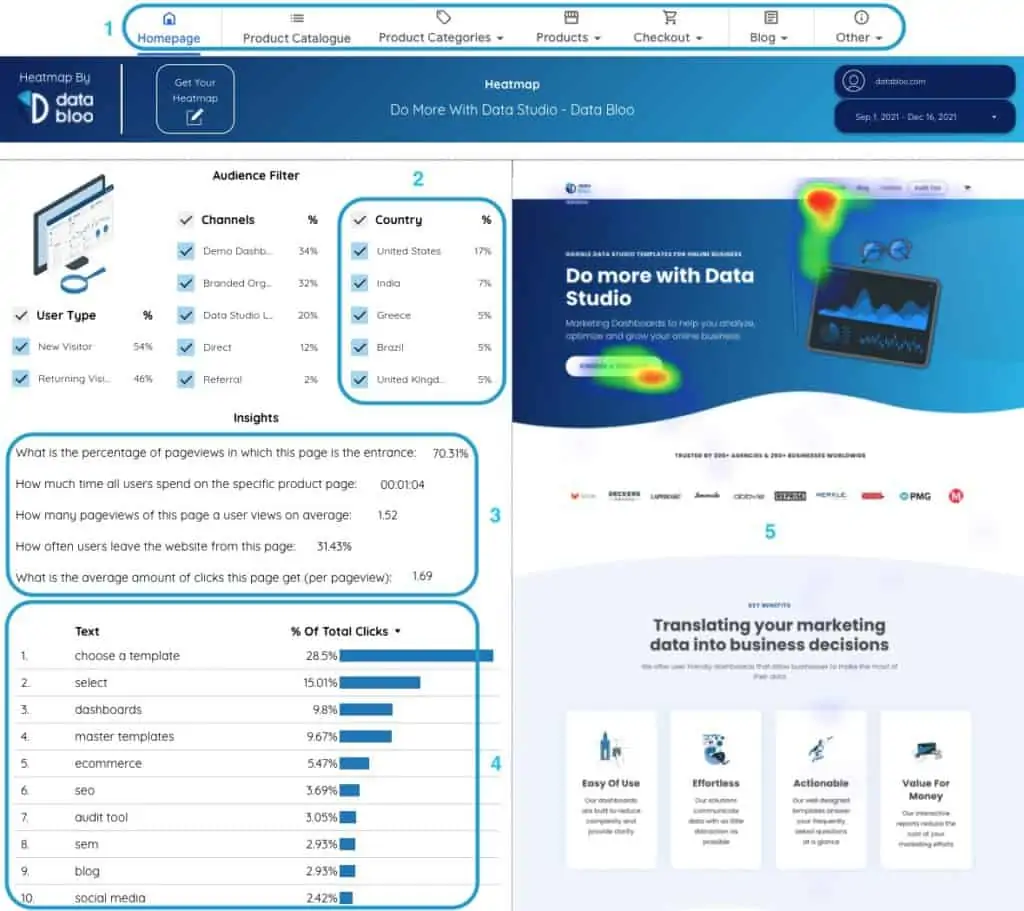
Once you are done with the initial configuration, you should be able to design how a Heatmap looks like. Below, we have gathered all the main components of an effective Heatmap dashboard:
- Navigation Menu – the navigation allows you to go from one content group to another and easily analyze each piece of content.
- Audience Filter – the filters enable you to search and identify behavior patterns from different audience segments.
- Insights – the insights give you a quick snapshot of your content performance, measuring what matters in terms of engagement (the most important behavior indicators of the specific page).
- Clicks Volume – the table displays the most popular elements of each page, that the users interact with (the % of total clicks per element).
- Heatmap Screenshot – the screenshot is a visual representation that shows you where users are clicking on the specific page.
Heat Map Insights
With this type of Heatmap, you will not only be able to see which elements of your website users clicked on, but also you will be able to have an overview by channel, country and type of visitor (new and returning). Some real life cases are following:
✓ Returning users interactions with offer pages from a paid search campaign
✓ New users behavior to specific product pages after landing from google search through generic keywords.
✓ Loyal customers (direct and branded organic) distraction during the checkout process.
✓ Subscribers engagement with email landing pages and their elements.
Heat Map Examples
Now that we you have seen some Heat Map insights, let’s take a look at some examples that utilize the above configuration in order to display this type of data on Looker Studio:
The first dashboard is designed for e-commerce and retail businesses. E-commerce stores can monitor their customers behavior across different sections of the website such as product catalogues, product pages, cart and check out pages.
The second dashboard is targeted to blogs and content websites (publishers). Using this dashboard, they can understand how the website visitors engage with their content and which pieces of content resonate the most with the readers.
The Benefits of a Heat Map
Using a heatmap, you can answer important questions about your audience behavior such as “why are they abandoning a flow” or “which piece of content they resonate the most”. Also you can easily identify:
- the user’s interactions with specific elements of your your website (CTAs, forms etc.)
- UX issues that might affect your user engagement and / or your online revenues
- the navigation differences between different user personas
Who needs a Heat Map?
The Heat Map is designed for marketers of e-commerce businesses and lead generation websites who want to have a holistic overview of user behavior on their website. More specifically UX professionals, designers, and digital analysts can conduct user experience analysis using the web analytics data such as total clicks on specific elements of the page. Therefore, they can greatly benefit from this Heat Map solution without spending their budget on monthly subscriptions.
Want your own custom Heat Map?
You want to discover more about your users? Check our Heat Map and see if it can help you further improve your key pages of your website. This template is fully customizable and can be applied to any website (ecommerce, blogs etc) that has fixed height. So if you are interested in a Heatmap without any subscription fees, please check our solution. We take over the whole configuration including the implementation on Google Tag Manager and the Looker Studio Dashboard (up to 15 pages).
Additionally you can check other user experience dashboards such as Conversion Funnel Template and Google Analytics 4 Report Template