Table of Contents
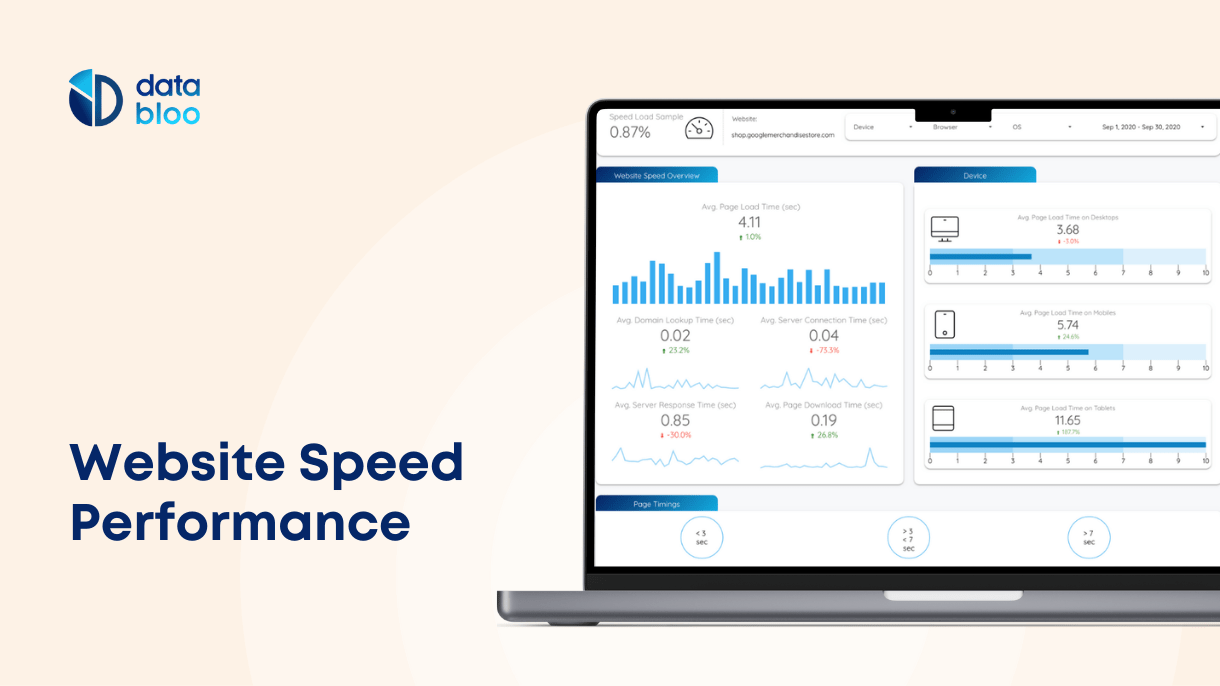
The website speed performance is one of the most important success factors for the ecommerce businesses today. Every marketeer should have a dashboard with all the key speed metrics in one place. By using our website speed dashboard, you are able to have a quick overview of your site speed performance easily with only a few clicks. Moreover, you are able to spot trends, dive deeper into different operating systems and browsers but also you have the top performing and worst performing pages in one page.
What are the top speed metrics?
Below you will find the definitions as mentioned inside Google Analytics.
- Avg. Page load time (sec): the average amount of time from initiation of the pageview to load completion in the browser.
- Avg. Domain Lookup Time (sec): the average amount of time spent in DNS lookup for this page.
- Avg. Server Connection Time (sec): the average amount of time spent in establishing TCP connection for this page.
- Avg. Server Response Time (sec): the average amount of time your server takes to respond to a user request, including the network time from user’s location to your server.
- Avg. Page Download time (sec): the average amount of time (in seconds) to download this page.
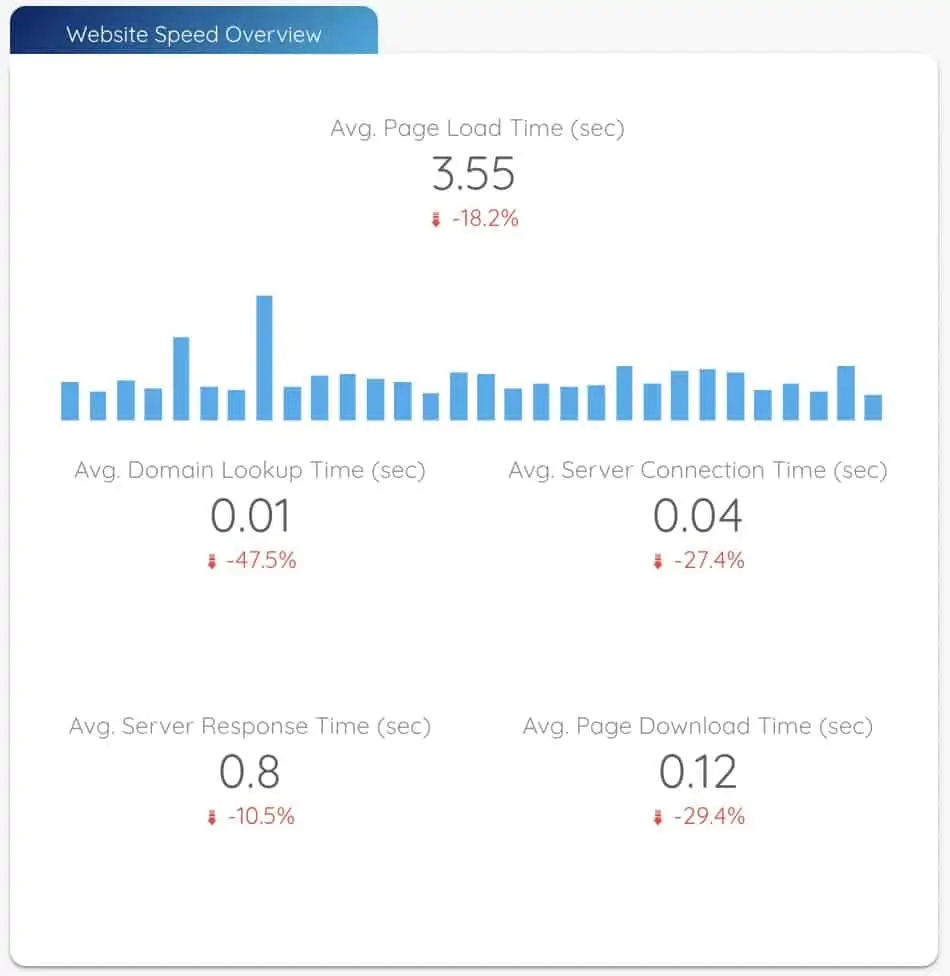
How fast is your website (in seconds)?
Apart from great tools such as Page Speed Insights, GTmetrix, Pingdom that uncover technical page speed insights, our dashboard using Google Analytics can provide useful analysis about the load times of your website. One of the main metric is the average load time (in seconds) of your website. You can have a day-by-day, week-over-week or month-over-month view by using the date range at the top. Other metrics such as Domain lookup, server connection, server response and page download time are also some key page speed indicators. This sections gives you a good understanding of your overall speed performance.
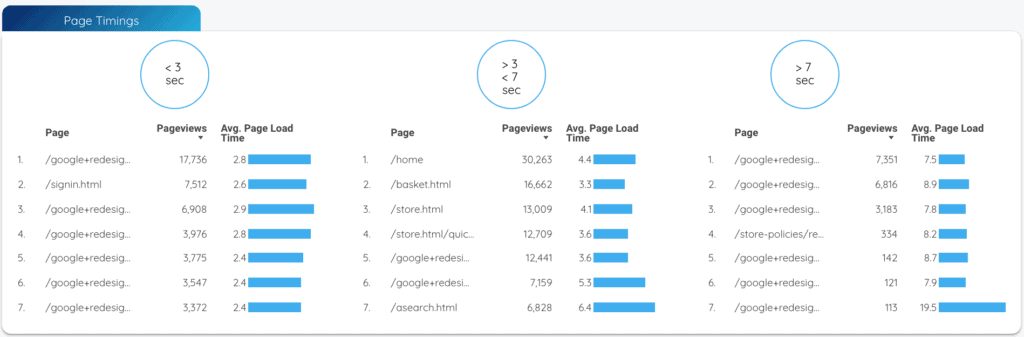
What are the high & low performing pages in terms of speed?
The Page Timing section separates the best and the worst performing pages of your website in terms of page load time. There are three different categories, the fast pages with load time less than 3 seconds, the pages loading between 3 and 7 seconds, and the low performing pages with time more than 7 seconds. We have also included the number of pageviews so you know what will be more impactful for your business and where to prioritize.
What devices / browsers / OS affect the load time of your site?
The next section in your Site speed performance dashboard is dedicated to different dimensions like devices, browsers, operating systems and date & time. All these chart can help you to identify specific speed issues on different devices / browsers / OS that affect your online performance.
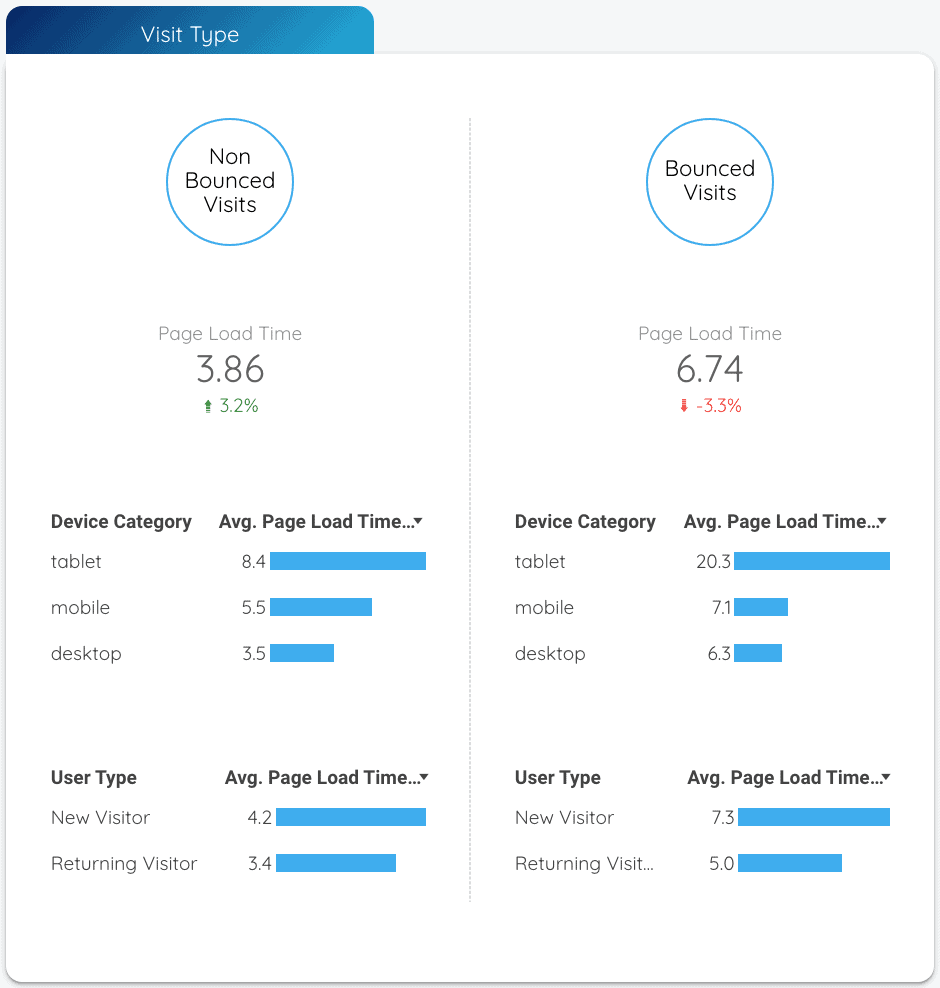
What is the load time for bounced vs non bounced visits?
It is essential for you to have this information. It shows clearly how your users behaved on your website with regards to the load time. You can see for example what was the average time of page load time for users that did not bounce versus the users that bounced. This is critical for your website performance.
You can test our report that includes all the speed elements yourself with this link.