Table of Contents
Google Analytics 4 demo account is the best way to learn GA4 easily and practice without stress. If you are wondering which data to analyze, which segments to create, or which dimensions you should add to your reports, you are in the right place! Google Analytics demo account is a fully functional data source for data analytics professionals and in this article, we’re going to walk you through creating a report using this demo Google Analytics account.
What is the Google Analytics Demo Account
Google Analytics 4 demo account is a free and comprehensive data source that is linked to Google’s official merchandise store. Also known as the Google Analytics Merchandise Store demo account, it works the same as a fully functional analytics account that any user can access.
The best way to learn end explore the capabilities of GA is by practicing the Google Analytics demo account. It allows users with a Gmail account to access real business data and experiment with Google Analytics features, by checking the properties and the set-up of Google’s online store.
How to access the Google Analytics Demo Account
Using the Google Analytics Demo Account is pretty straightforward – all you need is a Google account!
Step 1. Open your Google Account
If you already have a Google account, log in to that account. Otherwise, you should create one by signing up here.
Step 2: Create a Google Analytics Account
If you are already registered to Google Analytics, the demo will be added to your Analytics account after signing in. If you do not have an existing Google Analytics account, you will first have to create one. Once you do that, the Google Analytics demo account will be linked to your account.
Step 3: Click one of the following links depending on the property you would like to access first.
Google Analytics 4 Demo Account
- Google Analytics 4 property: Google Merchandise Store (web data)
- Google Analytics 4 property: Flood-It! (app and web data)
Universal Analytics Demo Account
As you may notice, Google has released the demo account for both Google Analytics 4 and Universal Analytics providing in this way access to several databases. The GA4 demo properties use data not only from the Google Merchandise Store but also from Flood-It! This is a great opportunity for users to move to GA4 and learn how the next generation of Analytics reports a conventional eCommerce store and a gaming iOS or Android app.
3 reasons to use the Google Analytics Demo Account
Now that you know how to access the Google Analytics demo account, let’s see the reasons it can be an invaluable training resource!
- More Traffic: One of the biggest reasons to use the Google Analytics demo account is that Google’s official merchandise store gets thousands of sessions per day. If you are a small business, take advantage of the 29 different events and parameters to play with, figure out how to create stunning reports, and focus on metrics that really matter to your business.
- Less stress: Google Analytics Demo Account is a fully functional account with lots of standard reports you can drill into. You have read access to segments and custom reports in order to check how Google set up the account and collects ideas for your own business. No need to worry about deleting any data as you can’t change the Demo account’s configuration. Feel free to create custom reports and dimensions for the reports you analyzing and explore your own opportunities!
- Many Features: The Google Analytics Merchandise Store demo account has an advanced implementation that includes reporting on eCommerce, content grouping, custom dimensions /metrics, conversions, and events. This enables you to browse through the different audience, acquisition, behavior, and conversion reports, get a better understanding of how it works and discover the most hidden features (i.e. such as Attribution)
How to connect the GA4 Demo Account with Looker Studio
Once you learn how to use the Google Analytics demo account, you can connect it with Google Looker Studio (previously Data Studio). Here is how you can use the Google Analytics 4 demo account as a data source in Looker Studio:
Step 1: Log in to your Gmail account and open Looker Studio.
Step 2: Click “Create” and then click on ‘Data Source’ to add Google Analytics as a data source.
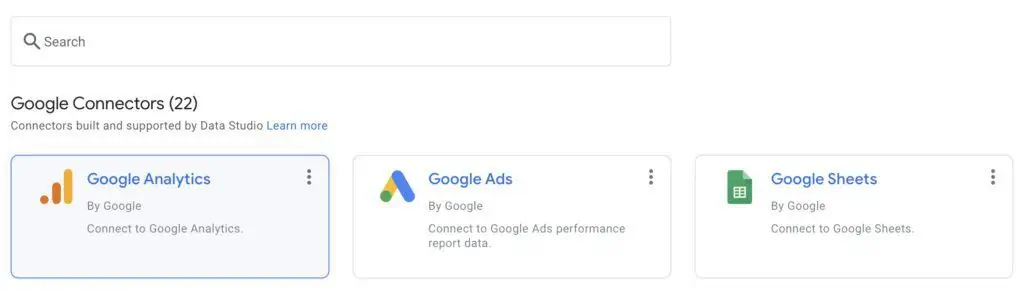
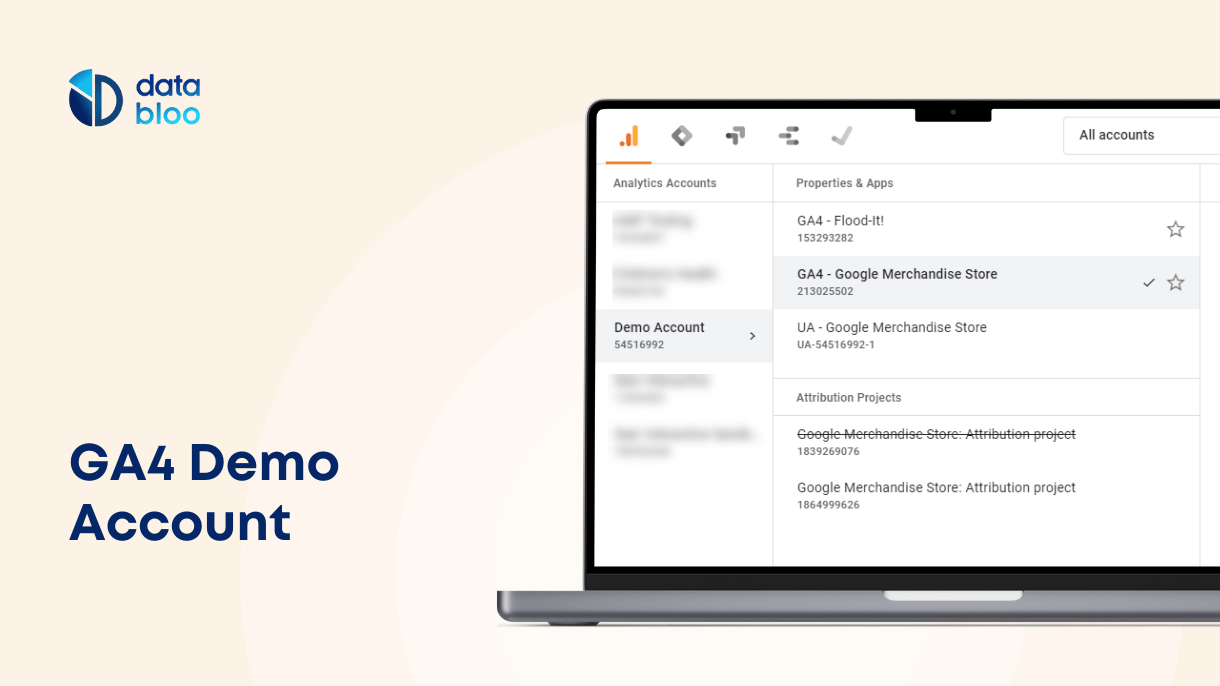
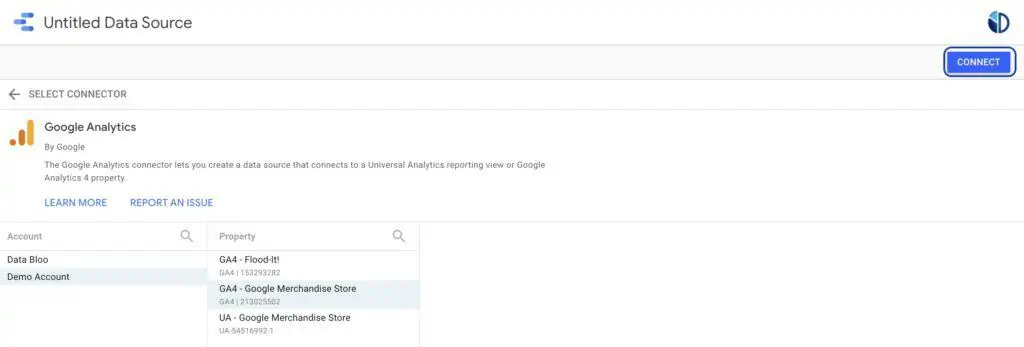
Step 3: Select Google Analytics and then select the Demo Account
Step 4: Click on the GA4 or UA property and then click ‘Connect’ to add the Google Analytics Merchandise Store as a data source.
Available data in the GA4 Demo Account
The Google Analytics 4 (GA4) demo account provides access to a rich dataset from two distinct sources: the Google Merchandise Store, which is website data, and Flood-It!, a demo gaming app. By accessing those data sources for free, users can explore and analyze a wide range of data types applicable to different businesses.
Google Merchandise Store Data
For the Google Merchandise Store, the GA4 demo account includes comprehensive eCommerce data that covers the entire customer journey, from first visit to purchase, and more.
- User acquisition: Understand where your users are coming from by analyzing traffic sources, campaigns, and mediums that lead visitors to the site.
- Engagement metrics: Dive into how users interact with the site through pageviews, session durations, bounce rates, and event counts.
- Conversion data: Track e-commerce transactions, including product views, add-to-cart actions, checkout progress, and completed purchases, along with revenue figures and conversion rates.
- Customer segmentation: Access demographic information such as age, gender, and location, along with interests of the customers.
- Product performance: Analyze sales data at the product level, including top-selling products / brands / categories, product revenue, and the performance of promotional activities.
Flood-It! App Data
With the Flood-It! demo app, GA4 showcases data that is typical for mobile applications, offering insights into app usage, user engagement, and retention.
- User Engagement: Track metrics like daily active users, session lengths, and screen views to understand how engaged users are with the app.
- Event tracking: Detailed event data for in-app actions, such as level completions and custom events specific to the gaming experience.
- Retention analysis: Understand how well the app retains users over time. The cohort analysis highlights how different groups of users engage with the app across multiple sessions.
- Technology Insights: Information on the devices, operating systems, and app versions used by the app users.
By exploring the types of data available in the GA4 demo account for both the Google Merchandise Store and the Flood-It! app, you can gain practical experience in analyzing diverse datasets.
5 reports you can use with the GA Demo Account
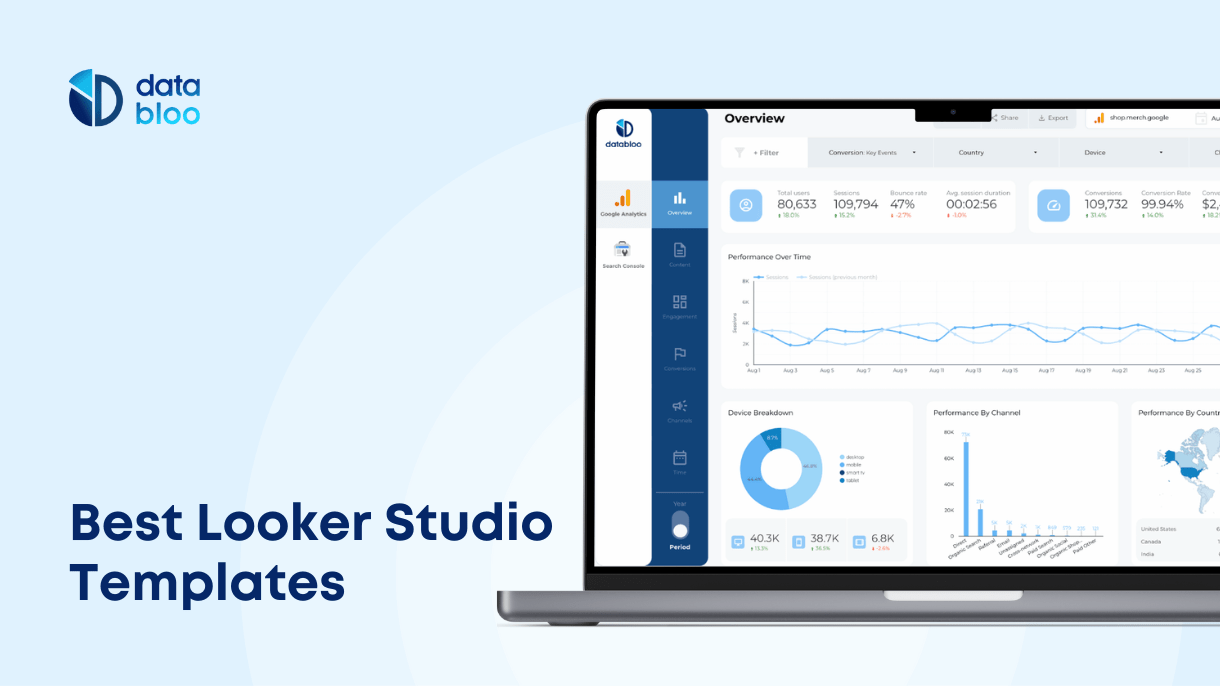
If you want to visualize the Google Analytics demo account data with ready-to-use reports, here are some templates you can use right away:
- Ecommerce Revenue Template: The perfect report for monitoring the sales and the revenue your eCommerce generates. It’s designed to give you a comprehensive view of the sales performance, identify best-selling items, and uncover trends in consumer purchasing behavior. Use this template to analyze the product offerings of GA4 demo account.
- Google Analytics – Global Users by Region: Have a global perspective of the user’s activity with this interactive map. It allows you to see at a glance where the visitors are coming from, helping you to analyze website content, marketing campaigns, and product offerings to specific geographical markets. Understanding regional preferences and behaviors can lead to more targeted and effective marketing strategies.
- Overview of Google Analytics (Blue World report): With this report, you can have a detailed overview of the performance of the marketing channels like organic search, paid ads, social media and present GA4 demo data in an appealing way. It breaks down performance by source, giving insights into traffic volume, user engagement, conversion rates, and more.
- Site Speed Performance: Track how efficient the GA4 merchandise store is and identify any critical issues that may affect the behavior of the customers with this report. Speed is a critical factor for every website and this report allows you to measure how quickly the pages load across various devices, bounce vs non bounce visits, new vs returning visitors.
- Analytics4now: Another easy way to visualize the demo account data is by using Analytics4now, an analytics dashboard that integrates Google Analytics 4 data with the standard interface of Google Analytics (Universal Analytics). It’s particularly useful for those who are transitioning to GA4 and need a familiar layout to visualize their data.