Table of Contents
Data Blending in Google Looker Studio (previously Data Studio) is the perfect way to upgrade your digital reports. This unique feature has been recently updated and allows you to accomplish advanced data manipulation in less time. If you are new to this, we have created this article to help you get started so you can start using the data blending in your Looker Studio reports.
Over the past few years, Looker Studio (formerly Data Studio) has emerged as one of the most commonly used tools for data visualizations. Due to its popularity, Google continuously upgrades its features and tools. One of the recent updates, Improved data blending with 5 different join operators, makes it much easier for you to visualize data from different sources in the same widget.
What is Data Blending in Google Looker Studio?
Google Data Studio data blending allows you to create charts using data from different data sources. You can connect multiple sources such as Google Analytics 4, Google Search Console, and even Google Sheets with Looker Studio and create stunning charts from these data sources, using a ‘join’ key.
By blending data, you can combine information from several sources into a single chart quickly. Data blending can reveal relationships between the different data sets. If there is any common dimension you can use it as a ‘join’ key to merge your data.
How to Blend Data in Google Looker Studio?
How does this feature work in Looker Studio? As we discussed above, the data sets are required to have a common dimension. For instance, if we collect data from two different websites, you can join them in a single graph by using the ‘date’ field as a ‘join’ key (‘join’ key: Date, Website 1 Sales, Website 2 Sales). This key matches dates between the two data sets and then displays the data from the new blended data source (you can name it as you wish). The best part is that you can use this blended data source in multiple charts such as line charts and tables.
Google Looker Studio data blending can help you have a holistic view of your business by combining your sales, marketing, and web analytics data in just one place. This will enable you to get actionable insights into your overall performance and make better decisions for your business.
Steps for Blending Data in Google Looker Studio
Now that you know how data blending works, let’s take a look at how to do it. Looker Studio is an easy-to-use tool and even if you have no prior knowledge of using it, you will find it pretty straightforward to blend data using the ‘join’ key.
We have listed down an easy way for you to combine data from different sources into a single chart. By following the steps given below you can quickly blend data from more than one source and visualize it.
Step 1: Create two different charts
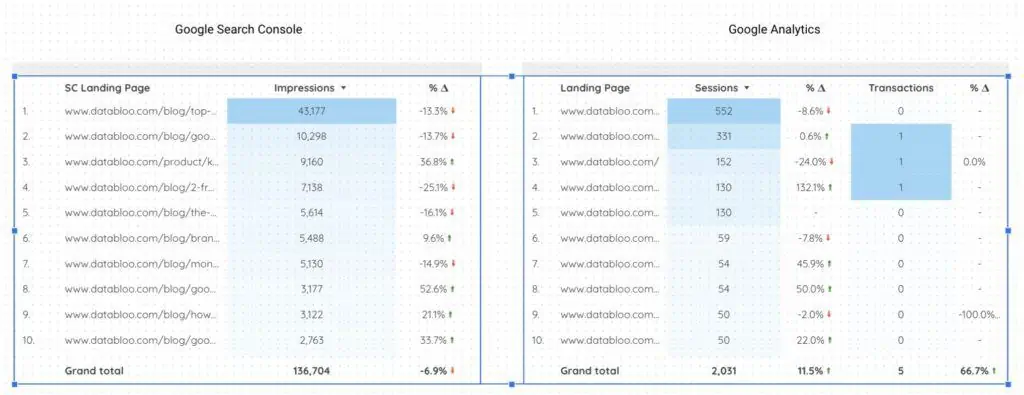
As a first step, you should create two or more charts with different data sources. You can use as many dimensions as you want, however, please keep in mind that the data sets should have at least one dimension in common. In the example below, the common dimension is the “Landing Page” between Google Search Console and Google Analytics (includes only organic traffic)
Step 2: Blend Data
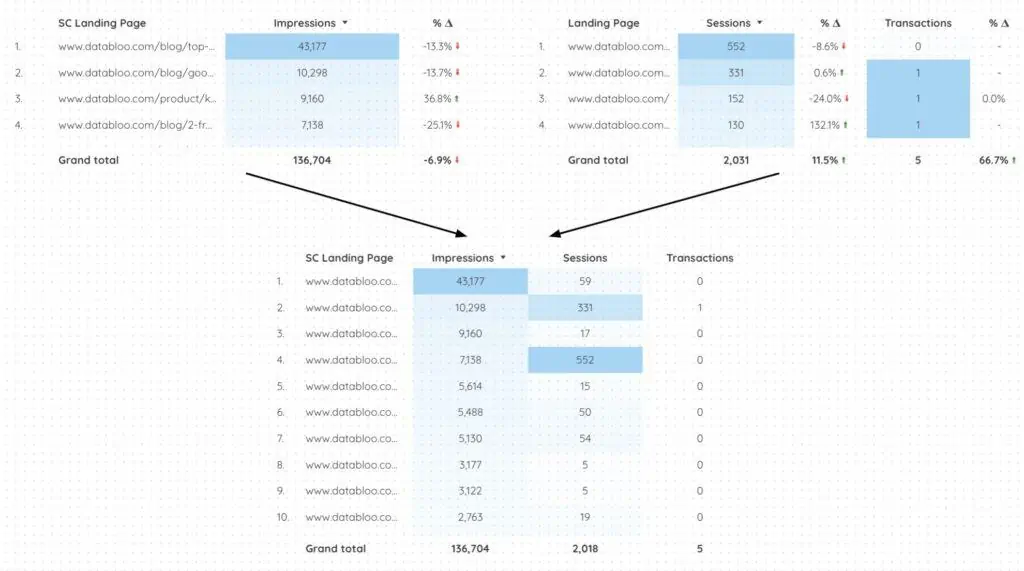
Once you select the two charts (Ctrl+ Click to make the selection), simply right-click with your mouse. This will open the menu with the available actions. Find the option that says “Blend Data” and click on it. This will join your graphs if they have any common dimensions between them. Then you would be able to visualize data from both charts into a single chart.
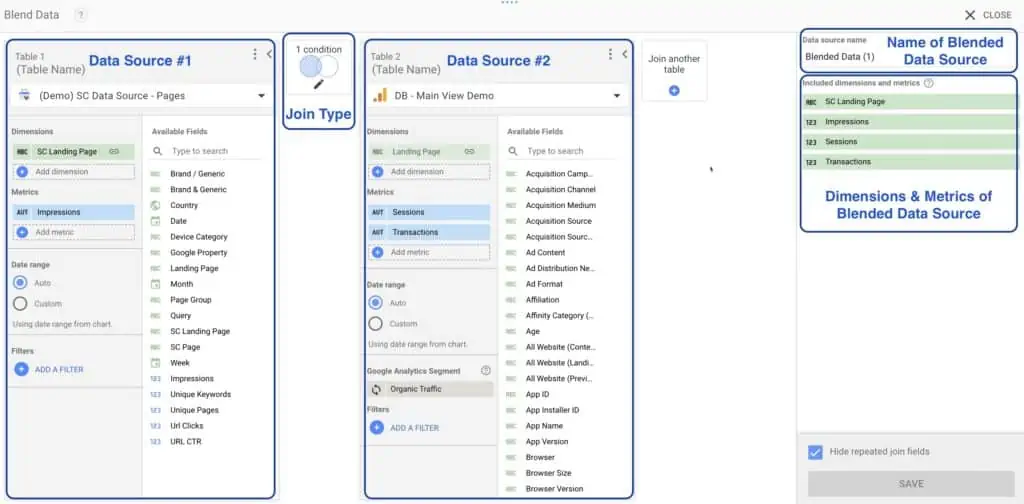
This is a quick and easy way of using data blending in Google Looker Studio. If you are a more advanced user, you can go to “Resources” in the menu and then “Manage Blended Data”. As shown below, this will give you greater control over the metrics and dimensions you use in your charts. Additionally, by opening this view, you can make any changes you want in your configuration, such as changing the blended data source name, switching from one join type to another, and adding/removing metrics and dimensions from the data sources.
Google Looker Studio Join Types
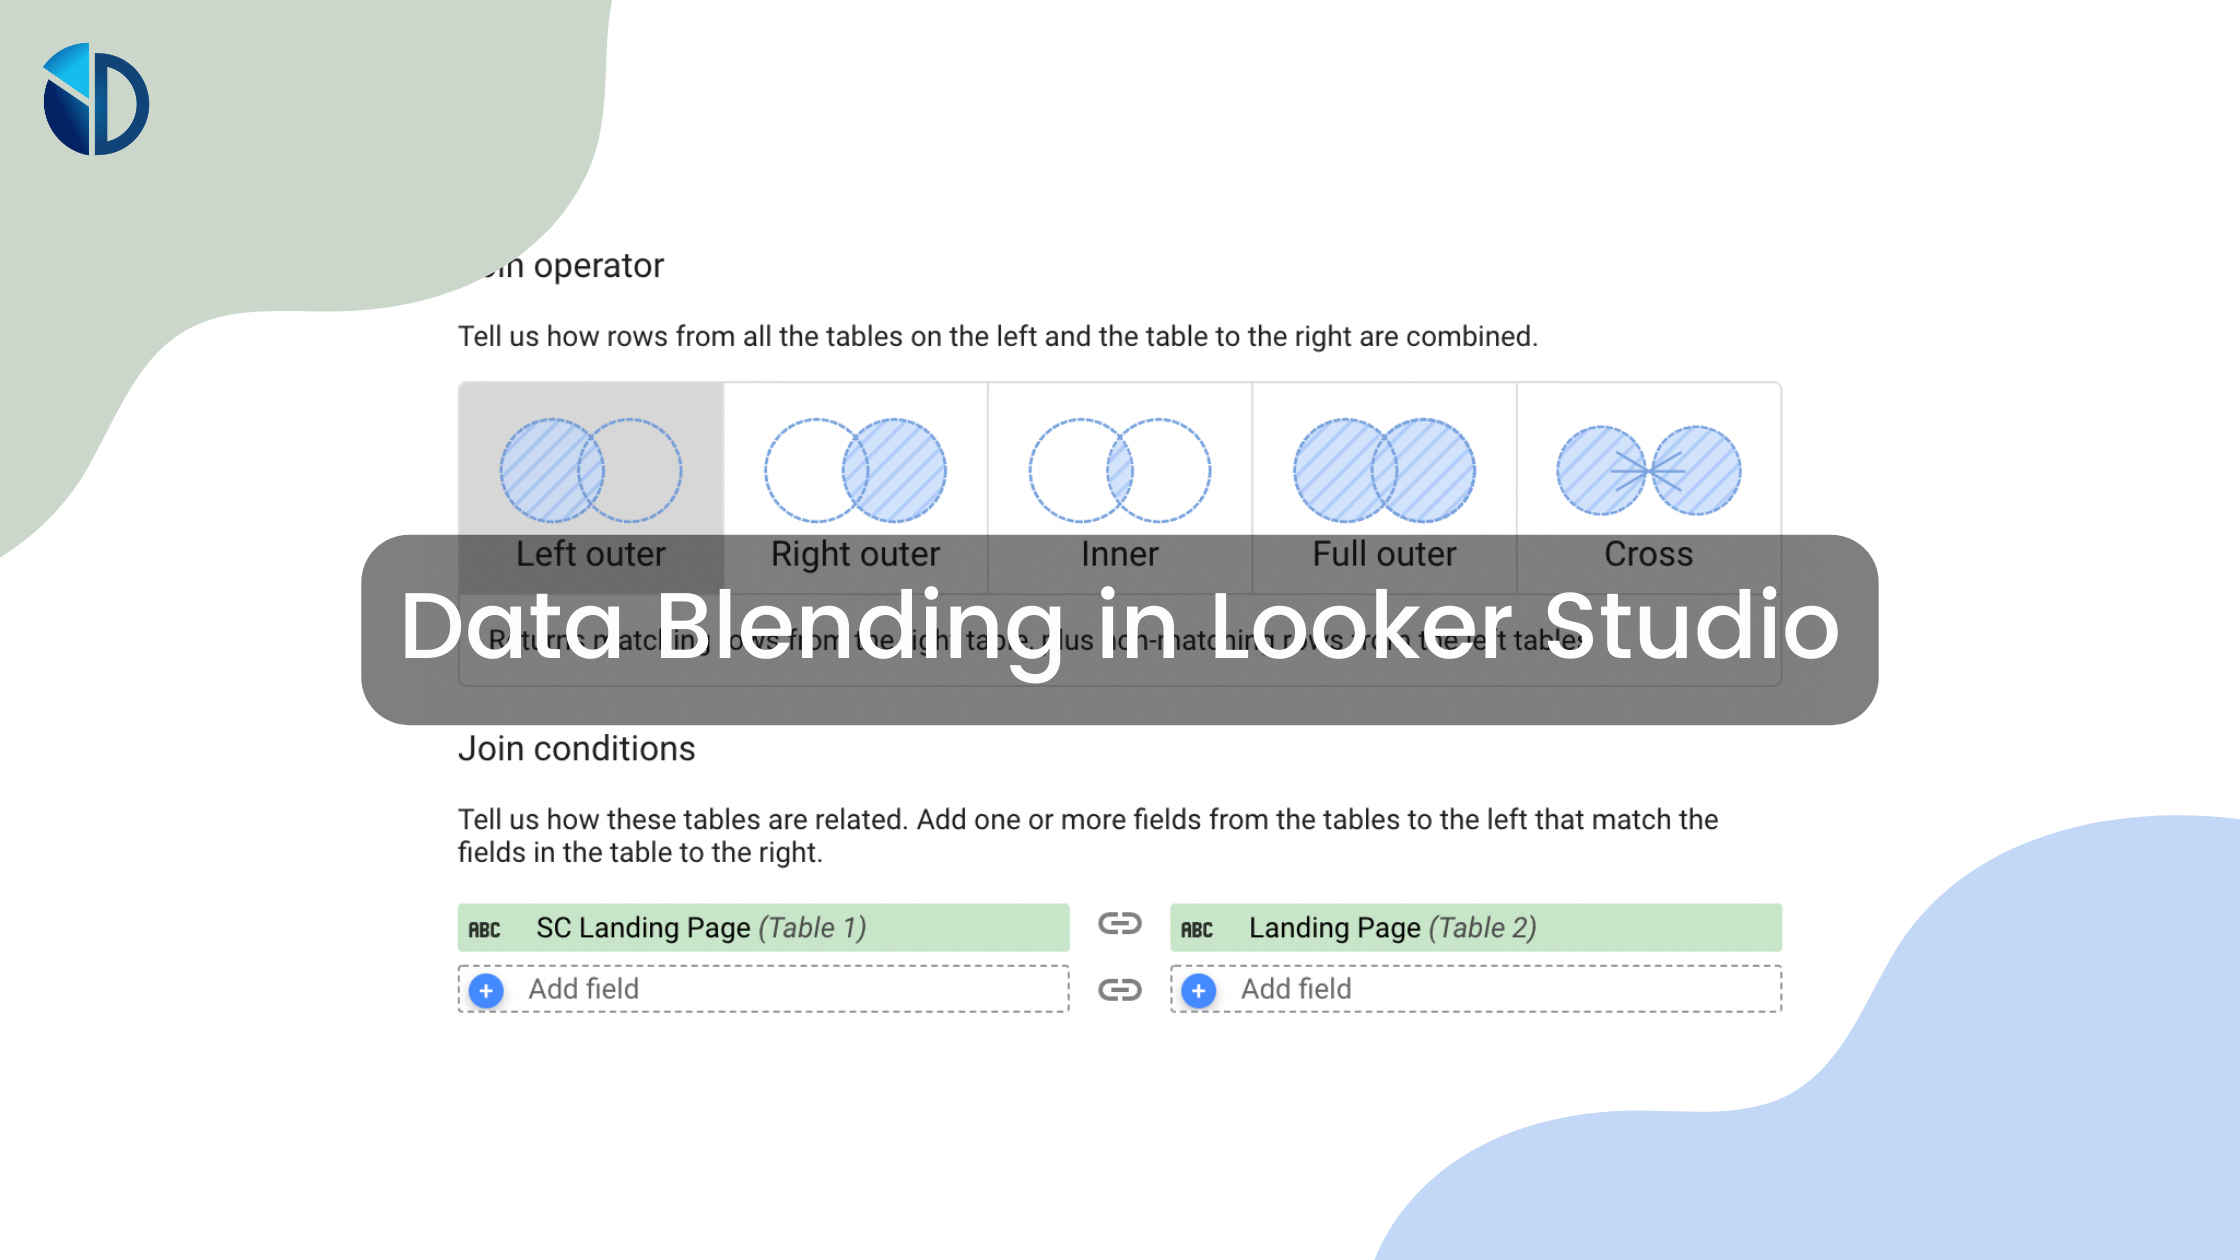
Initially, the only available condition to blend data in Google Looker Studio was the Left Outer. After the last update of Google, there are 5 different types of ‘join’ statements that you can utilize in your reports:
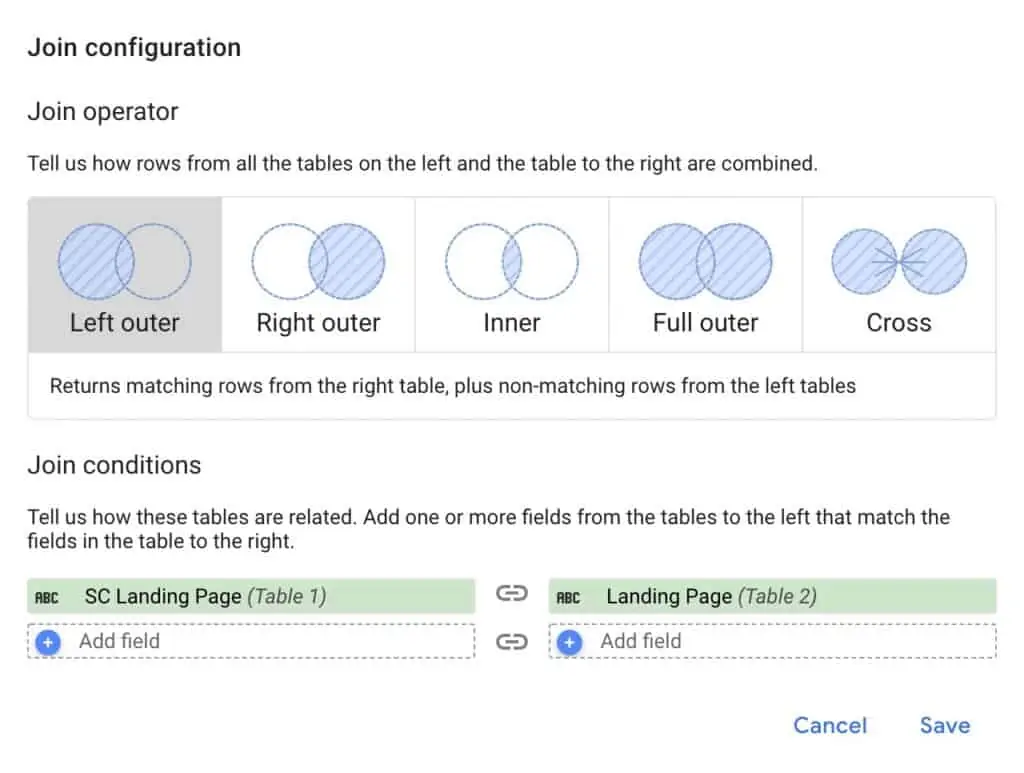
Left Outer: Left Outer condition returns all the rows from the first table (left) including the matching rows from the second table (right). This was the default option for data blending in Google Looker Studio since its launch.
Right Outer: This type of join returns all the rows from the second table (right) including the matching rows from the first table (left). It has the same approach as the first option, but with opposite positions.
Inner: This statement returns only matching data from the two tables (left and right data sources).
Full Outer: This method returns all (matching or non-matching) the rows from the two tables.
Cross: This type returns every combination of rows from the two tables.
Blending Data Examples in Google Looker Studio
So far we have discussed how data blending works and how you can use the ‘join’ keys to combine data from different sources. Now it’s time to take a look at some real examples of this feature:
- Blend Adwords and Bing ads data in Google Looker Studio: If you want to monitor your Adwords and Bing Ads in one place, you can now combine this data by using the blend feature. This will give you a deeper insight into how your overall ads are performing.
- Blend Facebook Ads with Google Ads: It can be hard to manage ads on more than one platform but with the blend option, you can compare the data from both Facebook and Google ads using Google Looker Studio.
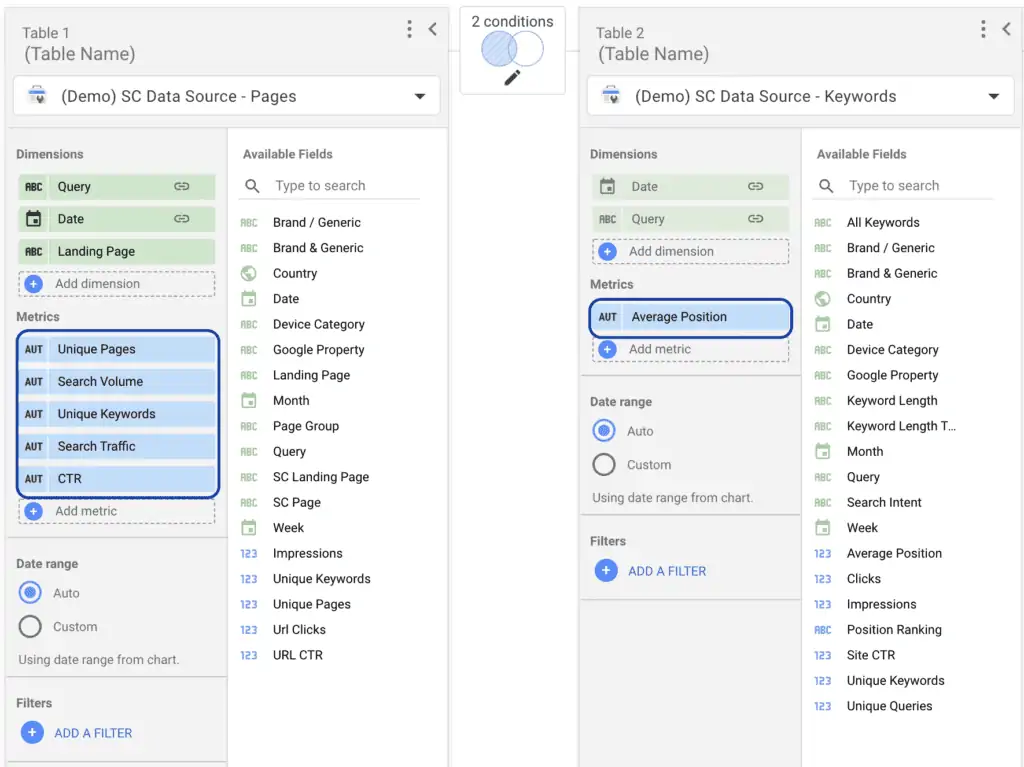
- Blend Google Search Console Data Sources: By blending Google Search Console Data Sources (SITE and URL), you can combine all the available metrics for keyword & landing page level in just one source.
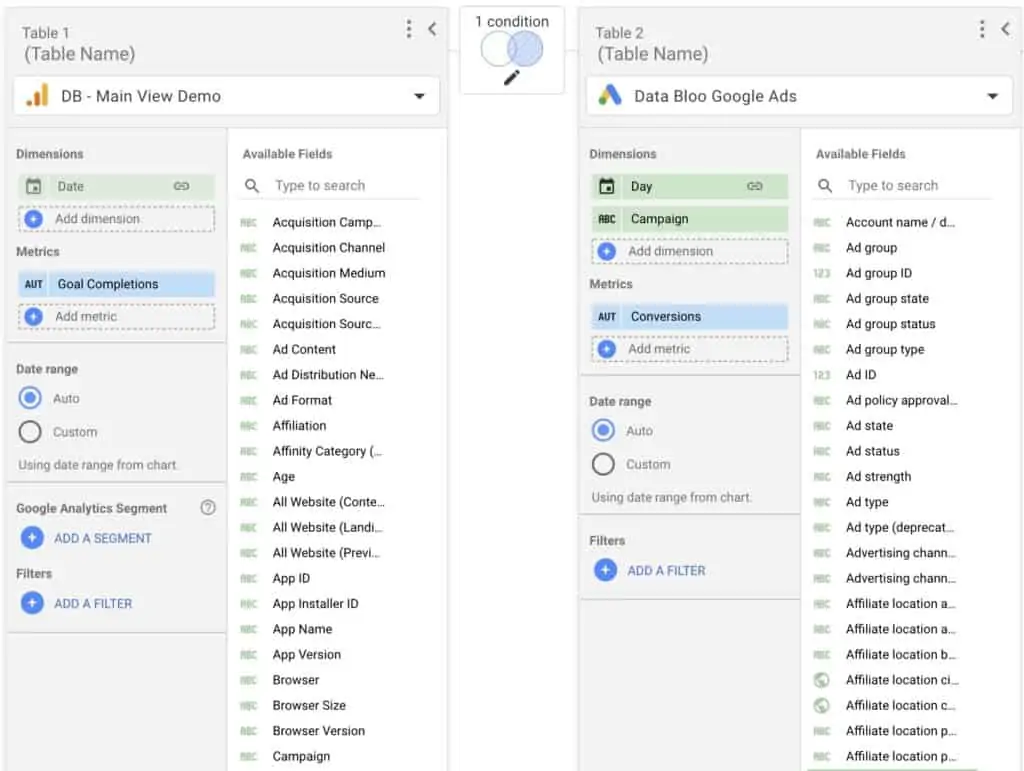
- Blend Google Ads Conversions with Google Analytics Goals: If you want to analyze how your ads are performing in terms of your website goal conversions, you can use the blend option to compare data from GA and Google Ads.
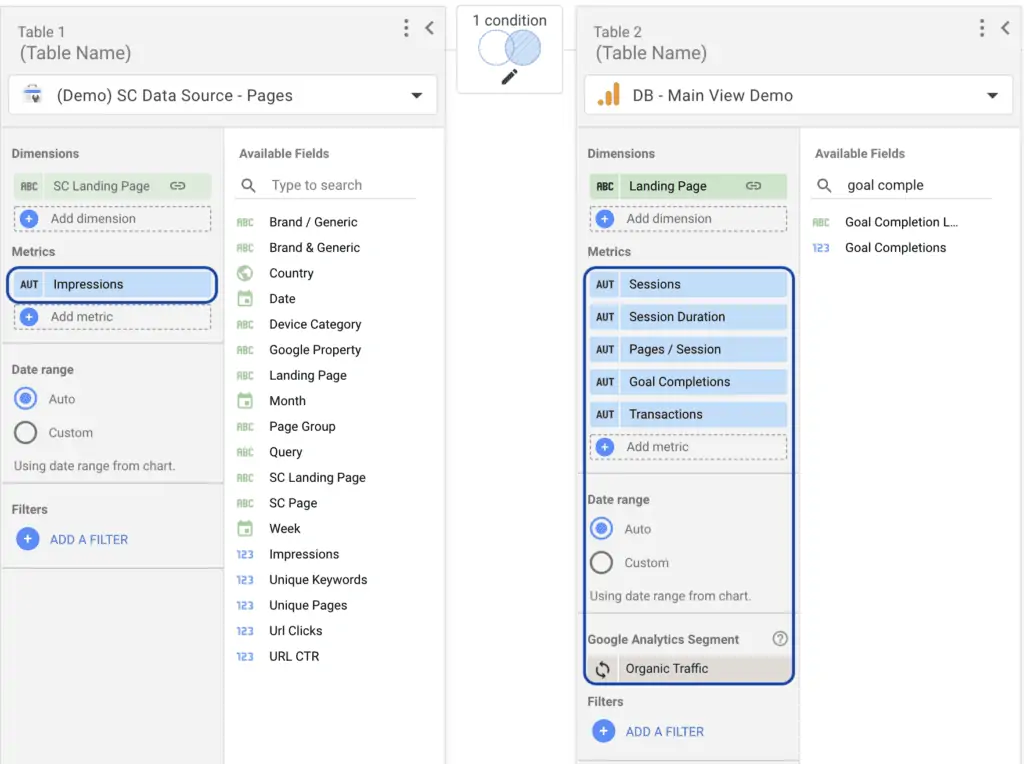
- Blend Google Search Console with Google Analytics: You can extend your organic search performance by connecting the search volume of your landing pages with the acquisition (number of sessions) behavior (pages/session, avg session duration), and conversion (goal completions, transactions) metrics of your website.
Level Up your Analysis with Data Blending
Are you looking for Google Looker Studio Templates that use Data Blending? Our ready-to-use templates can help you utilize this powerful feature and upgrade your digital reporting immediately. Reports such as Keyword Analysis and Website Master Template are using blended data sources in order to pull actionable insights about your organic search performance. Check out these products in our gallery and start making more comprehensive and stunning reports for your business.