Table of Contents
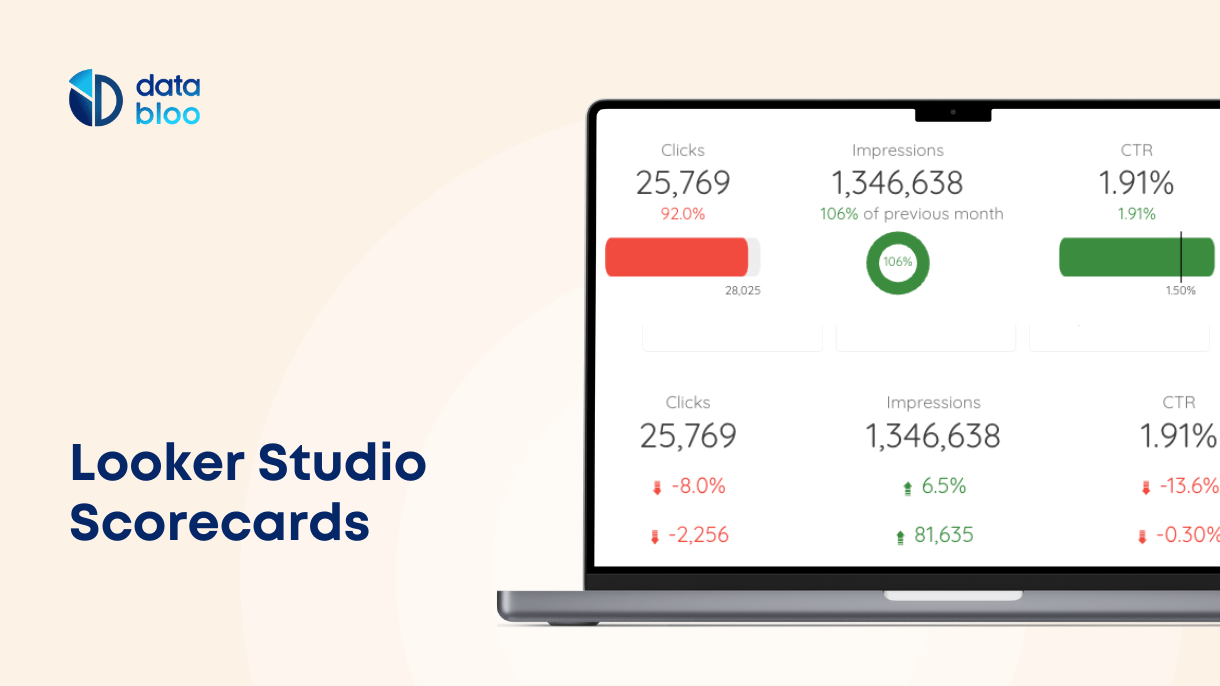
Discover the power of Looker Studio scorecards, the modern equivalent of the simple scorecards we used in school. These scorecards provide a concise summary of a single metric, making it easier for anyone to keep a close eye on the most important performance indicators.
Whether you’re tracking a marketing campaign or sales activities, Looker Studio scorecards offer a clear and numerical representation of your data.
In this article, we delve into the different types of scorecards, their functionalities, and how to create and customize them to better fit your reporting needs. If you’re ready to visualize your metrics in a simple yet impactful way, read on to explore the world of Looker Studio scorecards.

What Is a Scorecard?
The Google Looker Studio scorecard functions much like the simple scorecards we all had in school. Whether it was in drama or the English oral, your scorecard would be a solid number that summarizes your overall performance.
This is what Looker scorecards do. They provide a summary of a single metric.
In the Looker Studio, the scorecard will be displayed as a number backed by the name of the metric it is summarizing. This function works best for anyone who wants to keep an active eye on the vitals of their business operations, be it campaigns or sales.
A quick example; with the power of scorecard KPIs from Looker Studio, users can review a summary of their ad campaign performance for a certain period. This display could be for a week, a month, or even three months.
Available Types of Scorecards
The Google Looker Studio has two types of scorecards that place ease at the center of the data display. Each type of scorecard has its place in the dashboard and serves a different purpose.
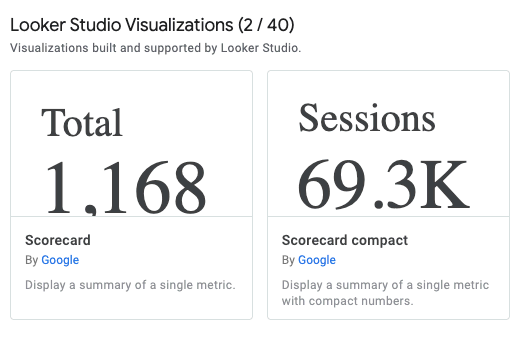
Scorecard
The simple scorecard has the same functionalities. However, it is simply because it displays numbers in a simple format.
This type of scorecard is the perfect pick for marketers or business owners interested in displaying numbers including all the digits. It is also ideal for sharing comparisons you want to constantly keep an eye on.
Scorecard Compact
Much like the simple, the compact scorecard is defined by the digits it displays. This scorecard is designed for metrics carrying numbers above five.
The compact card compresses metric digits to make them easier to ingest.
For example, if your web page or product has received 554,540 views in the first quarter of the year, it would be distracting to display this number as it is on the dashboard. But with a compact card, you can display this number as 554.5K. This number is more appealing and makes it easy for anyone to see the big picture capturing the KPIs quickly.
Functionalities of Scorecards in Looker Studio
An array of functionalities back the Looker scorecards. Each functionality comes with a feature that aims to heighten visualization.
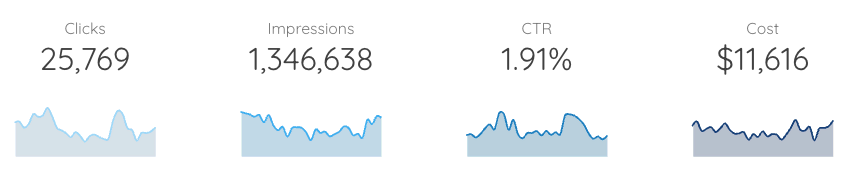
Sparklines
Sparklines are tiny line charts drawn without coordinates. They resemble floating line graphs and they are a new addition to scorecards. This scorecard function allows you to show a data trend over time. You can pair it with a compact scorecard to provide better input into your KPI.
Most sparklines are chartered in blue and rest below the primary metric. But if you want to customize your sparkline, visit the style tab under the sparkline section.
When you want to add sparklines to your scorecards, visit the sparkline section under the setup tab. There, click on add dimension. A drop-down menu will appear, from it select a time range.
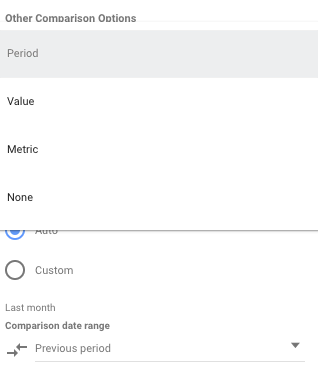
Comparisons
Another function we cannot help bragging about is the comparisons function. This function is designed to depict the primary metric against several other properties within your data set.
Some of the properties you can pick include:
- Period
- Value
- Metric
You may also check the “show as progress” box. This will give you the progress your primary metric has made against the comparison data.
But one thing to note, you cannot use the show as progress function and the sparkline function at the same time. You will have to pick one.
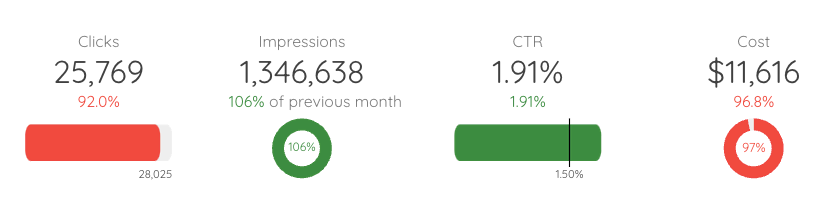
Percentage
And so we come to percentages. Percentages are a great feature to show the progress of your primary metric. On the Looker studio scorecards, the percentage is used to reveal the trend of your data.
Compact Numbers
As mentioned above, compact numbers in Google Looker Studio is a numerical format used for numbers with six digits and above. This rounds numbers to three whole numbers and a decimal followed by a unit indicator.
Anatomy of a Scorecard
The anatomy of the Google Looker Studio scorecard is quite simple. The actual data displayed on your dashboard will depend on your settings.
Below we have outlined the basic anatomy:
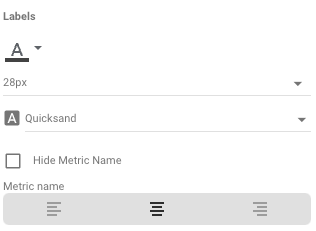
KPI Name
The first thing you will spot on a scorecard is the metric name. This could be any metric like the number of sales, new users, and page visits. The name will rest above the actual metric. Under the style tab of the scorecard, you can easily align it or even hide it according to your preference.
Metric Value
Stack in the middle of the card, we have the metric value. The value can be depicted as a compact number, a decimal precision, or a full number.
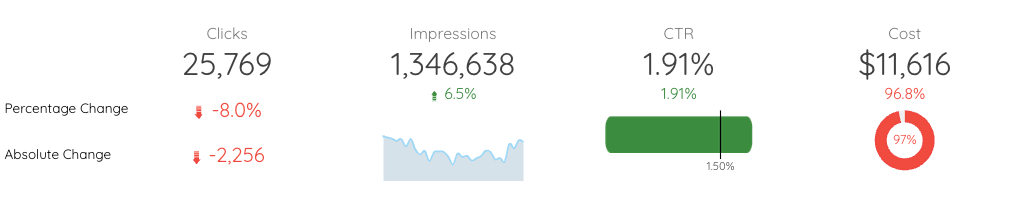
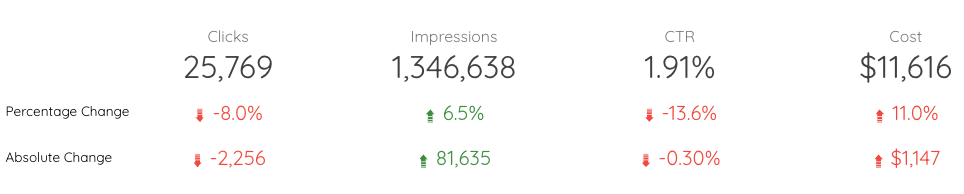
The Changes
The changes show the trend of the primary metric. This change sits at the bottom of the metric value. And it’s often represented as a percentage with either a downward arrow or an upward arrow. But if you have selected absolute change, then instead of a percentage you will have the exact change in digits. After the recent update, you can use comparison options like value, metrics, and period.
Comparison Labels
Positioned next to the changes are the comparison labels. These labels will show the comparison property selected.
How to Add a Scorecard in Looker Studio
Now for creating and configuring the actual scorecard. Before we start creating the scorecard, log into your Looker Studio account and open a new or existing report.
Step 1: Add a Chart
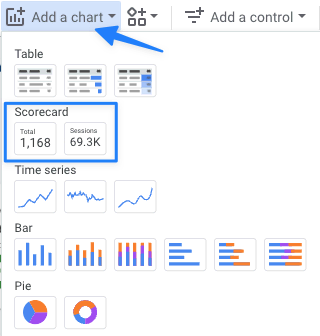
Once you have opened a report, on the top toolbar, you will have to pick the add a chart button. A menu will appear, scroll down, and select scorecard.
You will have to decide between the compact or simple scorecard. Drag it to your desired location.
Step 2: Choose a Metric
Under the setup bar, go to the metric section. Here you can look up and select the appropriate metric for your chart.
Step 3: Add Comparisons
Under the same setup bar, scroll down to the comparison data range section. Then select the period you want to work with and click apply.
Step 4: Style the Card
Now this is the step to show off a bit of creativity. Click on the style bar perched next to the setup bar. In this section, you can adjust the font size, change alignment and even add a bit of color to your scorecard. How it looks is up to you, so think a little outside the box.
Working with Looker Studio Scorecards
Scorecards in Looker Studio are the best way to capture your KPIs. This eliminates the need to scour through heaps of data to understand how your marketing efforts are performing.
When it comes to Google Looker Studio templates, we are the team to collaborate with. Data Bloo has an array of customizable templates perfect for any agency or e-commerce company. Visit our website to view our list of templates.