Table of Contents
Have you ever coveted a shiny new laptop on your phone only to see it popping up everywhere a day later?
While people might openly complain about having to see targeted ads on social media platforms, we cannot deny how much they influence what people click on and buy. That’s because PPC, or “pay per click,” has proven to be one of the most profitable marketing tactics. It brings in the most returns for its value.
Creating a PPC campaign to retarget returning customers, or even someone who visited the website once makes consumers as much as 70% more likely to buy products.
This post shows how to effectively make effective PPC marketing templates. Keep reading to learn how Looker Studio makes it easy to track the success of your PPC marketing strategy.
Make Faster Decisions with Your PPC Report Template
Data holds the keys to the most accurate reporting on PPC performance. Your data metrics tell you which target keywords generate the most traffic as well as telling you which groups of people click on your campaign’s ads the most, and what products they have the most interest in.
Data metrics also keep marketing campaigns focused on the most successful locations and the products that get the most clicks. Knowing everything you can about your customers can only happen when you sync your ads with data generated from online traffic. This way, PPC marketing campaigns become more targeted and specific for the most success.
Data helps companies to stay ahead and work smarter.
Keeping Track of Campaign Goals for the Best Results
Setting goals keeps your PPC marketing strategy focused. First, you need to define those goals, such as:
- Creating sales-based goals
- Finding the target audience
- Building target strategies for ad placements
Targeted ads have value when they drive customers to the right places and lead to generating the most revenue. There are some key performance indicators that show the return on investment of your active campaigns. The next section explains just how to use Looker Studio to build powerful PPC reports that allow you to make better business decisions.
6 Tips on Building Reports on Studio Looker
Setting up a PPC dashboard using one of our templates will cut out the extra work when reporting on PPC performance. Using the best tools will optimize your success rate. Tracking data effectively results in finding ways to improve targeted ads.
Let’s discuss six tips to build the best PPC reports on Studio Looker.
1. Identify Your Company’s Goals and Objectives
In the previous section, we mentioned in detail specific goals when setting up your company’s PPC strategy. Setting up PPC campaign goals involves specific metrics to measure from. Below you will find some common goals:
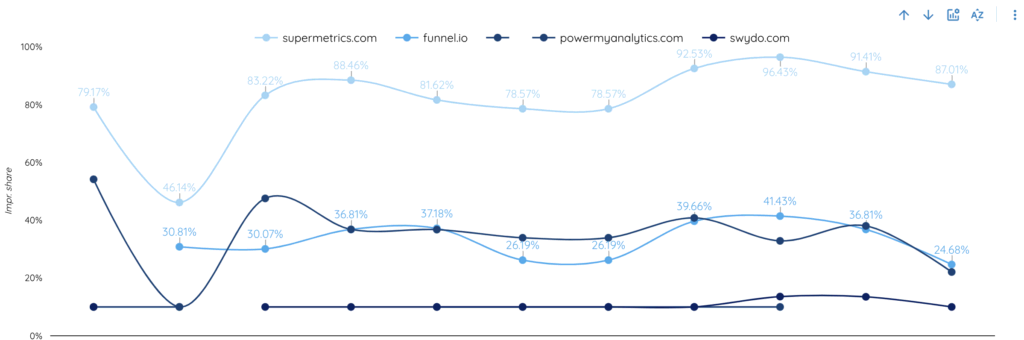
- Brand awareness: A company may want to boost its brand awareness through a branded PPC campaign and metrics such as impression share and brand search volume can be used to monitor the success of this goal.
- Website traffic: The main target of a campaign could be to drive more people to the company’s website. KPIs such as click-through rate (CTR) and clicks can be used in this case.
- Leads: For lead generation companies, the goal could be to generate more leads through PPC campaigns. Metrics such as conversion rate and the number of conversions (key user actions on the website like form submission) can be the main indicators of success.
- Sales: For e-commerce stores, one of the main targets is to boost online sales via targeted PPC ads. Return on ad spend (ROAS) and revenue can measure the effectiveness.
- Costs: Many companies are looking to reduce the budget of their marketing campaigns, and metrics such as CPC, CPM, or CPA can be used to optimize the current marketing costs.
Metrics generated from past data that are regularly updated based on newer incoming data can be best understood when you look at them with your target numbers and objectives in mind.
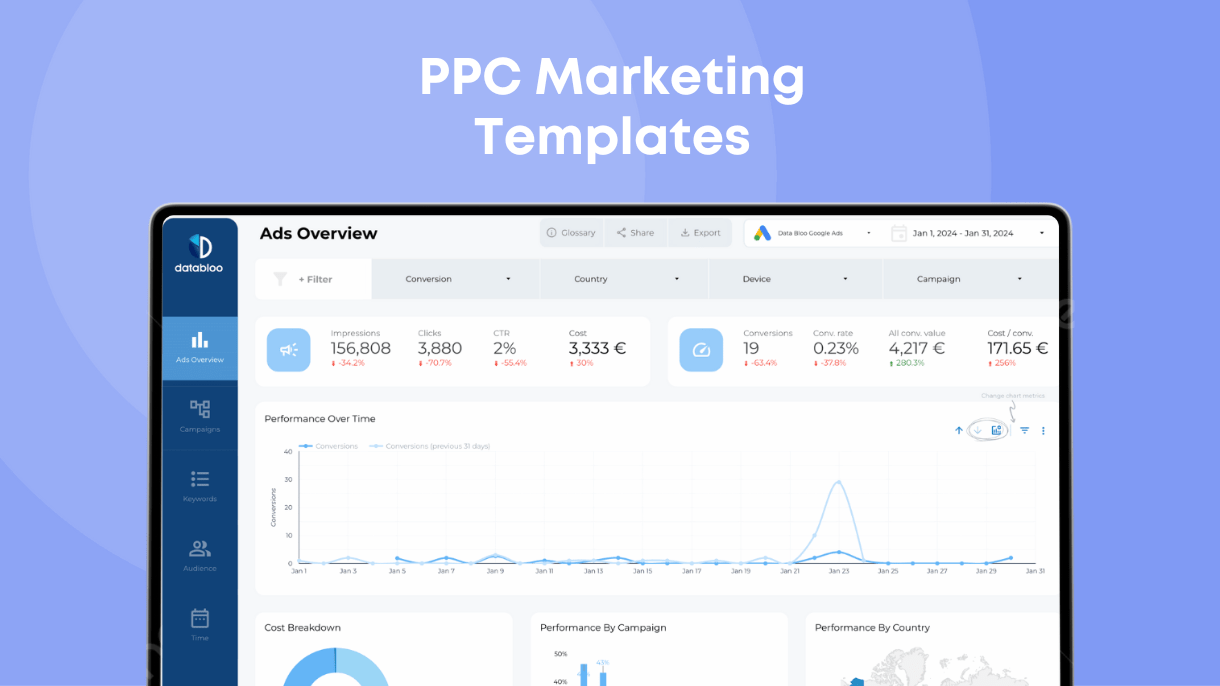
2. Track the Right Metrics Using Looker Studio
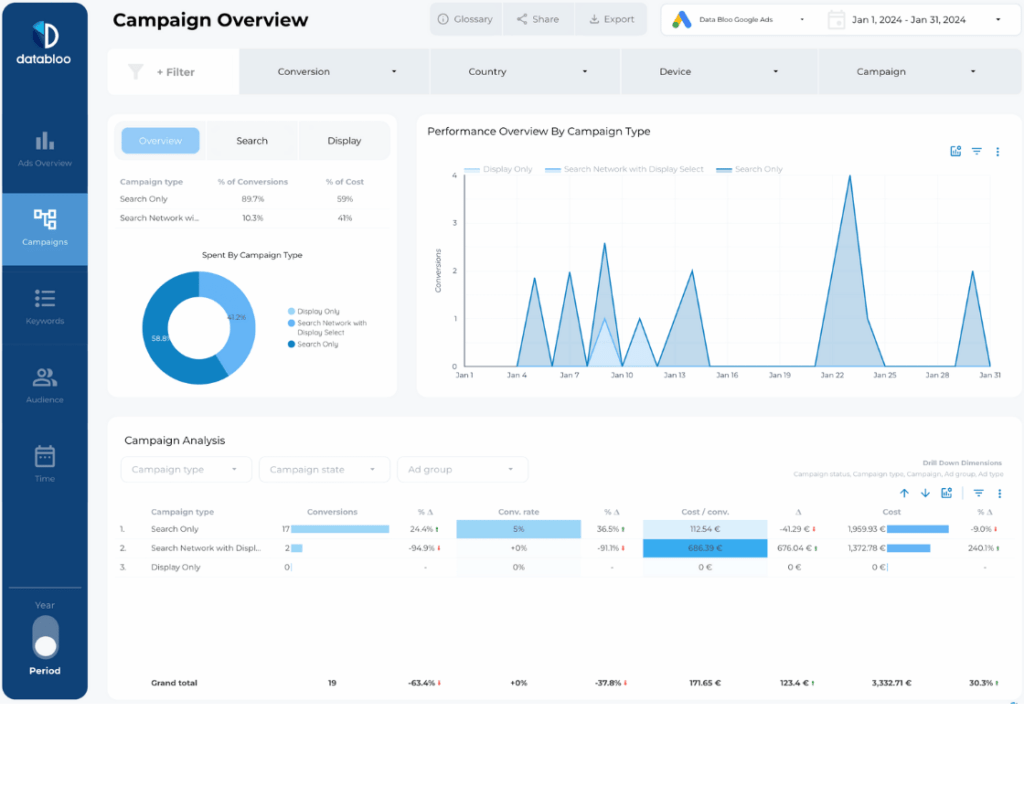
Some of the most important metrics to prioritize on your Looker Studio dashboard are the keyword performance insights. These metrics allow you to see in real-time how your ads perform. Key metrics for a comprehensive KPI include:
- Click through Rate to see how many people clicked on the ad after seeing it
- Cost per click ratio which you get by dividing the total cost by the number of ad clicks
- Conversion rates which you measure by dividing the number of conversions by the total number of ad interactions
- Cost Per Action (CPA) which measures the cost of each conversion by dividing total conversions by the total cost
- ROAS, or Return on Ad Spend, calculates the cost-effectiveness of your company’s ad spending.
You can track all of these metrics using our Looker Studio Template featured here.
3. Use Looker Studio to Segment Your PPC Data
Looker Studio lets you generate reports that segment your customer data into separate groups based on set criteria. The most common segmentation categories for PPC campaigns include:
- Grouping potential buyers into groups by demographic and geographic area
- Separate data into categories based on the different products they buy
- Segmenting based on customer intention (keyword-level data)
- Grouping data based on your current CRM campaigns
- Drilling down to action insights data (competition analysis)
Separating your data into readable chunks gives you more clarity for your overall performance to easily tune in your active campaigns.
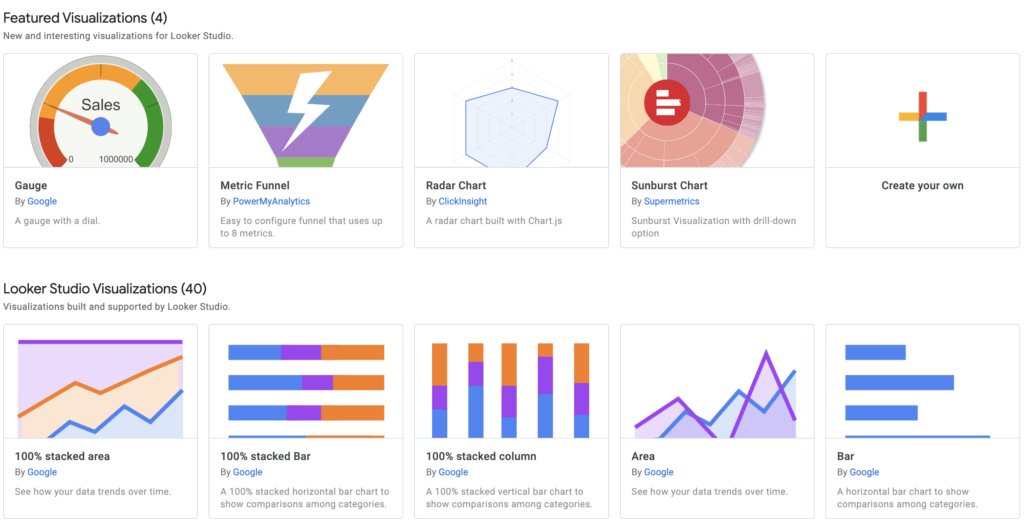
4. Make Your Reports Stand Out With Awesome Visuals
Looker Studio offers so many options to create specially-tailored reports to make your metrics not just easy to read, but also visually appealing. Effective visuals make reports more readable because they keep people interested and direct the eye to gain clear insights.
Check out our previous blog posts on how to customize charts and graphs using Looker Studio.
5. Schedule Report Deliveries and Automate Data Updates
Google Ads data source automatically refreshes data every 12 hours for real-time accuracy on your Looker Studio report. To schedule e-mail deliveries for your reports, switch your report out of edit mode into “Production Mode.”
To schedule deliveries, click on the three vertical dots in the top right corner of the dashboard and select Schedule Delivery. The drop-down menu allows you to set it to monthly, weekly, or even daily occurrences.
6. Share Reports with Colleagues and Clients
You can share reports on Looker Studios in one of several ways, depending on how much access you want other groups to have. On the Looker Studio dashboard, select the report you want to work with and click on the “Share” icon for the “share with others” menu to appear.
From there, you can choose access permissions, so other users can make edits or view-only.
Also, simply sharing a public link makes it possible for anyone to open the report in view-only mode.
Generate the Most Powerful PPC Reports
Every company’s marketing strategy needs to implement a robust PPC strategy to keep track of customer engagement and to sell the most products. Tracking data sources in real-time with optimal metrics leads to the most actionable insights for your company to lead with data-driven marketing strategies.
Databloo creates PPC report templates for your company’s needs. Visit our website to download Looker Studio templates that stand out.