Table of Contents
How to Monitor Your Google Ads
Business owners often face difficulties while managing their marketing campaign metrics. Integrating all the data regarding your campaign can be a task. Now imagine if you could visualize all that data in an attractive storytelling format!
With Google Looker studio, you can achieve this efficiently, thanks to Google’s data visualization platform. With our custom Google Ads Looker Studio Templates, you can collect data from data sources such as Google Ads.
Apart from campaign performance analysis, you can also monitor your budget. Furthermore, this data is easily shareable with your team and the clients. The best part – it’s free for all! With Looker Studio, Google Ads becomes easy for you.
This article will show you how to monitor your marketing campaigns better using Looker Studio. It will also make you aware of the specific features and how to benefit from them.
Why Use Google Ads With Looker Studio?
When it comes to business and marketing analytics, metrics information and critical reporting are essential tools. But data doesn’t need to be boring! Forget about the tedious excel sheets – interactive reports are the new way to go.
Looker Studio lets you access the updated data in real-time with multiple widget options, easy-to-read reports, and templates. To better manage your client’s personal information, you can even connect serverless data warehouses, like Google BigQuery.
Companies evaluate their financial performance on a Year-on-Year (YoY) and Period-on-Period (PoP) basis. This report allows you to compare the results of multiple measured events at once.
Custom Templates for Monitoring Google Ads Metrics
At Data Bloo, we provide dashboards that help you deliver ready-to-serve reports. This includes Quality Score reporting, Competitor Insights, YoY performance based on Demographics, and a complete breakdown of Conversion.
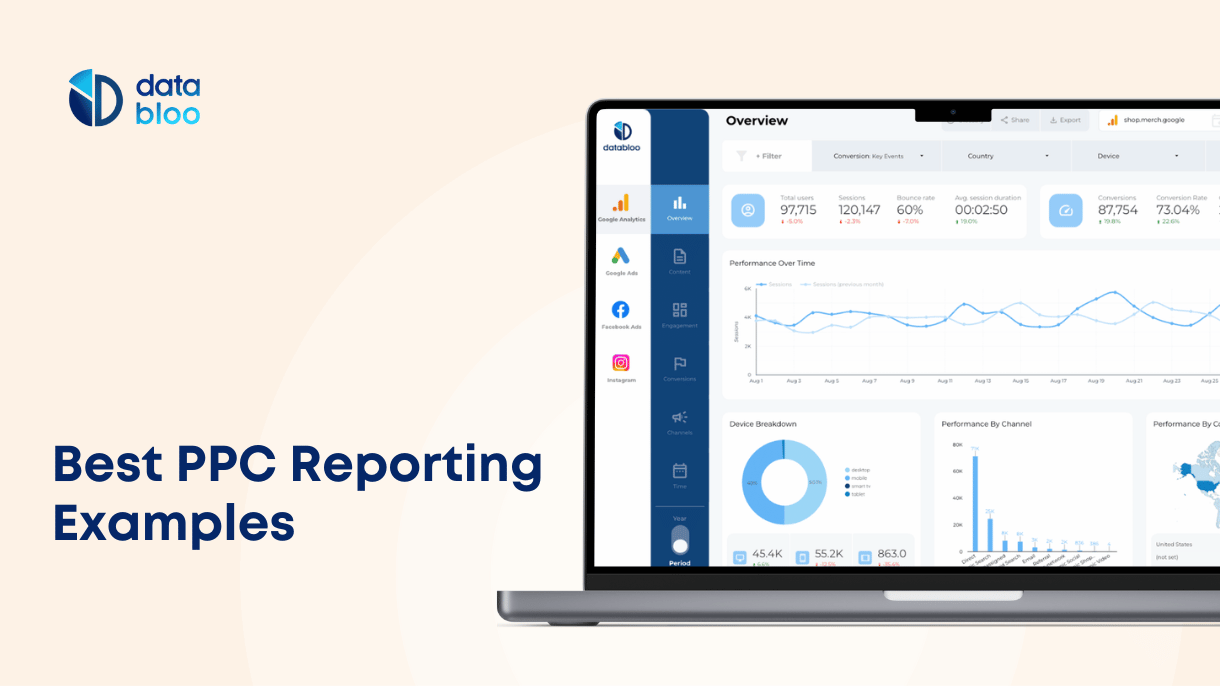
Do you need a clear insight about the Clicks, CTR, Conversion Rate, and Impressions? Google Ads lets you track that as well with Google Ads Metrics. For instance, our PPC Report templates in Google Looker Studio will instantly show the performance of your PPC campaign.
You can take advantage of our entire Google Ads Looker Studio template collection. Simply plug in your data to apply to your business, and you’re all set.
Our Essential Google Ads Template contains:
- An Overview page with Drill Down Dimensions
- Campaign Performance Insight
- Keyword Performance Insight
- Geolocation Performance Insight
- Impression Share and Competition Trends
- Overall Performance over Time
We will tell you more about how to take advantage of these features, along with some additional ones.
Overview With Drill Down Dimensions
With the introduction of Drill Down Dimensions within Charts, Google Looker Studio has made simple charts more interesting. With this feature, you can add a hierarchy to your charts to allow the end-user to get a greater level of detail from a single chart.
Our template offers you the transparency to explore more incredible details of data with the Drill Down option. You will find a rolling conversion for multiple months with a YoY comparison to track your Performance Over Time.
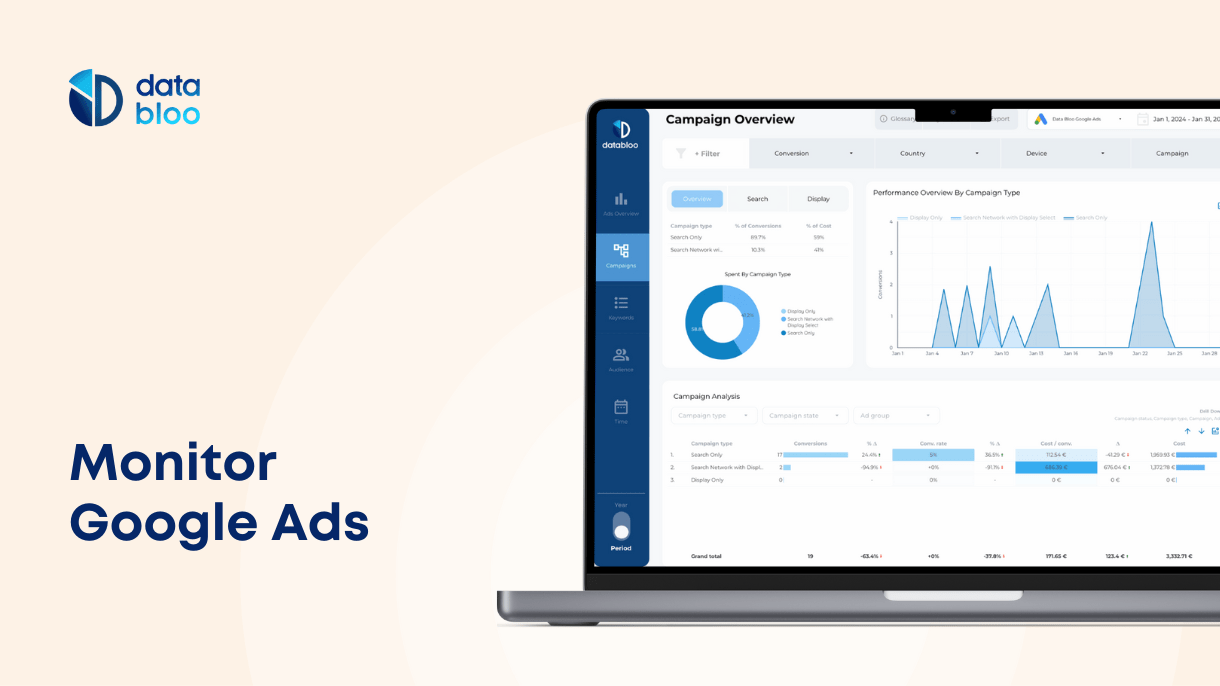
Campaign Performance Insight
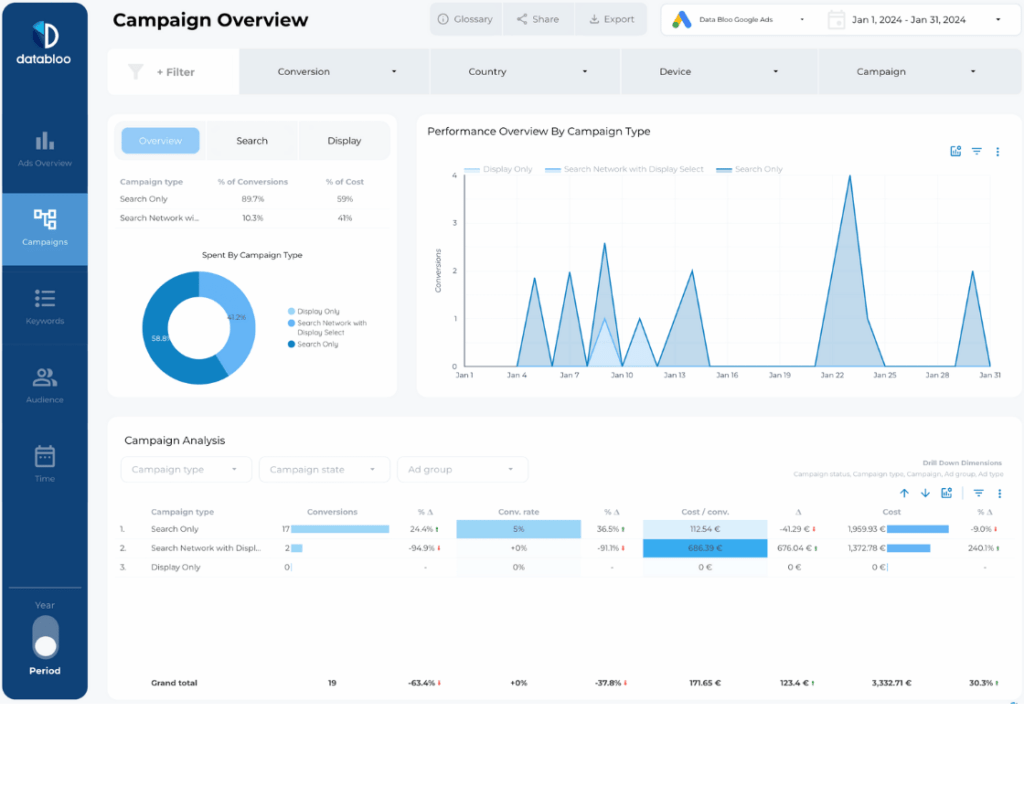
Depending on your Google Ads account hierarchy, the Campaign Performance insight page provides various in-depth data. It divides your data into three categories:
- Campaign Performance (your top converting campaigns)
- Campaign Type (a summary of the campaign types: Search Only, Display Only, Shopping etc.)
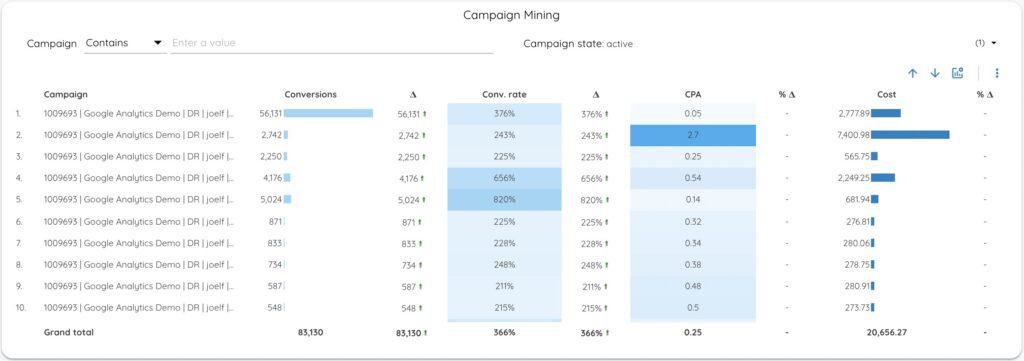
- Campaign Mining (a table with the main KPIs per campaign)
The Conversion and Cost per Action summary chart will give you a detailed insight regarding your conversion metrics. You can get a lot more details via the headline table as well. The Campaign Mining table will provide you with options to search by Campaign and Campaign Status, so you can easily find out the performance of your active, paused and deleted campaigns. On top of that you can use the report’s filters Country and Device.
Keyword Performance Insight
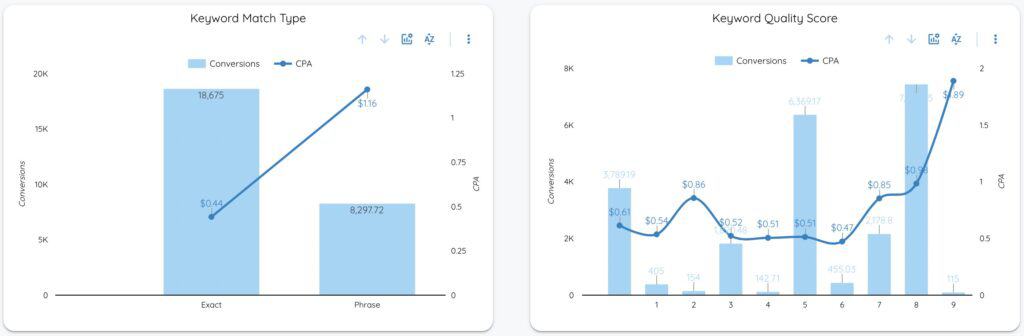
One of the critical features of our Essential Google Ads Template is that we have separated the Campaign Performance page and Keyword Performance page. The Keyword Performance page also divides your data into three segments:
- Keyword Match Type (Broad match, broad match modified, phrase match & exact match)
- Keyword Quality Score (the rating of the quality and relevance of your keywords)
- Keyword Mining (a table with the main KPIs for your top keywords)
While the Match Type and Quality Score summary charts allow a drill-down for a better overview, the Keyword Mining section allows a scroll down. You can easily spot keyword trends using the filters (Match Type, Quality Score). Additionally, you can make the appropriate ad bid adjustments based on your keywords’ performance. For instance, you can pause the keywords of your ads with low quality and low CTR.
Geographic and Demographic Performance Reports
Are you planning on running a granular marketing campaign? When a company develops products or services specific to a demographic market, knowing the audience is the key to success. Geographic and Demographic insight will therefore provide a more in-depth understanding of your audiences.
Our Geolocation Performance page will indicate the specific region your audiences belong. It will also provide a case-by-case analysis of the conversation rate for each of those regions. Moreover, the Audience Explorer table lets you drill down to the performance of specific Audience (group of people with specific interests and intents) and Audience Types (In Market, Affinity, Custom Segments etc.).
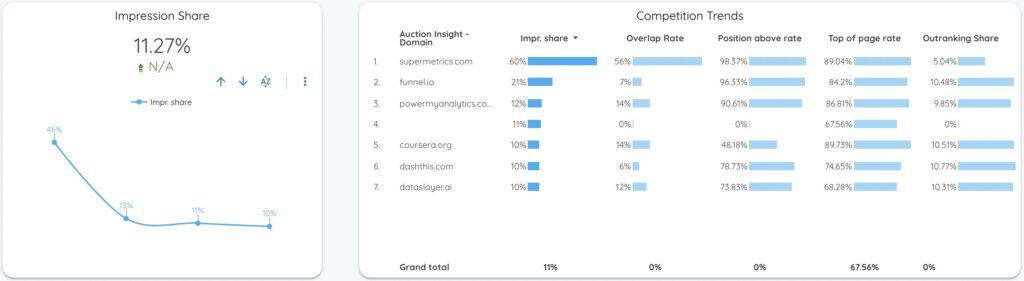
Impression Share and Competition Trends
One of the most crucial reporting part of a PPC Looker studio template, is measuring the competition. This part of our report shows interesting insights about your competitors and their focus on the paid ad campaigns. Apart from your Impression Share over time, you can easily find out a summary of other brands that bid on the same keywords as you do. Also, the Competition Trends table displays key metrics to analyze your competitors such as Overlap Rate, Position Above Rate and Outranking Share.
Dates Range Filter For Google Ads
If you need to update the dates frequently on your data reports, our Looker Studio templates have got you covered! The Advanced Data Filter can automatically configure the rolling dates for you.
With our interactive Date Range Filter, you can:
- Add date range to your report on Looker Studio
- Use the filter to compare changes in data over a time period
- Customize the timeframes
All you need to do is go to the Report Settings menu, select DATA, and click on a filter. You can even draw a shape on the part of the report where you want to add the filter.
Custom Looker Studio Report for Paid Search Campaigns
With Google Looker Studio, Google Ads campaigns across platforms are easily manageable. And thanks to our readily available Visualizations for Looker Studio, Paid Search campaigns are becoming more interactive for your clients.
Apart from regular line graphs and area charts, you can include reference lines in your reports. After all, why not go the extra mile to demonstrate how well your campaigns are performing!
Just take our Essential Google Ads Template as an example (embedded report below).
This simple dashboard can help reduce your sales cost instantly by summarizing your total paid search activity in 10 simple slides.
To Sum It Up
Remember, there is no pain in the campaign!
Monitoring your Google Ads campaign can be tricky. It would be beneficial if you stay updated about your CPC and ROAS performance. Also, budget monitoring is crucial in maximizing profit. And you have to do all this while creating brand awareness.
You can fine-tune your marketing goals with insights from our Looker Studio report for Google Ads. You can even measure your campaign performance by comparing the previous year (YoY) and period (PoP). Feel free to click at the following button and see how your Google Ads perform.