Table of Contents
It’s the data and analytics age and by all indications, Google is leading the charge.
Google Data Studio was released in 2016 and has set the standard for the way individuals and companies examine their data. The name of the platform was later changed to Looker Studio, and it’s a data visualization platform of choice for many.
Creating a faster Looker Studio report is a goal that many shoot for with their data analytics.
These tips can help you speed up Looker Studio.
Why Does Speed Matter to Your Reporting?
“Speed kills” is a saying used in sports, but it applies just as accurately to data. It matters in Looker Studio because you’ll be able to quickly access and analyze your performance and get quicker results, which leads to faster and more effective decisions.
You can use data visualization to make your information more digestible and easy to understand. When you’re able to optimize the speed of your Looker Studio dashboard, you’ll save reporting time and improve your productivity.
Why Is Looker Studio Sometimes Slow?
Make sure that you get to know the ins and outs of Looker Studio and what sort of matters make it run slowly. Whether you’re using a client dashboard or other data representation, it’s important to know the reasons behind its speed performance.
One reason Looker Studio may run slowly is if it deals with incredible amounts of data all at once. This is enough to slow down any system, especially if you haven’t gone out of your way to optimize it in a long time.
Looker Studio functions take a lot of data, so a full dashboard can cause a slowdown that drastically alters the experience. It might also experience performance issues if you are having network latency issues, or if you’re using 3rd party connectors.
4 Techniques to Make Your Reports Faster
Despite the above reasons for slow performance, you have plenty of things that you can do to make your Looker Studio report run faster. Once you know how Looker Studio works, you can take the right steps to enhance its performance significantly.
Three ways that you can make it run faster include:
1. Use Fast Native Connectors
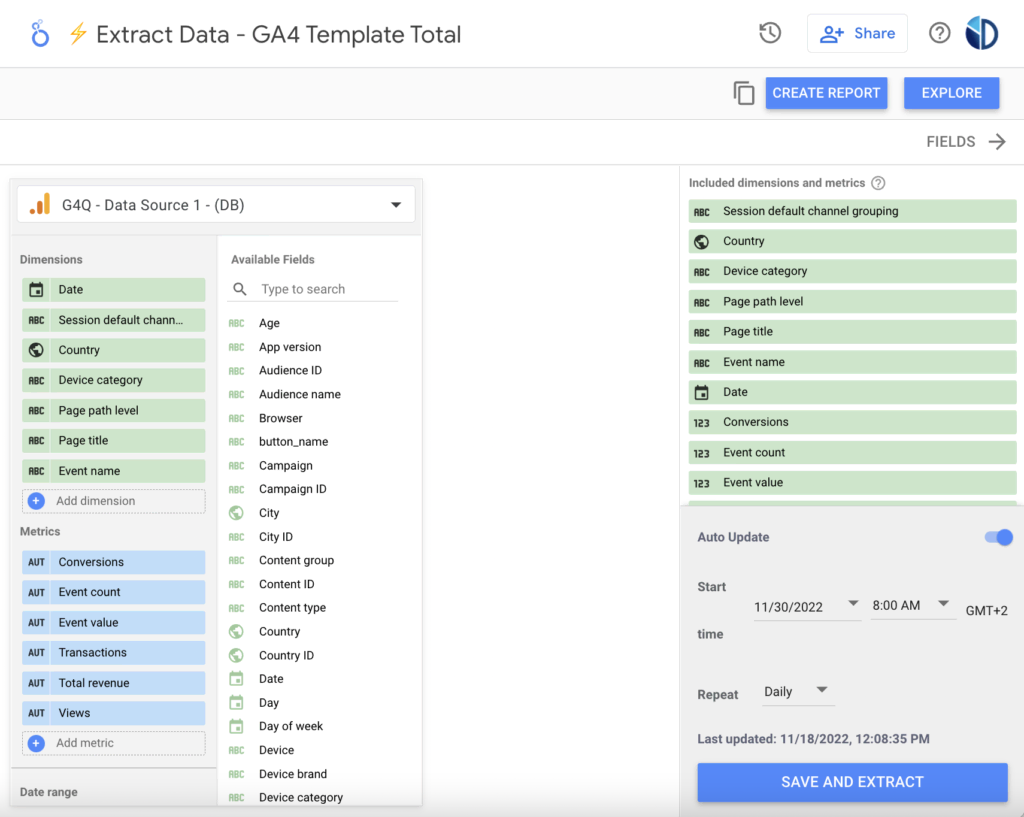
If you have a slow Looker Studio report, you might want to use some connectors to connect the application with your underlying data. Rather than choosing just any 3rd party connector, select those that are developed by Google.
Examples of some of the speediest native connectors include BigQuery Connector and Extract Data Connector. Having a direct connection as shown below, gives your Looker Studio the best chance to run smoothly and quickly.
2. Minimize the Use of Custom Calculations, Filters, and Data Blends
One of the benefits of Looker Studio is that it can run so many processes at once. This always boils down to multiple calculations, filters, and data blends. These custom calculations take up precious data that can prevent you from achieving the speeds that you need to.
Go into the settings of your reports and figure out how to minimize or reduce these uses so that you get the level of performance that you need. For instance, you can remove the unnecessary calculated fields in your data sources (resource > manage added data sources > edit data source), optimize the data blends that have in your report (resource > manage blends), and delete the outdated filters (resource > manage filters).
3. Reduce the Number of Charts
Keep in mind also that having multiple charts and widgets on a report page increases the number of queries made upon loading which can slow down your report’s performance. When you reduce the number of charts, you’ll remove the noise involved and will keep your system from running too slowly.
You can try consolidating multiple widgets into one, such as replacing a group of scorecards that share the same data source with a single table or combining multiple time series charts with different metrics under one graph including optional metrics.
Another way to reduce the charts of a page is by allocating them to multiple pages. By doing that, the report will still include the same amount of charts, but each page will require fewer queries, resulting in faster loading times. You can check our tips on how to create a custom or built-in navigation for your report.
4. Modify the Data Freshness
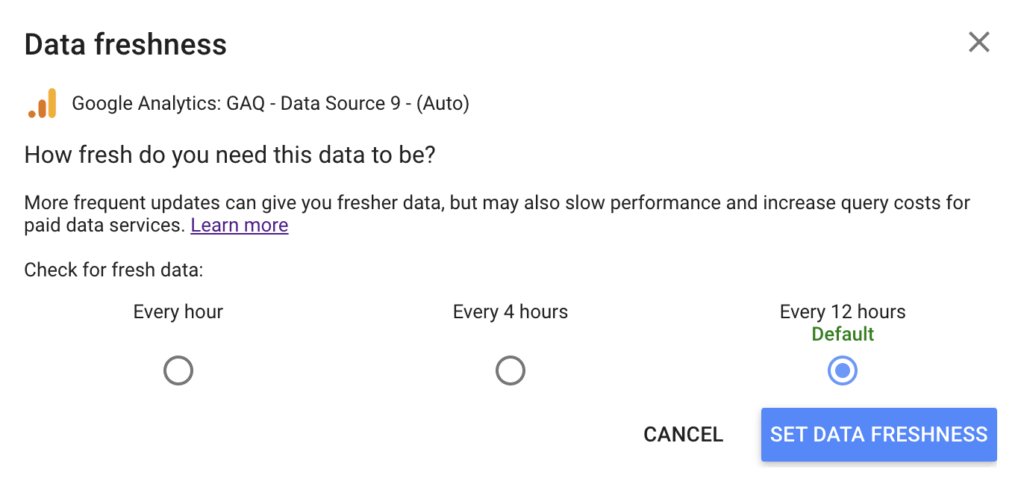
One other technique that you can try to optimize the performance of your Data Studio dashboard is to adjust the data freshness of the data sources. The data freshness shows how frequently your data is updated.
Instead of having more frequent updates, you can set the data freshness interval to a longer time period (i.e. every 12 hours) and utilize the caching feature of Looker Studio. Caching allows your browser to make a local copy of the most recent data, which can be accessed again without making the required queries from your data source. You can change the data freshness by editing the settings in your data source (resource > manage added data sources > edit data source > data freshness).
Examples of Fast Reports
Now that you know more about increasing the speed of your Looker Studio, you can check out some of the fastest Looker Studio examples:
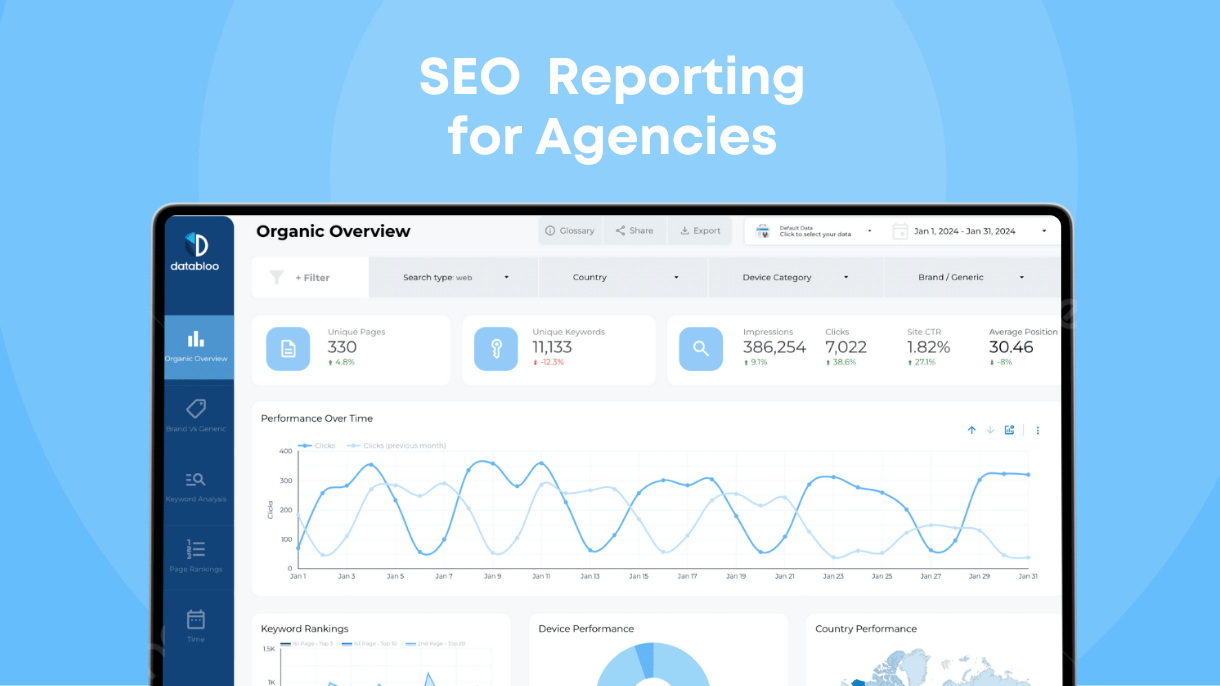
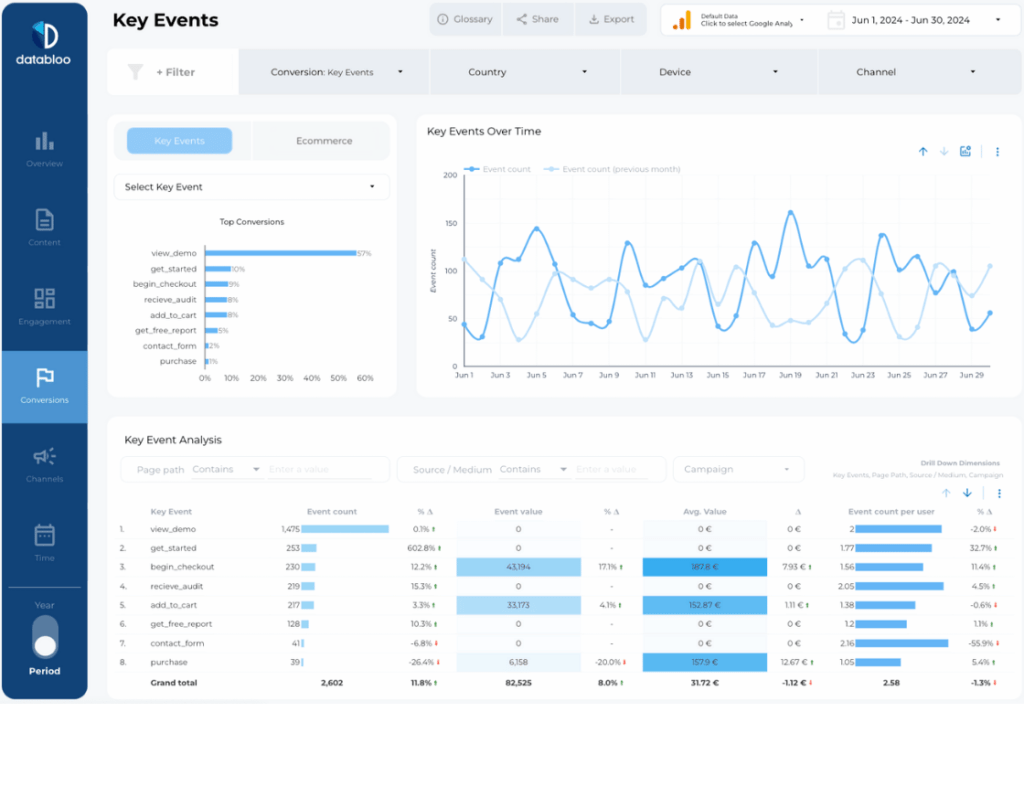
GA4 Looker Studio Report
As you figure out how Looker Studio works, make sure that you understand the GA4 Looker Studio Report. It utilizes the fast native connector of Google “Extract Data” in order to tackle the GA4 quota limits and get quicker results for your performance.
This report gives you plenty of precious data, such as a quick overview of the sessions, content analysis, events breakdown, conversion tracking and ecommerce & product trends of your store. You will have access to multiple maps, charts, and graphs that will help you visualize your data so that you add more context to it. Additionally, the GA4 Looker Studio report has been featured by Google in its official Looker Studio Gallery.
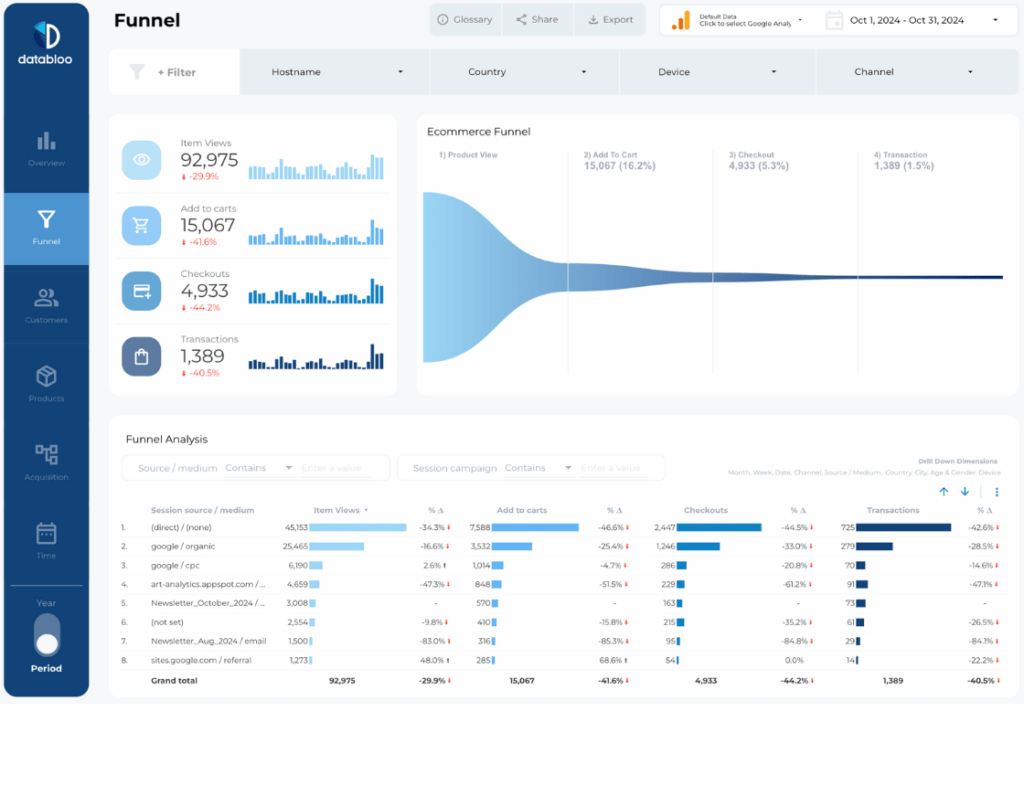
GA4 Funnel Ecommerce Conversion Template
This template takes your Enhanced Ecommerce data and gives you a funnel overview. Like the previous template, it utilizes the advantage of the “Extract Data” connector in order to make it faster in terms of speed performance, as it pulls only the necessary metrics (product view, add to cart, checkout, purchase) from your GA4 data source.
This funnel e-commerce conversion template will explain things like ecommerce ratios (i.e checkout conversion rate, and purchase conversion rate) which can be analyzed by key business dimensions such as devices, marketing channels, location, and ecommerce products. Taking the time to use this template will let you figure out how your Search Engine Optimization (SEO), Search Engine Marketing (SEM), e-mail marketing, and other strategies are performing across the buying process of your customers.
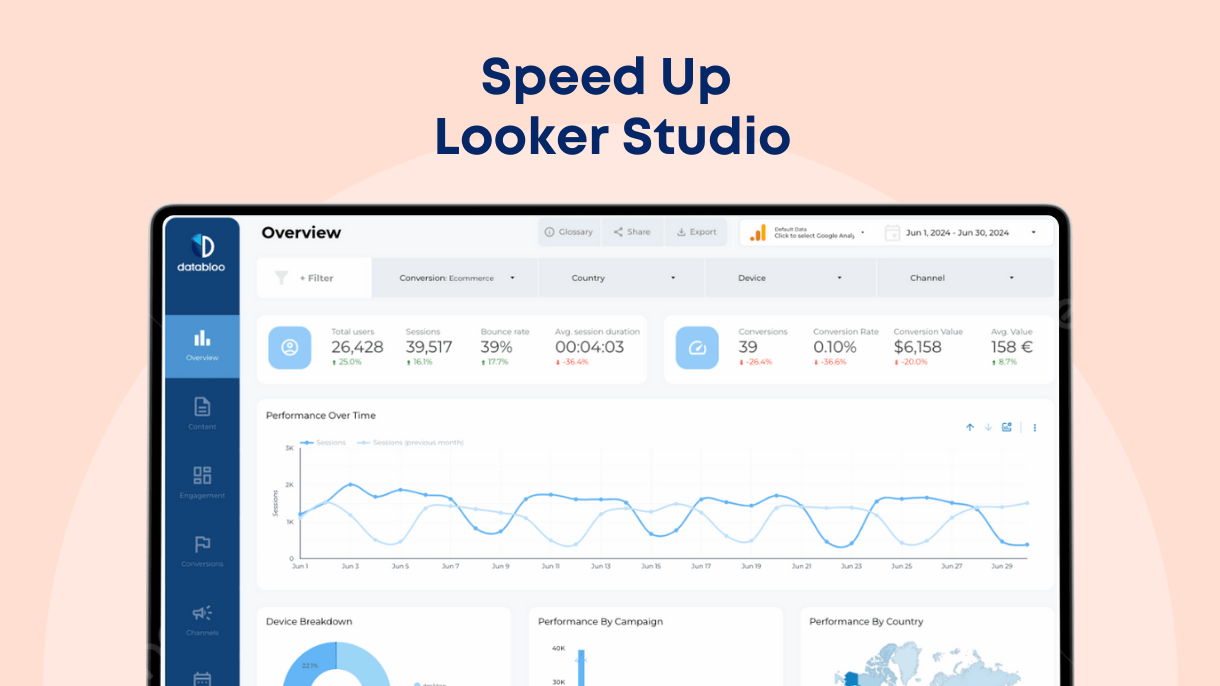
Speed Up Looker Studio With These Tips
If you’d like to speed up Looker Studio, the tips above are useful to you. Google has long been a standard bearer for data.
These tips help you understand some of the ways that you can get better performance out of this tool so that it can take your data visualization needs to new levels.
Data Bloo can assist you with your digital analytics needs. We have plenty of different templates, resources, and information that will help you get what you’re looking for out of the data that you use every single day. Our team can help you take the next steps when you’d like to move forward with data solutions that work the best.
You can contact us on our website in case you need further information or have a custom request.