Table of Contents
Currently, around 68% of businesses utilize some sort of digital marketing, and this number is growing year after year.
A solid client report system is an essential part of digital marketing. Having access to a client dashboard will give you insightful performance data to help you make decisions.
You might already have some sort of analytics dashboard in place, but if it doesn’t display the information you need or is too complicated to use, then it’s not going to help you grow your business.
In this article, we look at what a client dashboard should do, and the benefits of using one for business expansion. Read on to find out more.
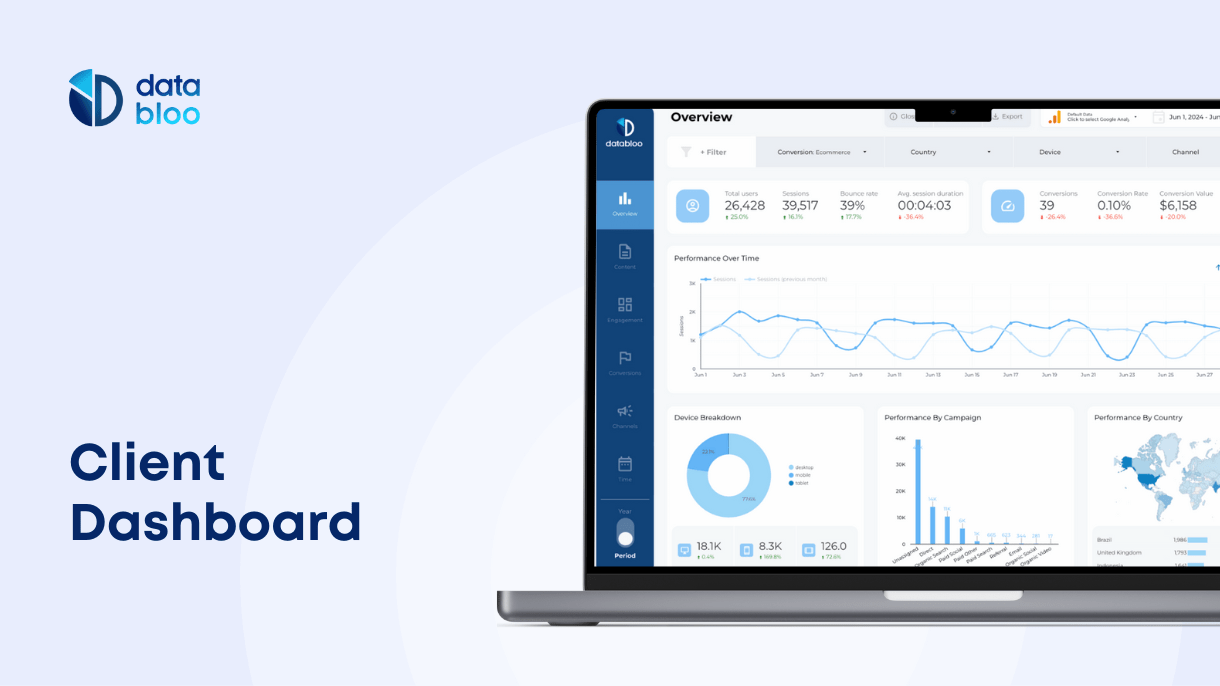
What Is a Client Dashboard?
A client dashboard is a type of management tool used by businesses to visualize and analyze data interactively. They pull data from a range of data sources and create dynamic reports to help increase productivity.
You might be wondering what the difference is between client dashboards and client reports. Both are vital for digital marketing, however where they differ is that a client dashboard works with real-time data, whereas a client report tends to focus more on historical data.
point further down.
Why Client Dashboards Are Crucial to Businesses?
There are numerous reasons why client dashboards are important for the website analytics of a business. Although every business is different, they do have one thing in common, and that’s to know where to make the most effective use of staff, and resources to help their company grow.
Here are some other benefits of using client dashboards:
- Help to enhance relationships and trust between agency-client, or business-to-business
- Improve the desicion-making of shareholders and keep them accountable
- Have real-time access to data which improves and encourages transparency
- Understand where time and resources can be better-implemented
- Gather website data from a wide range of data sources
- Save time on reporting process
How Do I Create a Client Dashboard?
Creating a client dashboard should be a straightforward task, if it’s not, then you should probably consider moving to a different dashboard software. There are many tools like Looker Studio that makes visualization easier for users. Below are the steps you should follow to create your personalized dashboard.
- Add your data sources
- Set the required metrics for the report
- Create a draft dashboard that will show how the report will look like
- Choose what type of chart you want to use
- Create the report navigation
- Build your custom report
If you need more details, then read this step-by-step article on how to create a custom report for your site.
3 Rules for the Perfect Client Dashboard
If you’re looking to create the best dashboard reports for your clients, colleagues, or boss then there are some rules you should follow. This will help you create the best client dashboard that’s easy to understand.
Less Is More
Keep to the facts, although you will have access to an abundance of data, stick to only showing information linked to KPIs. Always start with the high level picture and then drill down to details if needed.
The dashboard should be used so a client can see the information at a glance. It should clearly show what’s going well and what isn’t, allowing them to make an informed decision about the next actions.
Be Visual
The idea behind client dashboards is to make everything much easier to see. Staring at a whole page of statistics can be tricky to sift out the information. Be sure that your dashboard clearly presents your statistical information through the use of easy-to-understand charts and graphs.
Also, use intuitive navigations and visual elements to guide your audience. Be sure to label data (such as the X and Y axis on a chart). You can also include different font sizes to highlight important information, or images to demonstrate a situation. The idea is to make the data easy to intepret in a logical format.
Add Useful Functionalities
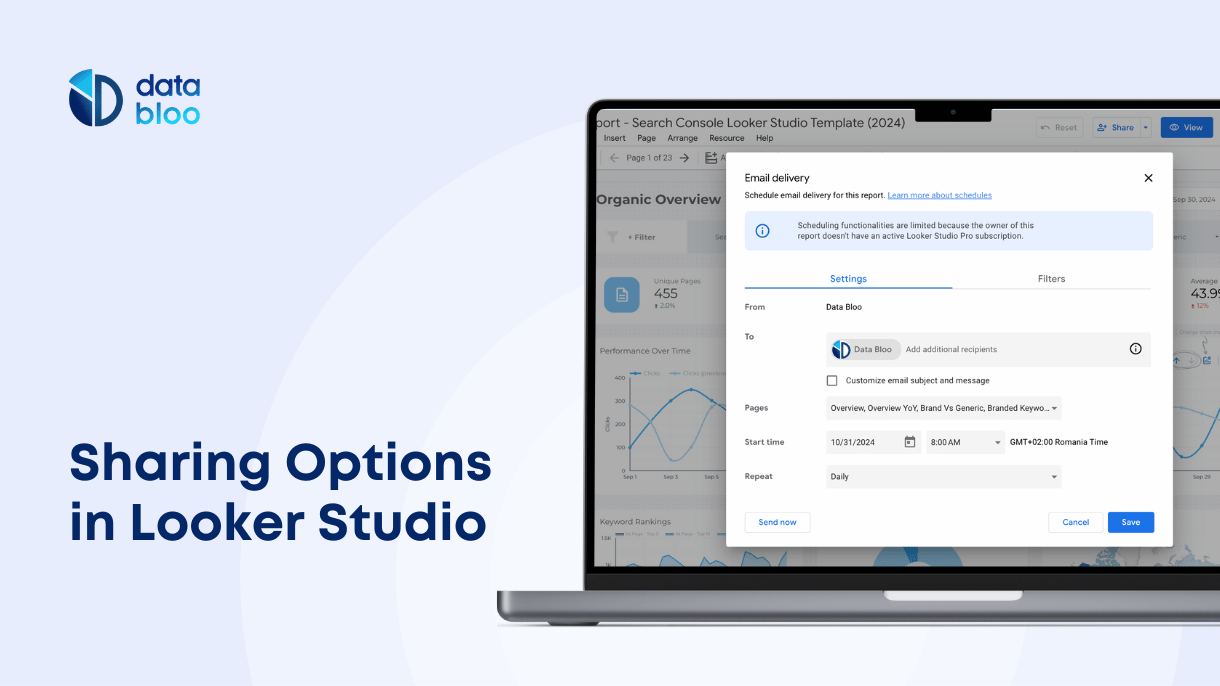
Make your dashboards user-friendly by utilizing different tools and functions. Some key things to make your dashboard more functional can include sharability, and accessibility across all devices.
You might also want to include an interactive version with links to sources for additional information or infographics to add more depth.
3 Client Dashboard Examples
The great thing with client dashboards is that they can be set up for any type of business. There is no one-size-fits-all approach to how you want to track data, and your business structure will reflect this. Here are three examples of how you can set up your dashboard.
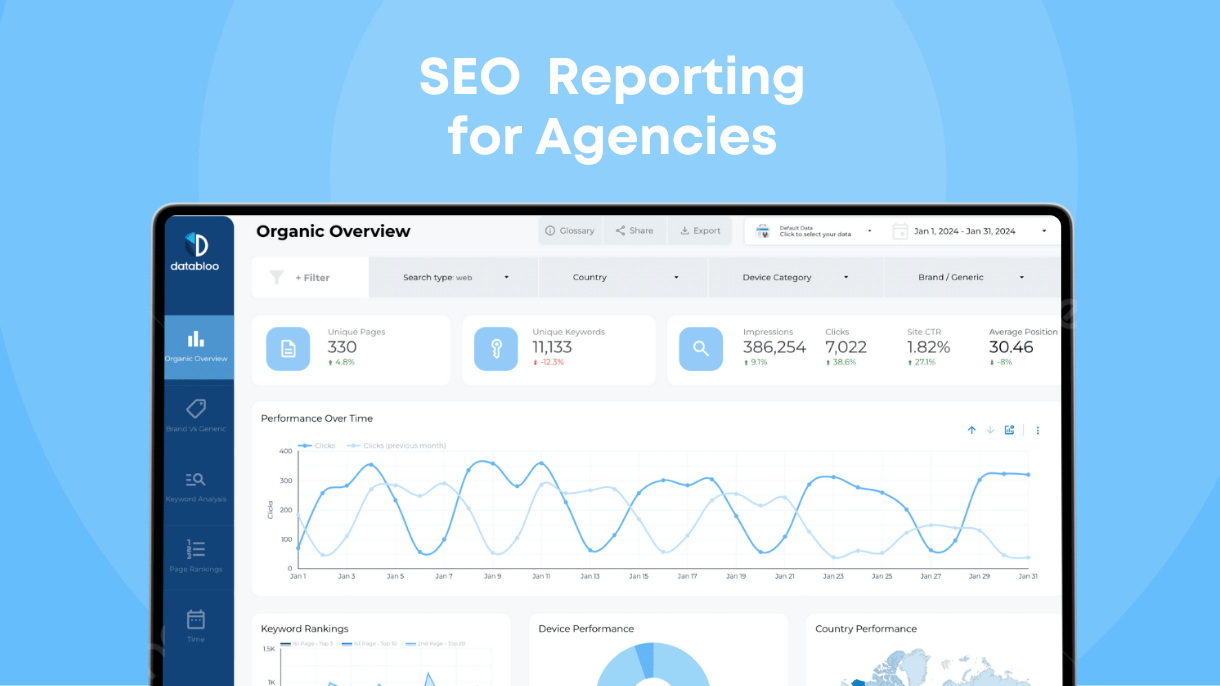
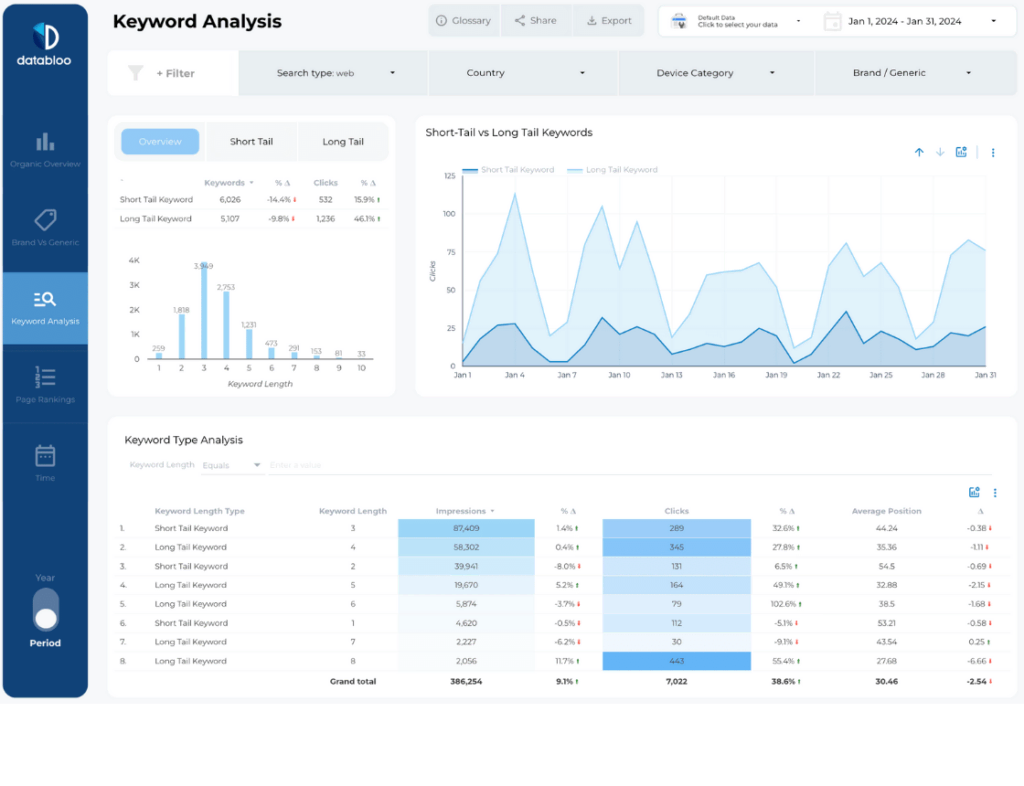
SEO Client Dashboard
If you’re looking to gain more insight on understanding the impact SEO and keywords have on your business, then you may want to use a template such as the Keyword Analysis Looker Studio Template.
This template lets you seamlessly monitor your organic search efforts by analyzing your keywords, showing what’s working, and identifying new content opportunities.
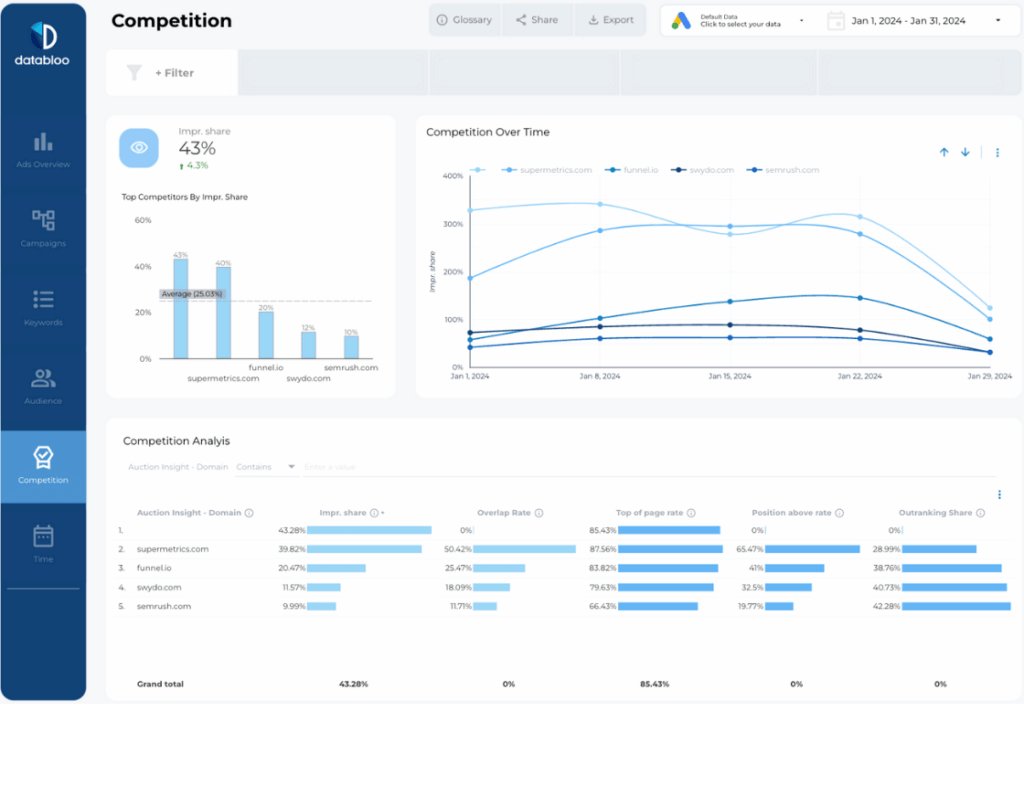
SEM/Ads Client Dashboard
If your business is interested in the impact of paid search activity, through advertising on Google, then a great option for you is the Google Ads Looker Studio Template.
In this Google Ads dashboard, you can discover how well your campaigns are doing, the locations and keywords that customers are using as well as the competition for each of your ads so you can tweak them immediately for a better ROI.
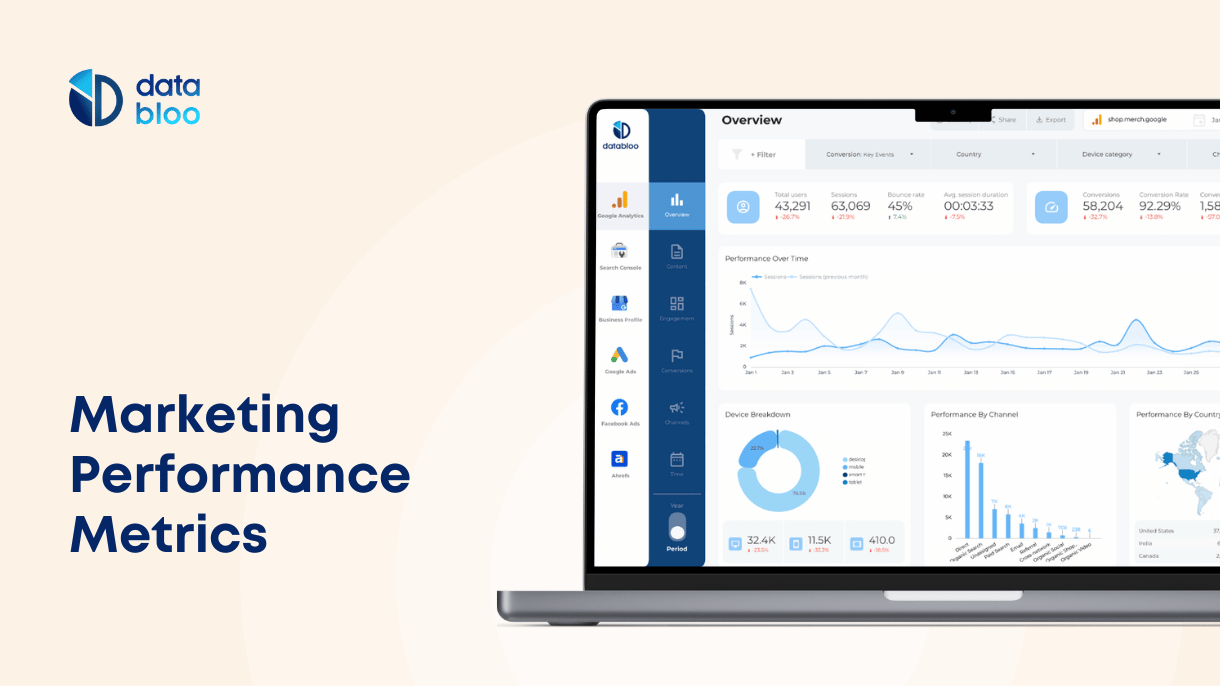
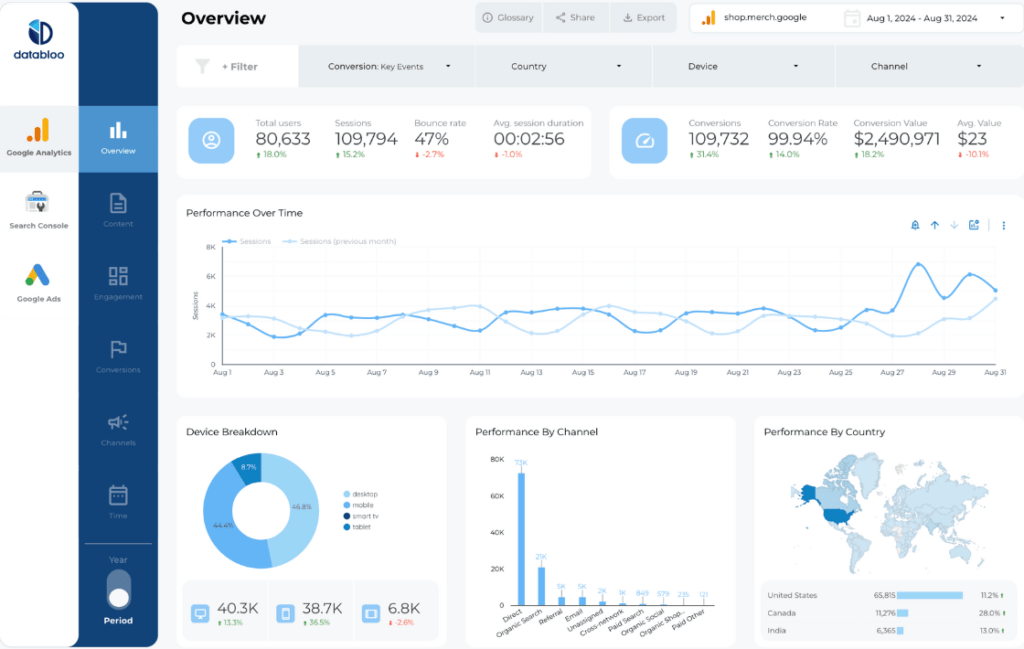
Multi-Channel Client Dashboard
If you need to track data from a whole range of sources, including web analytics along with the two we’ve just mentioned then the Website Master Template provides an all-in-one view of your business.
It gives comprehensive data ranging from site overview, and e-commerce reporting as well as organic, and paid search performance. This is a great example of a client dashboard as it combines key information for the most important data sources under one place.
How’s Your Client Dashboard Looking?
Still not sure where to find the most user-friendly client dashboard? We specialize in allowing businesses to make the most of their data. Through the use of our easy-to-use and intuitive dashboards, we help you analyze, optimize, and grow your online business.
Bring all of your marketing data across from different sources and turn your analysis into action based on our wide range of interactive templates. Contact our team today and try out a customized solution for yourself.