Table of Contents
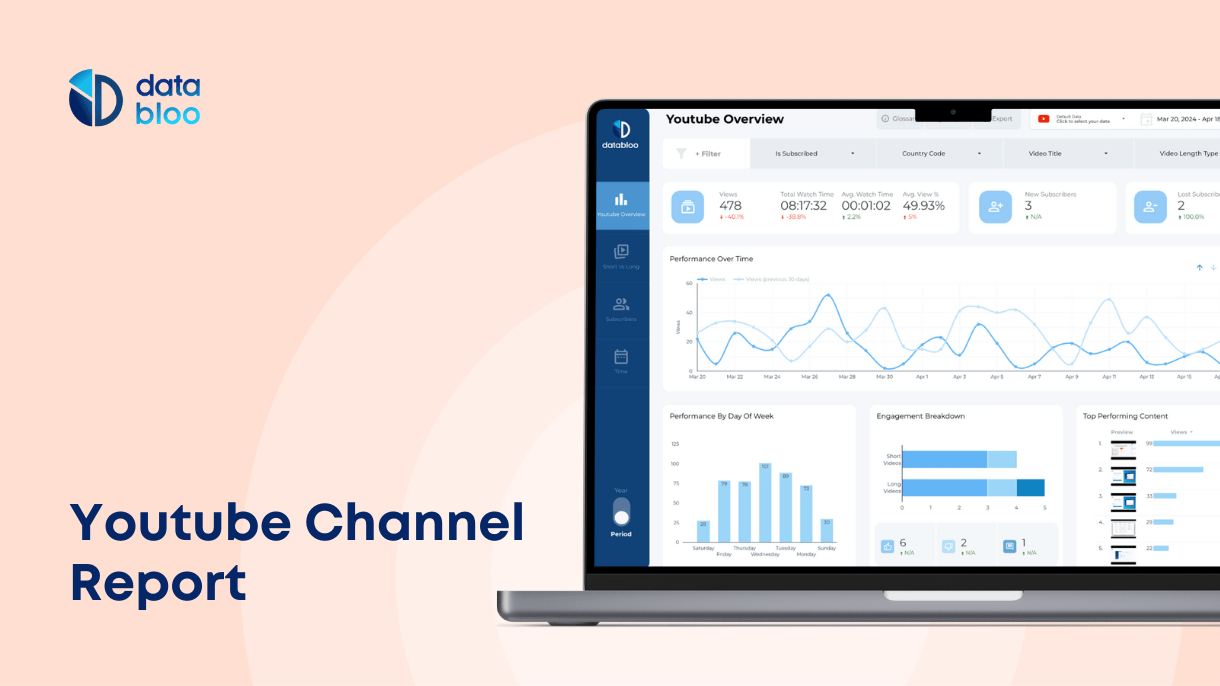
Youtube channel reports can help you evaluate the channel’s performance, check user behavior, and figure out a strategy to improve your content and increase your followers. Performance analysis can also increase your revenue from your youtube channel.
Not everyone is an expert in data analysis and visualization. That is where Looker Studio comes in. This cloud-based tool is the perfect choice for beginners who need to visualize and interpret data collected from different sources. With ready-to-use templates, this process can become even easier.
Let’s take a look at how you can use Google Looker Studio to generate a report to evaluate the performance of your Youtube channel.
What is a Youtube Channel Report?
Running a Youtube channel is not easy. It takes constant work and attention. You need to develop content that grabs the attention of your target audience, and then keep them hooked with regular content updates.
If you have a Youtube channel, then you would understand how important it can be to evaluate the performance of your channel and to strategize accordingly. That is why it is essential to regularly prepare and analyze Youtube channel reports.
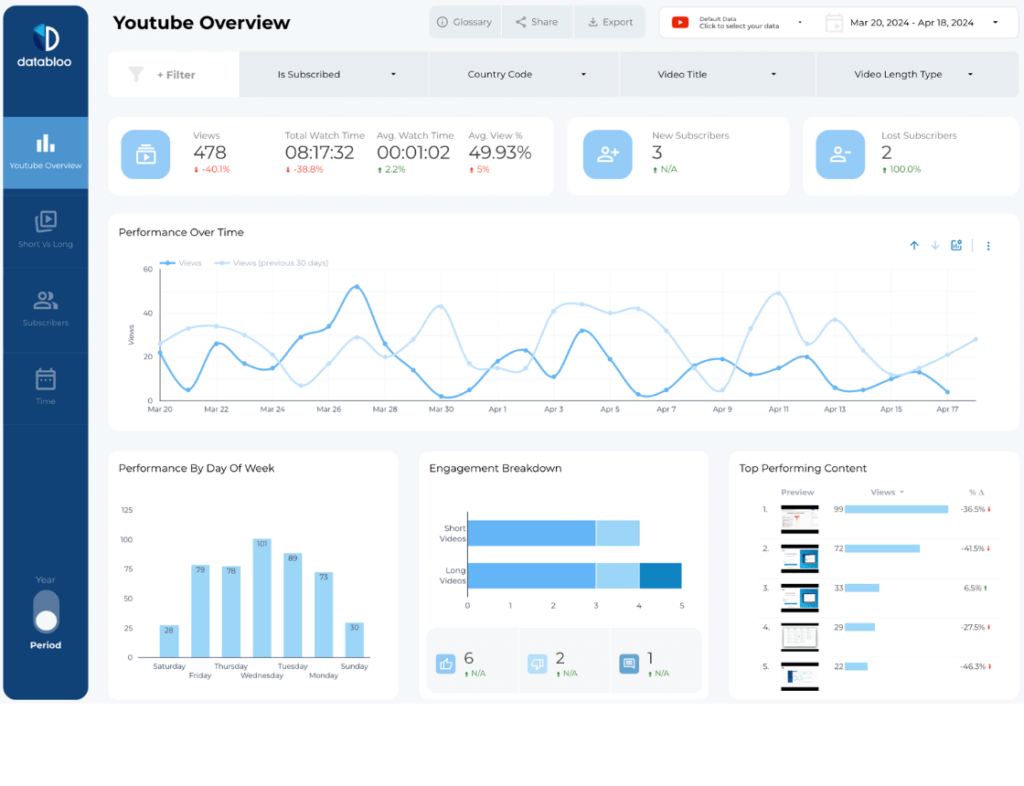
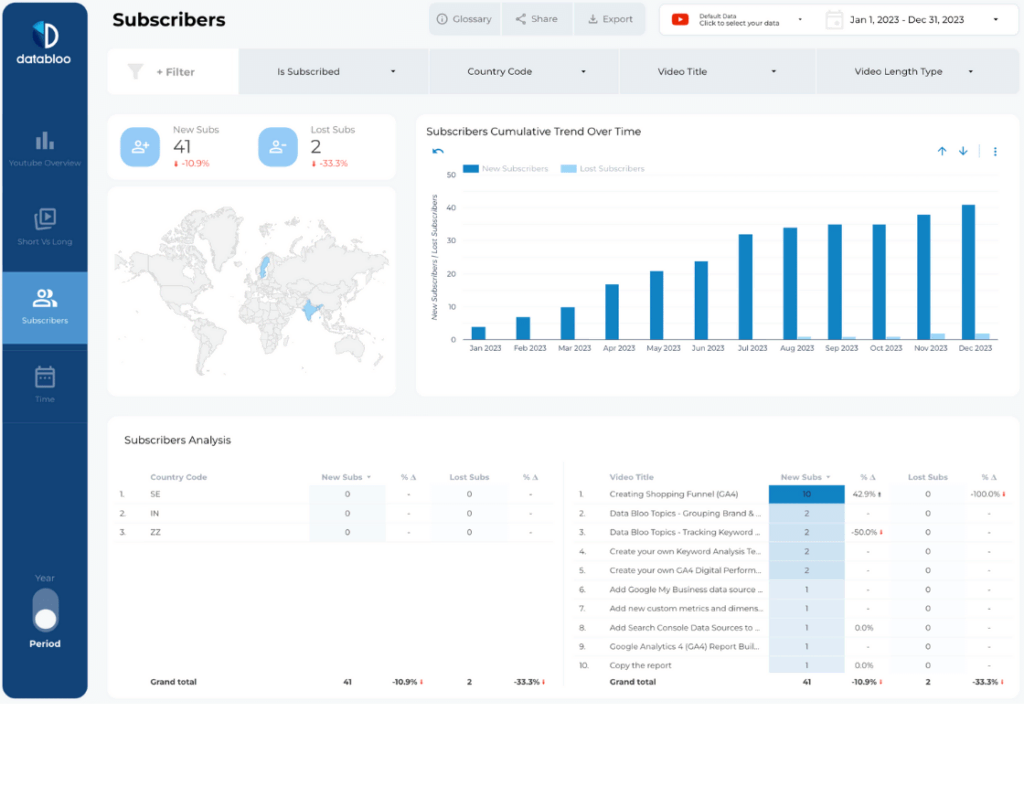
You can create visualizations in your report to check where your subscribers are based, how much time they spend on your channel, which content has the most views, likes, shares and comments. Once your report is done, you can analyze it and improve the performance of your channel based on your learnings.
Google Looker Studio can help you prepare reports for your Youtube channel. Data Bloo offers a creative and thorough ready-to-use report that you can use for this purpose.
5 reasons to use a Youtube Channel Performance Report
If you are wondering why you need to make a Youtube Channel Report, we have prepared a list of reasons that can show you why it’s essential.
- Analyze Behavior: Youtube channel report is the perfect way to analyze user behavior. You can use different metrics to evaluate what your subscribers like, and which videos are most viewed on your channel and resonate the most with the viewers.
- Improve Performance: By analyzing the Youtube reporting view, you can strategize how to improve your channel’s overall performance.
- Increase Awareness: Using a Youtube Channel dashboard, you can find where your subscribers are based (country / region) and create the content in such a way that is more relevant to them. This can help you generate more targeted video content and add more subscribers to your channel.
- Engage Audience: You can use your Youtube Channel Report to increase engagement. By keeping a lookout for what kind of content triggers the engagement of viewers, you can increase the user engagement considerably.
- Increase Revenue: As your performance improves, the Youtube channel reports can eventually help you increase revenue earned from the channel.
A Youtube Channel Report can help you do a lot more. By keeping track of what your subscribers are watching, you can make a strategy on how to improve the channel’s content and boost your overall Youtube KPIs.
How to create a Looker Studio Youtube Report?
Now that you know how important Youtube report is for your channel, you need to learn how to create it. Google Looker Studio is the perfect tool for data visualization. Here is how you can make report with Looker Studio:
Step 1: Choose metrics:
Youtube channel reports can help you accomplish a lot of different goals, such as increasing reach, improving quality of content or creating more user engagement. You need to know your goal, and then make a list of metrics that can help you check the performance and achieve the goal you have set.
Step 2: Find the right Looker Studio Youtube template:
If you are new to Looker Studio, a ready-to-use template can be lifesaver. You can use Looker Studio Templates for Youtube Channel to get started with your channel reporting in a few minutes. These templates can gather data and sort it into attractive visualizations.
Step 3: Connect Youtube as Data Source:
After you have opened your template in Google Looker Studio, you can add your Youtube channel as the data source. Here you will find the guide on how to connect your report to Youtube Analytics.
Step 4: Build your report:
After you have finalized your template and metrics, it’s time to start building your report. With a ready-to-use template, it would hardly take any time. Looker Studio allows you to create charts, graphs and other visualizations, and regularly updates data collected from the data source.
Step 5: Analyze your Youtube channel dashboard:
Once you have built your report, you can share it with other team members using the Looker Studio. You can now use the report to analyze and strategize how to proceed to accomplish your goal.
With these easy steps, you can get your Youtube Channel Report ready. You can use the report to analyze data and improve the performance of the Youtube channel. If you are worried whether your Youtube channel is not performing as expected and none of your strategies are paying off, use the Looker Studio to make a thorough Youtube channel report right away. With detailed analysis of the performance, you would be better equipped to make decisions about your Youtube channel.
Youtube Metrics to include in a Looker Studio Report
Metrics are the most important part of any performance report. They are necessary to help you track the changes in user response as well as the quality of your content. Metrics can also assist in making required changes to improve how your channel is performing. Here are some of the metrics that you can use:
- Audience growth – This can help you check how your content strategy is affecting the number of your subscribers.
- New Subscribers: How many people have recently subscribed to your channel?
- Lost Subscribers: How many people have stopped watching your content?
- Video KPIs – These metrics evaluate the performance of your content.
- Views: You can check the number of views by location, video length type (short and long videos), and video title.
- Average Watch Time: What is the average time users are spending on your videos content.
- Average View Percentage: This percentage determines how long your video was able to hold the attention of an average user.
- Audience Engagement – Metrics for audience engagement can help you determine the user response to your content.
- Video Likes: How many viewers have positively responded to your video?
- Video Comments: How many viewers have commented on your video?
- Video Shares: How many times have viewers shared your video with others?
- Video Dislikes: How many viewers have reacted negatively to your video?
The Youtube channel report is the perfect way to optimize your channel and increase your revenue. Check out our ready-to-use Youtube template that can save you time and give you an in-depth analysis into your channel’s performance.
